Editor’s Note: Well…we see little activity on the Schumann Resonance graph indicating the triggering type/amplitude of energy coming to Earth has not been seen in the past few days. But the Earth is still receiving another type of cosmic energy.
How do I know this? I am clairaudient and can “hear” these energies which are non-stop. So…even though the Schumann Resonance chart is not active, please know that cosmic energies are very much in play on Planet Earth causing feelings on bliss for some, and feelings of panic for others. Life on Earth is about to change in a major kind of way.
Please stay aware, know your own heart, be prepared for major positive change, and BE…
InJoy!
___________________________________________________________________________________________
8
Schumann Resonance Today. We will try to keep you updated about the variations of the Resonance with this page. The great variations that nobody can explain but that give us a clear sign that the planet is changing. The Earth is vibration higher and higher, just like us!
The Chart time is based on Tomsk – Russia – UTC +7 Source
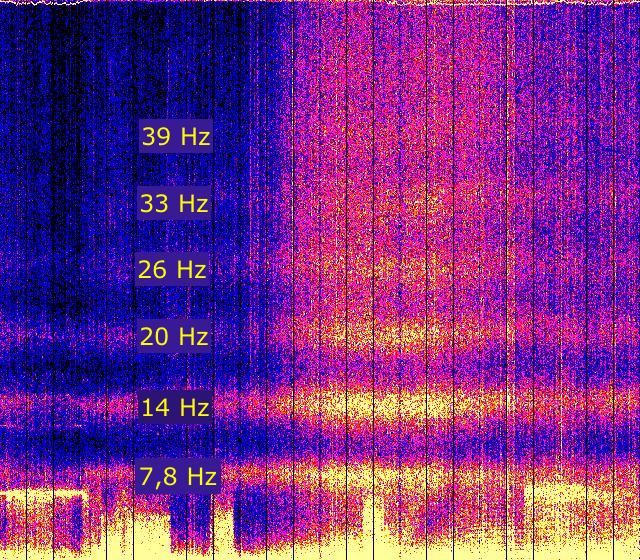
RS Base Frequency 7.83 Hz.
Schumann Resonance Today Peaks:
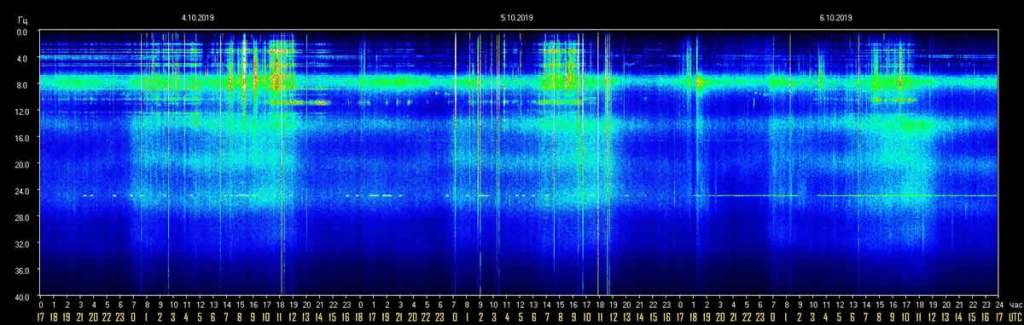
- 10/6 17:00 UTC – Calm.
- 10/5 17:00 UTC – Calm.
- 10/4 17:00 UTC – Practically calm, peak at 13 Hz at 11 UTC.
- 10/3 17:00 UTC – The pattern of slight daily increase, seems to be underway again, the activity saw a first isolated peak at 1 UTC which reached 17 CC and later, during a more relevant phase, 22 CC at 6:30 UTC.
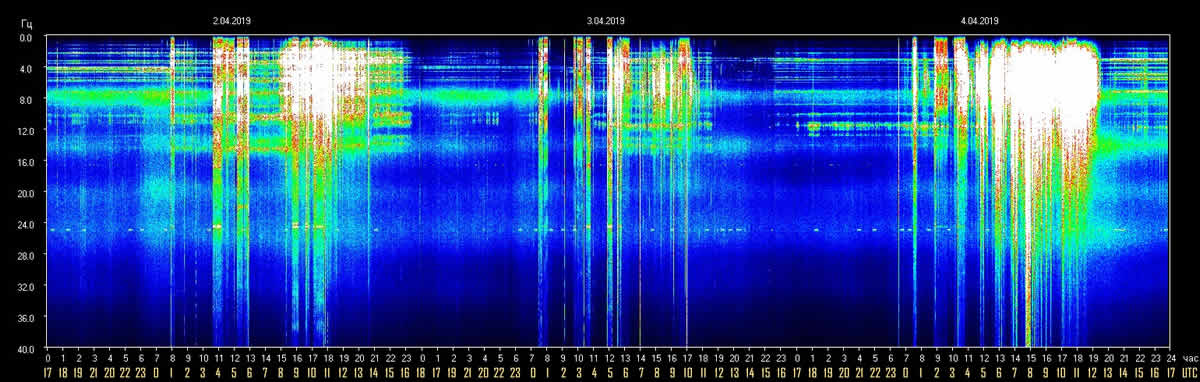
- 10/2 17:00 UTC – Slight activity limited to a period of about 10 hours, from 1 to 11 UTC, the maximum peak at 9 to 14 CC.
- 10/1 17:00 UTC – Very light activity during the central part of the day, the only significant peak reached 26 Hz at 4 UTC.
- 9/30 17:00 UTC – A new peak at 30 Hz closed the activity in today’s the chart but the light movements seems to continue.
- 9/30 10:00 UTC – Light and medium variations are continuing since yesterday. From 9 UTC yesterday, so for the past 24 hours we have been seeing continuous slight movements, in the new graph the highest peaks are shown at 2, corresponding to 19 UTC yesterday, and at 9:30 UTC today, at 30 Hz.
- 9/29 17:00 UTC – Today’s graphs show a sequence of isolated peaks of ever-increasing magnitude starting from 15 and ending at a maximum of 43 Hz at 12:45. This stronger peak occurred within a more intense period of activity, from 12:45 to 14 UTC, with various peaks around 40 Hz.
- 9/28 17:00 UTC – Today’s activity was concentrated in about 5 hours from 2 to 7 UTC as described above. Calm followed.
- 9/28 10:00 UTC – Light activity started around 23 UTC yesterday, with a constantly increase it reached the maximum of 35 Hz at 4 UTC. The movements continued on these values until 7 UTC when there was a rapid decline.
- 9/27 17:00 UTC – Even today the moderate period of activity, from midnight to 11 UTC, the maximum peak was 26 Hz at 8 UTC.
- 9/26 17:00 UTC – After a pause of about 12 hours, at midnight UTC slight variations began, around 13 o’clock the two strongest peaks of the day were evicted, 35 and 37 Hz. The entity of the variations began then to go down until it reached again calm at 13 UTC.
- 9/25 17:00 UTC – Today almost calm, the light activity began just before midnight UTC and lasted until 10, the peaks were between 10 and 15 Hz.
- 9/24 17:00 UTC – Even today, a day of medium activity. It started around midnight UTC and the central part was from 5 to 9 UTC during which the strongest peak of today occurred, 47 Hz at 7:40. After this animated phase there was a reduction in the variations with few isolated peaks at 26 Hz. From 13:30 UTC it’s calm.
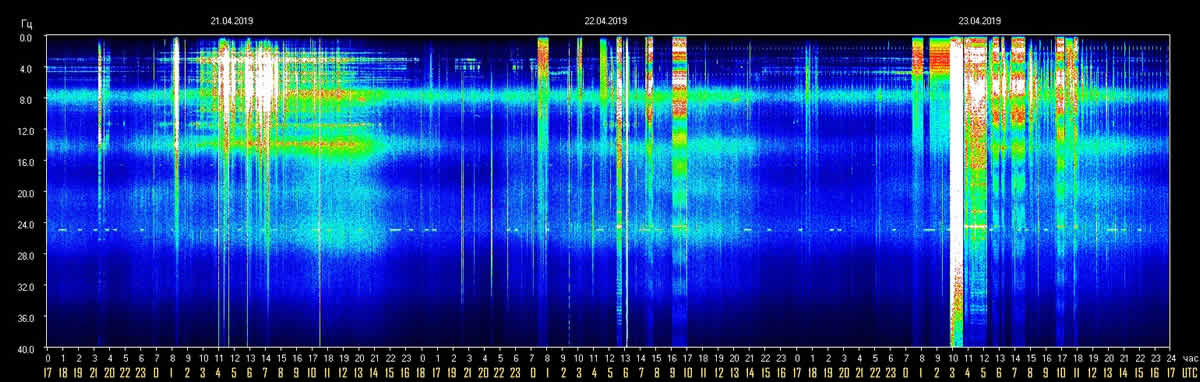
- 9/23 17:00 UTC – After the movements reported previously the activity continued to increase and shortly after, at 6:30 UTC, there was the strongest peak of the day that reached 62 Hz. After this, the variations were reduced with some isolated spike around the 20 Hz threshold.
- 9/23 08:30 UTC – After a brief pause of about 6 hours the slight movements started again lightly at 23 UTC. A series of most significant peaks took place from 4:30 am with a maximum of 21 Hz around 6 UTC.
- 9/22 17:00 UTC – Today the movements started at 4 UTC and from that moment we can see numerous peaks around 20 Hz, the strongest reached 25 Hz at 9:30 UTC. The activity is continuing.
- 9/21 17:00 UTC – Today’s movements lasted about 14 hours, from 23 UTC yesterday, the highest peaks are those reported previously. The situation now is calm.
- 9/21 10:30 UTC – The strong activity of yesterday was followed by a period of calm that lasted about 9 hours, until 23 UTC yesterday. From that moment on, a moderate but continuous activity began which generated various peaks at 25 Hz between 7 and 8:30 UTC.
- 9/20 17:00 UTC – Today’s activity lasted, in its maximum expression, around 9 hours, from 5 to 14 UTC. During this period the values remained above 60 Hz for about 6 hours, from 6 to 12. The time period above 40 Hz was from 6 to 12:30 UTC. Currently the values are back to normal. The 99 Hz were reached at 10:20 UTC.
- 9/20 10:30 UTC – We are getting close to 100 Hz, 98 at 10 UTC.
- 9/20 09:00 UTC – After a period of calm lasted several hours, at midnight UTC a new cycle of movements began, peaks remained moderate around 15 Hz for about 4 hours. At 5 UTC, however, started a very strong activity which in about 2 hours, at 7:20 UTC, led to a massive peak at 95 Hz.
- 9/19 17:00 UTC – The activity reported previously was the only one today, started at 6 and returned to normal values at 11:30 UTC.
- 9/19 10:00 UTC – Much of today has been calm, the first sign of movement was at 4:30 UTC and anticipated a strong activity that seems to be of short duration, about 2 hours; at 9 UTC we have had what up to now is the largest movement at 66 Hz.
- 9/18 17:00 UTC – Today, practically continuous activity, even if of very moderate magnitude, the most “lively” part was from midnight to 11 UTC with a maximum peak at 20 Hz at 4:20 UTC.
- 9/17 17:00 UTC – The peak reported previously was the first of a 40 Hz activity phase that lasted 4 hours, from 12:30 to 16:30 UTC. The peak at 40 Hz occurred at 13:20.
- 9/17 14:30 UTC – The activity remained in a calm condition until midnight UTC when slight movements began. Suddenly at 6:30 and 7 UTC two peaks occurred, the first at 30 and the second at 38 Hz. These were followed by a further calm until a 38 Hz movement at 13:45.
- 9/16 17:00 UTC – Calm.
- 9/16 08:30 UTC – Usual activity around the 17th of the month. Today the movements started in a rather sudden and powerful way but initially with isolated peaks, the first was just before midnight UTC at 30 Hz. This was followed by 44 Hz at 6 UTC and then what is now the strongest, 63 Hz at 8 UTC.
- 9/15 17:00 UTC – After about 8 hours of calm, at 1 UTC, a slight activity began with no significant peaks.
- 9/14 17:00 UTC – The activity, even if light-moderate, continues incessantly. As in the last three days it has been a constant oscillation on 10-15 Hz with sporadic more significant movements. Today the relevant part goes from 10 to 16 UTC with a series of spikes the highest of which reached 34 Hz at 14:30 UTC.
- 9/13 17:00 UTC – The activity that started yesterday at 18 UTC lasted 5 hours, until 23 UTC, it has been a powerful movement even if the maximum peak was 38 Hz. For the rest of the day there was a continuous slight background activity.
- 9/12 21:30 UTC – The new graph shows what appears to be the beginning of a significant activity, these movements started at 18 UTC and are in progress, the highest value so far has been 37 Hz.
- 9/12 17:00 UTC – After the solitary spike previously reported, the activity continued but of low entity.
- 9/12 10:00 UTC – The new graph shows a first peak last night at 6 pm UTC which reached 28 Hz, followed by a period of relative calm until 5:30 UTC when a powerful spike reached 49 Hz.
- 9/11 17:00 UTC – Even after previous significant activity the movements continued, but with relatively low peaks, 20 Hz, and are continuing around this magnitude.
- 9/11 10:00 UTC – There was no actual pause after yesterday’s activity, the movements continued with a peak to 29 Hz at 20 UTC while a more powerful activity occurred from 8 UTC with two peaks above 40 Hz the strongest of which to 43 Hz at 9 UTC.
- 9/10 17:00 UTC – Calm. The movements ended at 10 UTC.
- 9/10 10:30 UTC – Today’s chart shows an activity similar to yesterday’s, with isolated peaks, but slightly more continuous. The movements started at 23 UTC yesterday with slight variations. The most significant peaks occurred in rapid succession from 8 UTC with the maximum value 34 Hz at 8:20 UTC.
- 9/9 17:00 UTC – After the two peaks previously reported, another one occurred at 20 Hz at 10:30 UTC after which it was calm.
- 9/9 11:00 UTC – A pair of isolated peaks has been the activity of today until now, the first at 7:30 UTC has reached 27 Hz, the second peak 1 hour later at 8:30 UTC has been at 37 Hz.
- 9/8 17:00 UTC – Even today, looking at the chart, one has the feeling that the activity, in the last four days, is gradually decreasing. Today the movements lasted 6 hours, from 6 to 12 UTC, the maximum peak was 23 Hz at around 7 UTC.
- 9/7 17:00 UTC – Today’s graph shows that in the last 3 days there has been a decline in the intensity of the activity. Today the movements started at 5 and lasted until 11:30 UTC, during this period the maximum peak was 30 Hz at 8:30 UTC.
- 9/6 17:00 UTC – Today’s activity period lasted for about 12 hours, from 23 UTC yesterday to 11 UTC today, now the situation is calm.
- 9/6 10:30 UTC – The activity today started at midnight UTC with small variation on the 15 Hz threshold, from 4 UTC the values increased slightly reaching 20 Hz, at 8 UTC we had the strongest peak until now that reached 44 Hz.
- 9/5 17:00 UTC – The activity after the strong movement described earlier remained calm. The black band is due to lack of data for that time period.
- 9/5 10:00 UTC – The TSU site had some glitches until now, the surprise update shows us a strong activity. The opening was given by an isolated peak at 55 Hz followed by a period of about 2 hours of strong movements culminating with a 67 Hz spike at at 8:30 UTC.
- 9/4 17:00 UTC – Another spike at 27 Hz occurred during a short period of activity lasted 1 hour from 11:30 UTC.
- 9/4 10:00 UTC – The activity continued uninterrupted even today, the most significant part up to now has started at 7 UTC and has led to a peak at 40 Hz just before 8 UTC.
- 9/3 17:00 UTC – Even in today’s chart we can see that there wasn’t a real calm. The periods of most intense activity were two: the first from 7 to 9 UTC which reached the maximum at 20 Hz; the second from 14 to 15 UTC with the maximum at 36 Hz.
- 9/2 17:00 UTC – The situation, after the previous peaks, is in a phase of calm.
- 9/2 11:30 UTC – The variations continued practically without interruption even if with moderate values, at 7 UTC a more significant activity began which led to a peak at 69 Hz at 8 UTC followed by another at 40 Hz about an hour later. This period of elevated activity lasted about 2 hours.
- 9/1 17:00 UTC – There has been no pause, although without excessive values the activity has been continuous and seems to last longer. An isolated peak at 37 Hz occurred at 12:20 UTC.
- 9/1 09:00 UTC – Movements restarted shortly after the midnight shown on the chart, corresponding to 17 UTC. Peaks were moderate with the strongest that reached 36 Hz at 20:30 UTC. After this a period of variations started with the average value being at 20 Hz for 6 continuous hours, from 23 to 5 UTC this morning.
- Frequency means how many wave cycle happen in a second, 1 Hz. means 1 cycle per second, 40 Hz. means 40 cycles per second, Amplitude is the size of the vibration, how big is the wave, the chart shows the frequency variation in Hz and the amplitude using the white color.
Note
The Ancient Indian Rishis called 7.83 Hz the frequency of OM. It also happens to be Mother Earth’s natural heartbeat rhythm Schumann resonances are named after professor Schumann who was involved in early German secret space program and was later paper-clipped into the United States. The frequencies of Schumann resonances are fairly stable and are mainly defined by the physical size of the ionospheric cavity. The amplitude of Schumann resonances does change and is bigger when ionospheric plasma gets excited. Ionospheric plasma excitation happens because of solar activity, thunderstorms, use of scalar plasma weapons and HAARP and lately also when the Light forces are clearing the plasma anomaly.

Dependencies of Amplitudes Schumann Resonance October 6 2019

Dependencies of Quality Schumann Resonance October 6 2019

Dependencies of Frequency Schumann Resonance October 6 2019
Schumann Resonance Differential Peaks
Schumann Resonance PDF Archives
Images Archive
All the SR daily images in one single pageSee the Images

Explanation of The Chart
The Schumann Resonance Spectrogram Chart
The Schumann Resonance Chart displays data from the magnetic field detector to monitor the resonances occurring in the plasma waves constantly circling the earth in the ionosphere. These three days spectrograms show the activity occurring at the various resonant frequencies from 1 to 40 Hz. Within the spectrogram, the power, or intensity level of each frequency is displayed as a color, with white being the most intense. The Schumann Resonances appear as the horizontal lines at 0.0, 4.0, 8.0, 12.0, 16.0, 20.0, 24.0, 28.0, 32.0, 36.0 & 40.0 Hz. This chart is based on Tomsk, Russia, time UTC +7 (UTC = Universal Time Coordinated).
What is a Spectrogram?
The Spectrogram Calendar is a visual representation of the range of frequencies in the magnetic field at a given location. Similar to how an equalizer displays the frequency content of music played on your stereo, the spectrogram calendar displays the frequency content of a magnetic field. Instead of showing a brief snapshot, it shows changes over a period of time, in this case 3 days.
The local magnetic field is a dynamic field that changes constantly because of variations in the ionosphere and sun and many other influences not yet fully understood. The range of variation displayed in the spectrogram chart is from 0 to 40 cycles per second. The vertical axis is frequency and the horizontal axis is time. The amplitude of a particular frequency at a specific time is represented by the intensity of color (green, yellow, white) of each point in the image.

What is the Schumann Resonance?
The Herathbeat of Planet EarthRead

Clicks on the Ads Keep Us Alive

Door
When a door closes, another door opens. But often we look so long at the closed one.. we don’t see what was open for us.
Paulo Coehlo


