Editor’s Note: Today, on the start of New Galactic Year, we see a slight low density/low amplitude “fluttering for the Schumann Resonance energies from 1am through 6am on 7/26 (all times EDT, USA).
Thanks for staying aware of your energetic world as our physical world changes, leaving us to BE in…
Quantum Joy!
___________________________________________________________________________________________
Schumann Resonance Today. We will try to keep you updated about the variations of the Resonance with this page. The great variations that nobody can explain but that give us a clear sign that the planet is changing. The Earth is vibration higher and higher, just like us!
The Chart time is based on Tomsk – Russia – UTC (Universal Time Coordinated) +7 – Source
SR Base Frequency 7.83 Hz. – Schumann Resonance Today’s Peaks
18
Amplitude
9.00
Quality
8.03
Frequency Max
7.55
Frequency Min
13
Ampltude A2
6
Ampltude A3
6
Ampltude A4
“Every second, a multitude of pulses travel around the world in this unique, resonant chamber between Earth and the ionosphere, sending colluding signals to all microorganisms. These signals couple us to the Earth’s magnetic field. Named after their discoverer, these Schumann Resonances (SR) drive the harmonizing pulse for life in our world.” Eric Thompson


1/73/75/77/79/711/713/715/717/719/721/723/725/7020406080100
| x | Amplitude | Average |
|---|---|---|
| 1/7 | 85 | 85 |
| 2/7 | 75 | 80 |
| 3/7 | 18 | 59 |
| 4/7 | 68 | 62 |
| 5/7 | 41 | 57 |
| 6/7 | 99 | 64 |
| 7/7 | 35 | 60 |
| 8/7 | 23 | 56 |
| 9/7 | 69 | 57 |
| 10/7 | 82 | 58 |
| 11/7 | 12 | 55 |
| 12/7 | 58 | 55 |
| 13/7 | 10 | 52 |
| 14/7 | 44 | 51 |
| 15/7 | 21 | 49 |
| 16/7 | 70 | 51 |
| 17/7 | 23 | 49 |
| 18/7 | 8 | 47 |
| 19/7 | 52 | 47 |
| 20/7 | 81 | 49 |
| 21/7 | 30 | 48 |
| 22/7 | 55 | 48 |
| 23/7 | 20 | 47 |
| 24/7 | 48 | 47 |
| 25/7 | 17 | 46 |
Amplitude Max Values and Average – Schumann Resonance Today
More ChartsTell Us What You Feel! How to Read the Graphs


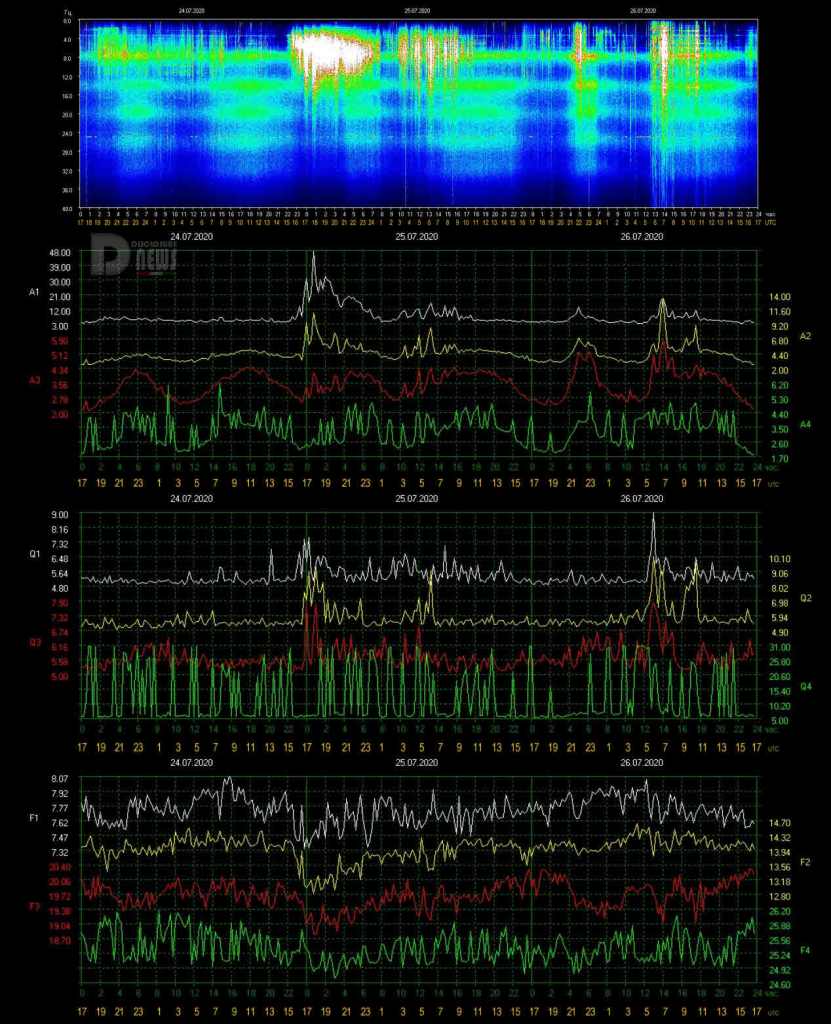
| 7/26 17:00 | Even today as yesterday at 11 UTC the situation has calmed down totally, but only as regards the Amplitude and the Quality as the Frequency remains low, around 7.60 Hz, we will see if this will lead to movements. |
| 7/26 08:00 | The calm that began yesterday at 11 UTC was interrupted at 21 UTC by a slight movement that reached Power 15 at 22, these peak occurred simultaneously with a temporary lowering of the Frequency value to about 7.60 Hz. The situation has returned almost calm shortly after. From 5 UTC there has been a rapid drop in Frequency which has led to a peak in Quality and changes in Amplitude that reached Power 18 at 7 UTC. |
| 7/25 21:30 | Total calm, the Frequency is back to base value of 7.83 Hz and apparently going above. |
| 7/25 17:00 | From 11 UTC the calm started again as for the Amplitude, the Frequency instead has not changed significantly, the oscillations are around 7.70 Hz, slightly higher. Finally the Quality which slightly decreased the values of the maximum peaks. |
| 7/25 10:00 | The most intense activity reported in the new charts belongs to 24 July UTC and took place from 15 to 1 am today. The other movements started at 3 UTC and are in progress, the maximum Amplitude value reached was Power 17 at 6 UTC. The Quality in the last 16 hours started a ciclyng wide variations. |
| 7/24 19:00 | The Frequency remains below 7.50 Hz and at the same time the Amplitude reaches another maximum value at 17:45 pm with Power 48. |
| 7/24 18:00 | From just before 17 UTC the Frequency started to decrease remaining on values around 7,35 Hz, this has continued the movements of both Amplitude and Quality. Amplitude reached Power 31 at 17 UTC while movements continue at the time of this update. |
| 7/24 17:15 | Throughout the day shown in the graph it was flat calm, the only movement occurred around 15:30 UTC when the Frequency had a sharp drop to 7.40 Hz, this led to a movements of the Quality and the Amplitude that reached Power 14 at 16:30 UTC. A very large Frequency variation at 16:30 produced a newer peak and the Amplitude is crossing Power 22 at the time of this update. |
| 7/24 11:00 | Total calm. |
| 7/23 17:00 | Today’s activity is summed up in an isolated peak at Power 20 at 1 UTC and a series of variations from 7 to 10 UTC with a maximum value of Power 15. |
| 7/23 10:30 | The Frequency continued to decrease until it reached 7.50 Hz around 9 UTC when the Amplitude also started to move, passing Power 10 shortly after. |
| 7/23 08:30 | Analyzing the Frequency graph, it can be seen how a gradual rise towards the base value began yesterday at 11 UTC, this increase however did not stay long at 7.83 Hz, it continued to rise up to exceed 8 Hz. Note that at 8 UTC there is a dent, which has started the further increase, and this corresponds to the variation of the Amplitude which has reached the maximum value until now, Power 20. Around 6:30, after staying for about 4 hours above 8 Hz, there has been a sharp drop that will probably generate some more light movement in the Amplitude. |
| 7/22 23:00 | The Frequency finally returned to the base value of 7.83 Hz with a slow ascent that began at 11 UTC. The situation seems calm, only slight Amplitude fluctuations from 21 UTC. |
| 7/22 17:30 | The activity started to decrease significantly from 11 UTC after the last move to Power 29, at the same the the frequency stabilized on 7.66 Hz, six hours with very little variations. |
| 7/22 11:00 | There was no calm, the activity that started yesterday at 21 UTC is continuing in a series of waves of increasing amplitude. After a start, yesterday, with approximately 6 continuous hours of Power 20, there was a pause of about 2 hours. At 5 UTC there were two movements at Power 35, corresponding to a sharp drop in frequency below 7.50 Hz. Another one hour break and another peak, this time at Power 55 occurred shortly after 9 UTC. At the time of this update, the frequency fluctuations remain large, going cyclically below 7.50 Hz. |
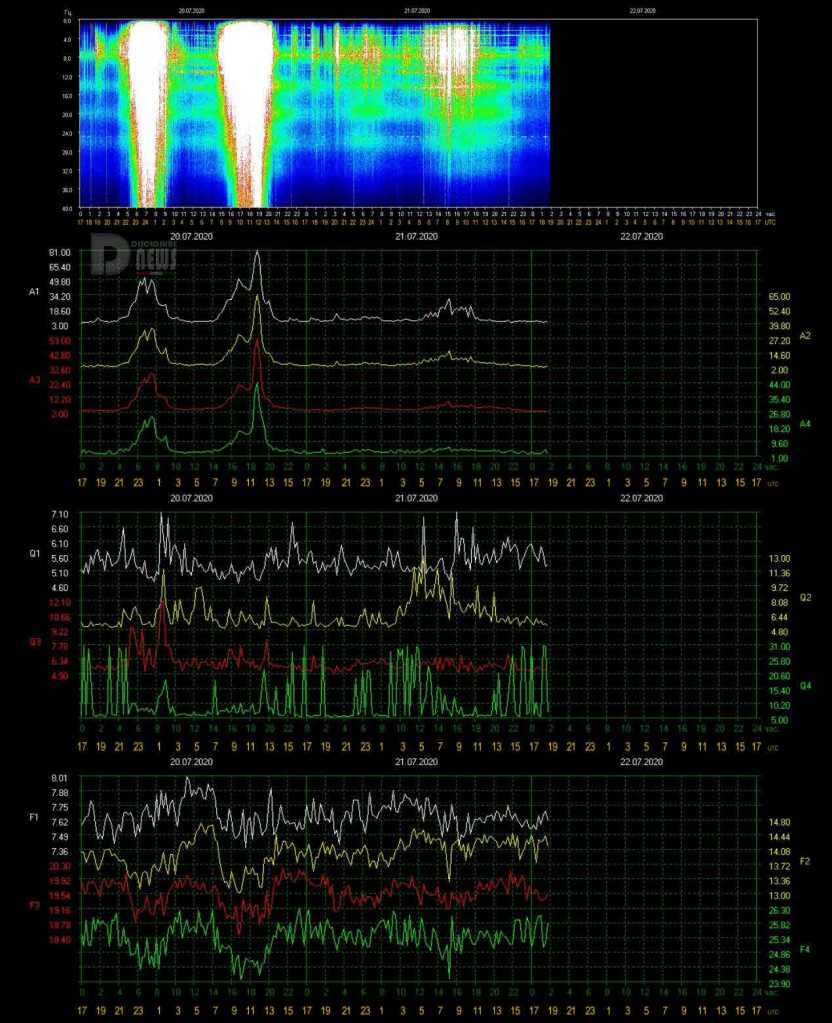
| 7/21 22:00 | The situation is still unstable with the Frequency remaining around 7.60 Hz, this seems to cause ripples in the Amplitude that reached Power 18 at 21.30 UTC. |
| 7/21 17:00 | Today’s activity was concentrated in 6 hours, from 5 to 11 UTC, from 7 to 10 was the most intense part with the peak at Power 30 and the long resilience at Power 20. From 11 the situation is calm although, as yesterday, the Frequency is oscillating around 7.60 Hz. |
| 7/21 11:00 | The Frequency is keeping the lower side of the spectrum and the Amplitude produced a new maximum, Power 30 at 8:15 UTC and subsequently staying at Power 20 for more than an hour until 10 UTC. |
| 7/21 09:30 | With the continued Frequency oscillations a new maximum Amplitude value arrived, Power 30 at 8:20 UTC. |
| 7/21 08:00 | In the new graphs we can see how the Frequency, after remaining for almost 17 hours oscillating on the 7.60 Hz thereshold, from 1 UTC raised slightly stabilizing on 7.75 Hz. This maintained a situation of instability that was accentuated at 5 UTC with amplitude oscillations that began to exceed Power 10. Shortly before 7 UTC the frequency had a rapid dip below 7.50 Hz and this seems to have increased the amplitude oscillations leading it to reach Power 22 at 7:45 UTC. |
| 7/20 23:30 | The situation of instability continues, the Frequency has remained on average at 7.60 Hz since shortly after 6 UTC, therefore 16 hours. |
| 7/20 17:00 | The frequency continues to remain around 7.60 Hz so it is not a completely calm situation with amplitude and quality having small oscillations. |
| 7/20 15:30 | After several days of calm, today the activity has returned in a powerful way, the first period lasted about 6 hours, from 21 to 3 am UTC, touching Power 50 three times; the second period started after 4 hours of calm, at 7 UTC, and lasted just over 6 hours, after a steep initial climb to Power 52 and an hour of strong intensity at 50, the amplitude started to increase again until topping to Power 81. The drop after the peak was sudden and at 14 UTC the amplitude was back to normal values. In all this, the frequency, excluded the calm part from 3 to 7, has had wide variations around 7.60 Hz. |
| 7/20 12:30 | From 11 UTC there was a further rapid increase that brought the Amplitude to Power 81 shortly before 12 UTC. The frequency remains oscillating around 7.60 Hz. |
| 7/20 11:45 | The Freuency remains very low and more Amplitude movements reached again Power 52 at 11:20 UTC. |
| 7/20 11:30 | Another powerful period of activity started at 7 UTC, just under four hours after the previous one and, like that one, reached Power 51 quite quickly just before 10 UTC. During this second movement there was a further drop in frequency which reached 7.35 Hz as a minimum value around 10 UTC. |
| 7/20 8:30 | Today’s first movement lasted about 6 hours straddling midnight UTC, from 21 to 2 am. From 23 to 2 it was a succession of very strong peaks, Power 48, Power 52 and Power 50. One last move at Power 23 occurred at 2 UTC during the rapid drop in Amplitude towards normal values. The frequency during this phase remained at 7.50 Hz and then returned to the base value from 4 UTC. From 7 the frequency started again a rapid drop towards 7.50 Hz, once again setting the Amplitude in motion that at the time of this update is passing Power 20. |
| 7/20 00:00 | The strong movement started at 21 UTC was not anticipated by any particular signal, the Frequency was in a cycle of wide oscillations from 17 UTC. The amplitude started to increase suddenly at 22 UTC and reached the maximum value of Power 52 at 23:40. |
Frequency means how many wave cycle happen in a second, 1 Hz. means 1 cycle per second, 40 Hz. means 40 cycles per second, Amplitude is the size of the vibration, how big is the wave, the chart shows the frequency variation in Hz and the amplitude using the white color.
Note
The Ancient Indian Rishis called 7.83 Hz the frequency of OM. It also happens to be Mother Earth’s natural heartbeat rhythm. Schumann resonances are named after professor Schumann who was involved in early German secret space program and was later paper-clipped into the United States. The frequencies of Schumann resonances are fairly stable and are mainly defined by the physical size of the ionospheric cavity. The amplitude of Schumann resonances does change and is bigger when ionospheric plasma gets excited. Ionospheric plasma excitation happens because of solar activity, thunderstorms, use of scalar plasma weapons and HAARP and lately also when the Light forces are clearing the plasma anomaly.
Schumann Resonance Today – Energy of Consciousness Currents
Show entriesSearch:
| Time UTC +7 | Amplitude | Quality | A+Q | Freq. | Base Freq. | Delta | ECC Increase | TOTAL ECC |
|---|---|---|---|---|---|---|---|---|
| 04/05/2020 18.00.00 | 91 | 5 | 96 | 7,91 | 7,83 | 0,08 | 8 | 104 |
| 03/05/2020 07:00:00 | 81 | 7 | 88 | 7,28 | 7,83 | 0,55 | 48 | 136 |
| 01/05/2020 07:00:00 | 58 | 8,08 | 66,08 | 7,53 | 7,83 | 0,3 | 20 | 86 |
| 30/04/2020 21:15:00 | 90 | 7,46 | 97,46 | 7,36 | 7,83 | 0,47 | 46 | 143 |
| 29/04/2020 17:00:00 | 76 | 6,91 | 82,91 | 7,31 | 7,83 | 0,52 | 43 | 126 |
| 23/04/2020 10:00:00 | 138 | 4,74 | 142,74 | 7,42 | 7,83 | 0,41 | 59 | 201 |
| 19/04/2020 14:45:00 | 88 | 6,49 | 94,49 | 7,25 | 7,83 | 0,58 | 55 | 149 |
| 18/04/2020 16:15:00 | 110 | 7,21 | 117,21 | 7,26 | 7,83 | 0,57 | 67 | 184 |
| 18/04/2020 14:00:00 | 90 | 7,22 | 97,22 | 7,34 | 7,83 | 0,49 | 48 | 145 |
| 18/04/2020 12:00:00 | 81 | 10,9 | 91,9 | 7,24 | 7,83 | 0,59 | 54 | 146 |
Showing 1 to 10 of 67 entriesPreviousNext
Schumann Resonance Today – Energy of Consciousness Currents Posts

Aligning With The Lion’s Gate Portal

The Super-Charged Lion’s Gate Of 2020

Neowise Streaking Thru The Sacred Skies
Schumann Resonance PDF Archives
Images Archive
All the SR daily images in one single page See the Images

Explanation of The Chart
The Schumann Resonance Spectrogram Chart
The Schumann Resonance Chart displays data from the magnetic field detector to monitor the resonances occurring in the plasma waves constantly circling the earth in the ionosphere. These three days spectrograms show the activity occurring at the various resonant frequencies from 1 to 40 Hz. Within the spectrogram, the power, or intensity level of each frequency is displayed as a color, with white being the most intense. The Schumann Resonances appear as the horizontal lines at 0.0, 4.0, 8.0, 12.0, 16.0, 20.0, 24.0, 28.0, 32.0, 36.0 & 40.0 Hz. This chart is based on Tomsk, Russia, time UTC +7 (UTC = Universal Time Coordinated).
What is a Spectrogram?
The Spectrogram Calendar is a visual representation of the range of frequencies in the magnetic field at a given location. Similar to how an equalizer displays the frequency content of music played on your stereo, the spectrogram calendar displays the frequency content of a magnetic field. Instead of showing a brief snapshot, it shows changes over a period of time, in this case 3 days.
The local magnetic field is a dynamic field that changes constantly because of variations in the ionosphere and sun and many other influences not yet fully understood. The range of variation displayed in the spectrogram chart is from 0 to 40 cycles per second. The vertical axis is frequency and the horizontal axis is time. The amplitude of a particular frequency at a specific time is represented by the intensity of color (green, yellow, white) of each point in the image.

What is the Schumann Resonance?
The Herathbeat of Planet Earth Read
Clicks on the Ads Keep Us Alive 🙂

Enemies
Always forgive your enemies. Nothing annoys them so much.
Schumann Resonance Today. We will try to keep you updated about the variations of the Resonance with this page. The great variations that nobody can explain but that give us a clear sign that the planet is changing. The Earth is vibration higher and higher, just like us!
The Chart time is based on Tomsk – Russia – UTC (Universal Time Coordinated) +7 – Source
SR Base Frequency 7.83 Hz. – Schumann Resonance Today’s Peaks
18
Amplitude
9.00
Quality
8.03
Frequency Max
7.55
Frequency Min
13
Ampltude A2
6
Ampltude A3
6
Ampltude A4
“Every second, a multitude of pulses travel around the world in this unique, resonant chamber between Earth and the ionosphere, sending colluding signals to all microorganisms. These signals couple us to the Earth’s magnetic field. Named after their discoverer, these Schumann Resonances (SR) drive the harmonizing pulse for life in our world.” Eric Thompson
1/73/75/77/79/711/713/715/717/719/721/723/725/7020406080100
| x | Amplitude | Average |
|---|---|---|
| 1/7 | 85 | 85 |
| 2/7 | 75 | 80 |
| 3/7 | 18 | 59 |
| 4/7 | 68 | 62 |
| 5/7 | 41 | 57 |
| 6/7 | 99 | 64 |
| 7/7 | 35 | 60 |
| 8/7 | 23 | 56 |
| 9/7 | 69 | 57 |
| 10/7 | 82 | 58 |
| 11/7 | 12 | 55 |
| 12/7 | 58 | 55 |
| 13/7 | 10 | 52 |
| 14/7 | 44 | 51 |
| 15/7 | 21 | 49 |
| 16/7 | 70 | 51 |
| 17/7 | 23 | 49 |
| 18/7 | 8 | 47 |
| 19/7 | 52 | 47 |
| 20/7 | 81 | 49 |
| 21/7 | 30 | 48 |
| 22/7 | 55 | 48 |
| 23/7 | 20 | 47 |
| 24/7 | 48 | 47 |
| 25/7 | 17 | 46 |
Amplitude Max Values and Average – Schumann Resonance Today
More ChartsTell Us What You Feel! How to Read the Graphs
| 7/26 17:00 | Even today as yesterday at 11 UTC the situation has calmed down totally, but only as regards the Amplitude and the Quality as the Frequency remains low, around 7.60 Hz, we will see if this will lead to movements. |
| 7/26 08:00 | The calm that began yesterday at 11 UTC was interrupted at 21 UTC by a slight movement that reached Power 15 at 22, these peak occurred simultaneously with a temporary lowering of the Frequency value to about 7.60 Hz. The situation has returned almost calm shortly after. From 5 UTC there has been a rapid drop in Frequency which has led to a peak in Quality and changes in Amplitude that reached Power 18 at 7 UTC. |
| 7/25 21:30 | Total calm, the Frequency is back to base value of 7.83 Hz and apparently going above. |
| 7/25 17:00 | From 11 UTC the calm started again as for the Amplitude, the Frequency instead has not changed significantly, the oscillations are around 7.70 Hz, slightly higher. Finally the Quality which slightly decreased the values of the maximum peaks. |
| 7/25 10:00 | The most intense activity reported in the new charts belongs to 24 July UTC and took place from 15 to 1 am today. The other movements started at 3 UTC and are in progress, the maximum Amplitude value reached was Power 17 at 6 UTC. The Quality in the last 16 hours started a ciclyng wide variations. |
| 7/24 19:00 | The Frequency remains below 7.50 Hz and at the same time the Amplitude reaches another maximum value at 17:45 pm with Power 48. |
| 7/24 18:00 | From just before 17 UTC the Frequency started to decrease remaining on values around 7,35 Hz, this has continued the movements of both Amplitude and Quality. Amplitude reached Power 31 at 17 UTC while movements continue at the time of this update. |
| 7/24 17:15 | Throughout the day shown in the graph it was flat calm, the only movement occurred around 15:30 UTC when the Frequency had a sharp drop to 7.40 Hz, this led to a movements of the Quality and the Amplitude that reached Power 14 at 16:30 UTC. A very large Frequency variation at 16:30 produced a newer peak and the Amplitude is crossing Power 22 at the time of this update. |
| 7/24 11:00 | Total calm. |
| 7/23 17:00 | Today’s activity is summed up in an isolated peak at Power 20 at 1 UTC and a series of variations from 7 to 10 UTC with a maximum value of Power 15. |
| 7/23 10:30 | The Frequency continued to decrease until it reached 7.50 Hz around 9 UTC when the Amplitude also started to move, passing Power 10 shortly after. |
| 7/23 08:30 | Analyzing the Frequency graph, it can be seen how a gradual rise towards the base value began yesterday at 11 UTC, this increase however did not stay long at 7.83 Hz, it continued to rise up to exceed 8 Hz. Note that at 8 UTC there is a dent, which has started the further increase, and this corresponds to the variation of the Amplitude which has reached the maximum value until now, Power 20. Around 6:30, after staying for about 4 hours above 8 Hz, there has been a sharp drop that will probably generate some more light movement in the Amplitude. |
| 7/22 23:00 | The Frequency finally returned to the base value of 7.83 Hz with a slow ascent that began at 11 UTC. The situation seems calm, only slight Amplitude fluctuations from 21 UTC. |
| 7/22 17:30 | The activity started to decrease significantly from 11 UTC after the last move to Power 29, at the same the the frequency stabilized on 7.66 Hz, six hours with very little variations. |
| 7/22 11:00 | There was no calm, the activity that started yesterday at 21 UTC is continuing in a series of waves of increasing amplitude. After a start, yesterday, with approximately 6 continuous hours of Power 20, there was a pause of about 2 hours. At 5 UTC there were two movements at Power 35, corresponding to a sharp drop in frequency below 7.50 Hz. Another one hour break and another peak, this time at Power 55 occurred shortly after 9 UTC. At the time of this update, the frequency fluctuations remain large, going cyclically below 7.50 Hz. |
| 7/21 22:00 | The situation is still unstable with the Frequency remaining around 7.60 Hz, this seems to cause ripples in the Amplitude that reached Power 18 at 21.30 UTC. |
| 7/21 17:00 | Today’s activity was concentrated in 6 hours, from 5 to 11 UTC, from 7 to 10 was the most intense part with the peak at Power 30 and the long resilience at Power 20. From 11 the situation is calm although, as yesterday, the Frequency is oscillating around 7.60 Hz. |
| 7/21 11:00 | The Frequency is keeping the lower side of the spectrum and the Amplitude produced a new maximum, Power 30 at 8:15 UTC and subsequently staying at Power 20 for more than an hour until 10 UTC. |
| 7/21 09:30 | With the continued Frequency oscillations a new maximum Amplitude value arrived, Power 30 at 8:20 UTC. |
| 7/21 08:00 | In the new graphs we can see how the Frequency, after remaining for almost 17 hours oscillating on the 7.60 Hz thereshold, from 1 UTC raised slightly stabilizing on 7.75 Hz. This maintained a situation of instability that was accentuated at 5 UTC with amplitude oscillations that began to exceed Power 10. Shortly before 7 UTC the frequency had a rapid dip below 7.50 Hz and this seems to have increased the amplitude oscillations leading it to reach Power 22 at 7:45 UTC. |
| 7/20 23:30 | The situation of instability continues, the Frequency has remained on average at 7.60 Hz since shortly after 6 UTC, therefore 16 hours. |
| 7/20 17:00 | The frequency continues to remain around 7.60 Hz so it is not a completely calm situation with amplitude and quality having small oscillations. |
| 7/20 15:30 | After several days of calm, today the activity has returned in a powerful way, the first period lasted about 6 hours, from 21 to 3 am UTC, touching Power 50 three times; the second period started after 4 hours of calm, at 7 UTC, and lasted just over 6 hours, after a steep initial climb to Power 52 and an hour of strong intensity at 50, the amplitude started to increase again until topping to Power 81. The drop after the peak was sudden and at 14 UTC the amplitude was back to normal values. In all this, the frequency, excluded the calm part from 3 to 7, has had wide variations around 7.60 Hz. |
| 7/20 12:30 | From 11 UTC there was a further rapid increase that brought the Amplitude to Power 81 shortly before 12 UTC. The frequency remains oscillating around 7.60 Hz. |
| 7/20 11:45 | The Freuency remains very low and more Amplitude movements reached again Power 52 at 11:20 UTC. |
| 7/20 11:30 | Another powerful period of activity started at 7 UTC, just under four hours after the previous one and, like that one, reached Power 51 quite quickly just before 10 UTC. During this second movement there was a further drop in frequency which reached 7.35 Hz as a minimum value around 10 UTC. |
| 7/20 8:30 | Today’s first movement lasted about 6 hours straddling midnight UTC, from 21 to 2 am. From 23 to 2 it was a succession of very strong peaks, Power 48, Power 52 and Power 50. One last move at Power 23 occurred at 2 UTC during the rapid drop in Amplitude towards normal values. The frequency during this phase remained at 7.50 Hz and then returned to the base value from 4 UTC. From 7 the frequency started again a rapid drop towards 7.50 Hz, once again setting the Amplitude in motion that at the time of this update is passing Power 20. |
| 7/20 00:00 | The strong movement started at 21 UTC was not anticipated by any particular signal, the Frequency was in a cycle of wide oscillations from 17 UTC. The amplitude started to increase suddenly at 22 UTC and reached the maximum value of Power 52 at 23:40. |
Frequency means how many wave cycle happen in a second, 1 Hz. means 1 cycle per second, 40 Hz. means 40 cycles per second, Amplitude is the size of the vibration, how big is the wave, the chart shows the frequency variation in Hz and the amplitude using the white color.
Note
The Ancient Indian Rishis called 7.83 Hz the frequency of OM. It also happens to be Mother Earth’s natural heartbeat rhythm. Schumann resonances are named after professor Schumann who was involved in early German secret space program and was later paper-clipped into the United States. The frequencies of Schumann resonances are fairly stable and are mainly defined by the physical size of the ionospheric cavity. The amplitude of Schumann resonances does change and is bigger when ionospheric plasma gets excited. Ionospheric plasma excitation happens because of solar activity, thunderstorms, use of scalar plasma weapons and HAARP and lately also when the Light forces are clearing the plasma anomaly.
Schumann Resonance Today – Energy of Consciousness Currents
Show entriesSearch:
| Time UTC +7 | Amplitude | Quality | A+Q | Freq. | Base Freq. | Delta | ECC Increase | TOTAL ECC |
|---|---|---|---|---|---|---|---|---|
| 04/05/2020 18.00.00 | 91 | 5 | 96 | 7,91 | 7,83 | 0,08 | 8 | 104 |
| 03/05/2020 07:00:00 | 81 | 7 | 88 | 7,28 | 7,83 | 0,55 | 48 | 136 |
| 01/05/2020 07:00:00 | 58 | 8,08 | 66,08 | 7,53 | 7,83 | 0,3 | 20 | 86 |
| 30/04/2020 21:15:00 | 90 | 7,46 | 97,46 | 7,36 | 7,83 | 0,47 | 46 | 143 |
| 29/04/2020 17:00:00 | 76 | 6,91 | 82,91 | 7,31 | 7,83 | 0,52 | 43 | 126 |
| 23/04/2020 10:00:00 | 138 | 4,74 | 142,74 | 7,42 | 7,83 | 0,41 | 59 | 201 |
| 19/04/2020 14:45:00 | 88 | 6,49 | 94,49 | 7,25 | 7,83 | 0,58 | 55 | 149 |
| 18/04/2020 16:15:00 | 110 | 7,21 | 117,21 | 7,26 | 7,83 | 0,57 | 67 | 184 |
| 18/04/2020 14:00:00 | 90 | 7,22 | 97,22 | 7,34 | 7,83 | 0,49 | 48 | 145 |
| 18/04/2020 12:00:00 | 81 | 10,9 | 91,9 | 7,24 | 7,83 | 0,59 | 54 | 146 |
Showing 1 to 10 of 67 entriesPreviousNext
Schumann Resonance Today – Energy of Consciousness Currents Posts
Aligning With The Lion’s Gate Portal
The Super-Charged Lion’s Gate Of 2020
Neowise Streaking Thru The Sacred Skies
Schumann Resonance PDF Archives
Images Archive
All the SR daily images in one single page See the Images
Explanation of The Chart
The Schumann Resonance Spectrogram Chart
The Schumann Resonance Chart displays data from the magnetic field detector to monitor the resonances occurring in the plasma waves constantly circling the earth in the ionosphere. These three days spectrograms show the activity occurring at the various resonant frequencies from 1 to 40 Hz. Within the spectrogram, the power, or intensity level of each frequency is displayed as a color, with white being the most intense. The Schumann Resonances appear as the horizontal lines at 0.0, 4.0, 8.0, 12.0, 16.0, 20.0, 24.0, 28.0, 32.0, 36.0 & 40.0 Hz. This chart is based on Tomsk, Russia, time UTC +7 (UTC = Universal Time Coordinated).
What is a Spectrogram?
The Spectrogram Calendar is a visual representation of the range of frequencies in the magnetic field at a given location. Similar to how an equalizer displays the frequency content of music played on your stereo, the spectrogram calendar displays the frequency content of a magnetic field. Instead of showing a brief snapshot, it shows changes over a period of time, in this case 3 days.
The local magnetic field is a dynamic field that changes constantly because of variations in the ionosphere and sun and many other influences not yet fully understood. The range of variation displayed in the spectrogram chart is from 0 to 40 cycles per second. The vertical axis is frequency and the horizontal axis is time. The amplitude of a particular frequency at a specific time is represented by the intensity of color (green, yellow, white) of each point in the image.
What is the Schumann Resonance?
The Herathbeat of Planet Earth Read
Clicks on the Ads Keep Us Alive 🙂
Enemies
Always forgive your enemies. Nothing annoys them so much.
Oscar Wilde