Editor’s Note: From the graph above, we see a huge burst of extremely dense energy of ever increasing/decreasing cycle for amplitudes from 2am through 8:30am on 5/17 before the graph ends at noon. The energies have been very loud in my ears today from 10am through 2pm, so we shall see if this correlates with the graph of today’s energies which will be posted tomorrow.
Thanks for keeping aware of the Schumann Resonance energies, how are you feeling (?) as cosmic energies arrive, and in all ways BE in…
Quantum Joy!
___________________________________________________________________________________________
Schumann Resonance Today. We will try to keep you updated about the variations of the Resonance with this page. The great variations that nobody can explain but that give us a clear sign that the planet is changing. The Earth is vibration higher and higher, just like us!
The Chart time is based on Tomsk – Russia – UTC (Universal Time Coordinated) +7 – Source
SR Base Frequency 7.83 Hz. – Schumann Resonance Today’s Peaks
69
Amplitude
7.00
Quality
8.03
Frequency Max
7.40
Frequency Min
36
Ampltude A2
22
Ampltude A3
16
Ampltude A4
“Every second, a multitude of pulses travel around the world in this unique, resonant chamber between Earth and the ionosphere, sending colluding signals to all microorganisms. These signals couple us to the Earth’s magnetic field. Named after their discoverer, these Schumann Resonances (SR) drive the harmonizing pulse for life in our world.” Eric Thompson

Tell Us What You Feel! How to Read the Graphs


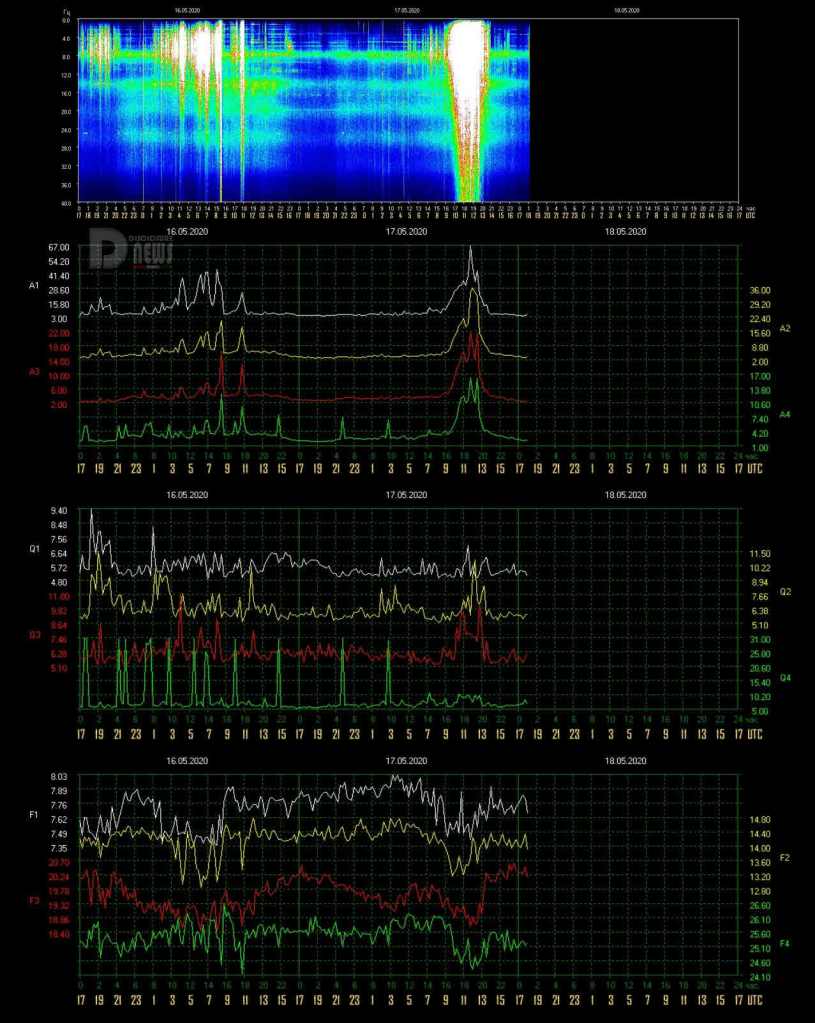
- 5/17 17:00 – Today’s activity, with a nice and flowing teardrop shape, lasted 5 hours, from 9 to 14 UTC; in the central and more intense part, from 10:30 to 12:30, the Amplitude remained constantly above Power 30 with the Frequency below 7.55 Hz. From 14 UTC with a rapid drop in Amplitude and a gradual increase in Frequency, but not towards the base value of 7.83 Hz but around 7.70 Hz, the activity has decreased considerably.
- 5/17 12:30 – After a period of calm that lasted about 18 hours at 7 UTC today, a marked decrease in the frequency began and gave the go to slight fluctuations in both Amplitude and Quality. These variations have taken on a much more marked characteristic from 9 UTC when the Frequency has approached the value of 7.40 Hz, since then it has been oscillations no more, the Amplitude has started a rapid increase exceeding Power 30 slightly after 10 UTC, Power 40 at 11:30 and Power 60 shortly before 12 when the Frequency has reached the minimum value of 7.40 Hz so far. This coincided with the peak of Power 69 reached at 11:40 UTC. If you have a cat you can observe his behavior in these moments.
- 5/16 17:00 – Another lively situation, after the peaks previously reported there was a further movement at 8 UTC that reached Power 46, after this the Frequency increased rapidly towards normal values and this marked the end of intense movements, there were only fluctuations left, mainly of Quality and Frequency around normal values.
- 5/16 07:30 – Even today we can say that the activity was almost continuous, the period with the least movements was from 21 to 23 UTC yesterday and from midnight the Frequency began to decrease and fluctuations in Amplitude began again. The Frequency stabilized between 7.30 and 7.40 Hz from 4 UTC and at the same time the Amplitude had its first surge at Power 39. A further drop in the Frequency to 7.38 Hz at 5:30 UTC gave the start at the second peak of Amplitude at Power 42 shortly after 6 with a further increase at Power 45 occurred at 7. At the time of this update the Frequency still remains low so it is likely that we will see other activity.
- 5/15 17:00 – Finally, the frequency returned to rise toward normal values and the activity seems to have ended, from 1 UTC until 16 there were 15 hours of ups and downs with the most intense part from 13 to 15:30 UTC, even if this period was not the one where the highest peak was recorded.
- 5/15 14:30 – Today seems to be a day of strong activity, after the peak at Power 78 there is only a slight drop in Amplitude but the profound fluctuations in Quality and Frequency continued which continued to decrease to today’s minimum of 7, 30 Hz; all this hinted that we would see other major changes in Amplitude soon. And so it was with Power 65 at 13:50 UTC. The Frequency is still at the minimum so we could see more movements.
- 5/15 11:30 – Yet another increase, Power 78 was achieved just before 11 UTC while the wide fluctuations in Frequency and Quality continue.
- 5/15 10:30 – With the Frequency remaining between 7.40 and 7.50 Hz, activity is continuing with wide fluctuations in Quality and Amplitude movements, a new peak at Power 42 occurred at 9:30 UTC and the movements continue. The Black Star is influencing Terra/Gaia.
- 5/15 09:00 – Even today the calm did not last long, the new charts show a peak at Power 35 at 17:30 UTC yesterday which was followed by a break of about 7 hours until 1 UTC today when a rapid drop in Frequency and a Amplitude leap that reached Power 72 at 2:30 UTC. Since then, the variations have continued even if of a lesser extent mainly linked to the wide fluctuations in Frequency and Quality. At the time of this update, the frequency is below 7.40 Hz.
- 5/14 17:00 – There was very little calm after the strong peak at Power 65 at 9 UTC this morning, the Frequency remained low for most of the time with a slight rise around 13 UTC but to immediately return to drop below 7.40 Hz, where it is swinging even at the time of this update. From 14:30 UTC started also slight movements of the Amplitude which reached Power 20 at 15:30.
- 5/14 10:00 – The increase that we expected happened, both in Amplitude, which reached Power 65 at 9:20 UTC, and in Quality which saw a further increase. The Frequency continues to remain very low, at 7.25 Hz and it is therefore likely that we will see further activity.
- 5/14 08:00 – The new graphs show an “unstable” situation, the Amplitude has remained at minimum values for most of the time after yesterday’s peak but the Quality has continued to fluctuate. The Frequency throughout this period has remained below the base value of 7.83 Hz and has started to decrease from 3 UTC, at the same time we also see the increase in the value of Quality and some slight movements in the Amplitude graph. From 6:30 UTC the activity took off with a first peak of Amplitude which reached Power 42 together with a maximum of Quality and the Frequency that fell below 7.30 Hz. Now we are at Power 45 and apparently rising.
- 5/13 17:00 – The four hours of activity of the UTC morning was the only movement of today’s graphs, Power 80 was however a very strong value and although short-lived, for about 20 minutes the Amplitude remained above Power 50. Note that the frequency, after these movements, did not return around the base value but has stabilized between 7.50 and 7.70 Hz while the quality has continued to oscillate, hence the coloring of the last part of the main graph.
- 5/13 11:00 – The maximum peak of this phase was at Power 80 reached at 10 UTC during a phase in which the Frequency started to rise again. This first phase of activity lasted 4 hours, from 7 to 11 UTC.
- 5/13 09:30 – The activity is continuing and the new amplitude maximum just reached has exceeded 40 reaching Power 43, the frequency continues to remain very low. On a statistical level we would like to show the graph that we used yesterday which today shows quite significant data, this to highlight that even if the data we normally use are collected in Russia the variations are on a planetary level.
- 5/13 09:00 – We finally found out that the problem was probably on the source website that was not updating the images, now the situation has returned to normal. The graphs show for May 12 a period of activity of about 8 hours, from 5 to 13 UTC, within which the remarkable peak of Power 52 was reached at 9, this corresponded to a peak in Quality and a minimum in Frequency. From 13 UTC an almost calm condition returned and lasted until today at 6 UTC when a series of rapid variations brought the Amplitude repeatedly above Power 30 with the maximum at Power 39 at 8:30 UTC. Also, for this activity there is a marked increase in Quality and a sudden drop in Frequency which has reached the minimum of the last few days at 7.27 Hz.
- 5/12 17:00 – It is difficult to make updates based on the data shown by these graphs, what can be said is that there are no relevant movements, we could say that the situation is calm. There are isolated peaks but these, due to the position of the detectors, are due to external factors and not proper to the Schumann Resonance. To return to normal data reports we will have to wait for the usual graphs to be updated. However, we will update the current chart which has temporarily replaced the usual one even if the cadence is much wider.
- 5/12 08:30 – The situation has not changed, the data is still missing and the graph is not updated, which is unusual, generally even if the data is not recorded the graph is updated, at least on the date. This time it’s not and it suggests that there are more serious problems … What we see above is, instead, an alternative data source located in Italy. The graph shows the electric field from 1 to 100 Hz, we prefer not to go into excessive explanations as higher technical knowledge is needed and we would create more questions than anything else, what is clear is that it does not seem we’re having much activity in progress in the last hours. The upper part of the image is today, the lower part is from the last days.
- 5/11 20:30 – Images are not being updated, we’re still stuck at the same from this morning UTC. One of the recent longest blackout was in October 2019 when it lasted more than 2 days, in 2020 there have been few, lasting generally less than a day.
- 5/11 17:00 – Blackout continues.
- 5/11 14:30 – Still in dark mode…
- 5/11 12:30 – The new graphs still show a calm condition even if in the last hours of the data received there have been some ripples in the Amplitude that has repeatedly reached Power 10, from 23 to 3 UTC. And at that the data transmission stopped, so it’s about 10 hours of blackout. It is also noted that from around midnight UTC the Frequency has constantly risen to high values. We will see when the data transmission will resume what the situation will be.
- 5/10 17:00 – The calm lasted for the whole extension of today’s graph, the only movement, excluding the previous one to Power 8 actually not very relevant, was at 14 UTC with Power 17. Nothing else to report for Quality and Frequency that remained on normal values.
- 5/10 08:00 – These are the images of a situation of calm, Amplitude and Quality at minimum and Frequency on the base value, we are approaching the 12 consecutive hours of flat calm.
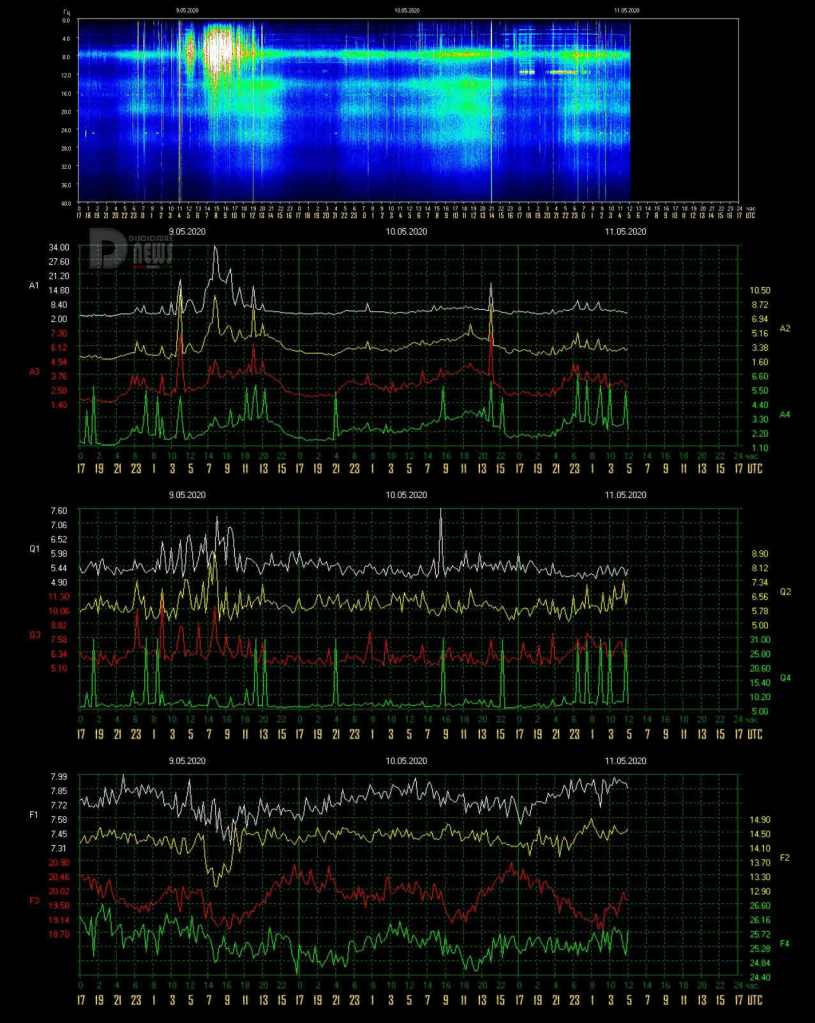
- 5/09 17: 00 – Today’s moderate activity lasted about 10 hours, from 3 to 13 UTC. After the peak at Power 34 at 8 UTC another followed at 9:30 and reached Power 25 after which a slow descent began with movements around 15, normal values were reached at 13 UTC. The only parameter that has not yet returned to the base value is the Frequency which continues to tend to remain around 7.60 Hz.
- 5/09 08:30 – After almost two days of total calm, the activity returned to show itself at 4 UTC today with a first isolated peak that reached Power 19. This first movement was anticipated by a series of fluctuations in Quality and a gradual drop in Frequency started around 1 UTC. As these two parameters deviated from the normal values, the Amplitude also reacted and from 6 UTC it began a rapid increase that reached the maximum of Power 34 at 8 UTC.
- 5/08 17:00 – Total calm, all the values are back to normal.
- 5/08 14:00 – The almost total calm is continuing, very slight variations in Quality have given the main graph a green color from 6 UTC. The Frequency has dropped slightly to around 7.60 Hz from 9 UTC while the Amplitude has remained at minimum values.
- 5/08 07:00 – After several days of strong activity, in the graph of the last 3 days we can see a genera calm, apart from the 2 hours of strong activity yesterday. Today we see Power 10 at 1 UTC in a minimal movement with all the parameters on normal values.
- 5/07 17:00 – The peaks previously reported were followed by a period of 4 hours of calm until 8 UTC when the Frequency gradually began to decrease, this movement lasted until 14 UTC and was accompanied by a slight increase in both Quality and Amplitude, the latter reached the maximum value of Power 15 at 11. Now we are back to calm.
- 5/07 07:00 – Today the calm did not last long, shortly after midnight UTC a strong variation brought Amplitude to Power 50, for about 40 minutes it maintained this level reaching Power 53 just before 2 UTC when there was a new movement that generated the strongest peak so far of Power 66 at 2. Just reached this maximum there was a rapid descent that at 3 brought the Amplitude back to normal values. The Quality has always remained on normal values while the Frequency has followed the events starting the decrease at the same time as the Amplitude reaching the minimum of 7.38 at 2 UTC and then starting the ascent. At the time of this update, the Frequency has dropped back to around 7.50 Hz and there are very slight movements in the other parameters are noted.
- 5/06 17:00 – The calm that began yesterday at 13 UTC lasted until 14 UTC today when a momentary isolated peak reached Power 30, little movement even for the other parameters, Quality and Frequency. The duration of this movement was approximately 1 hour after which it has been calm.
- 5/05 17:00 – After the previously reported peak there was a sudden rise of the Frequency which in 2 hours, from 11 to 13 UTC, returned to normal values, in parallel both the Amplitude and the Quality also fell towards calm. From 14 we are in a calm condition.
- 5/05 13:00 – Today the activity began calmly, from 7 UTC there is a gradual drop in frequency which reached the minimum value of 7.28 hz at 11, at the same time when there was a peak in Quality at 8.70. The increase in the amplitude of the cycles has increased in parallel with the decrease in the Frequency and has also reached the maximum value so far of Power 45 at 11 UTC. This was followed by a slight drop but since the Frequency remains low it is likely that we will see other movements.
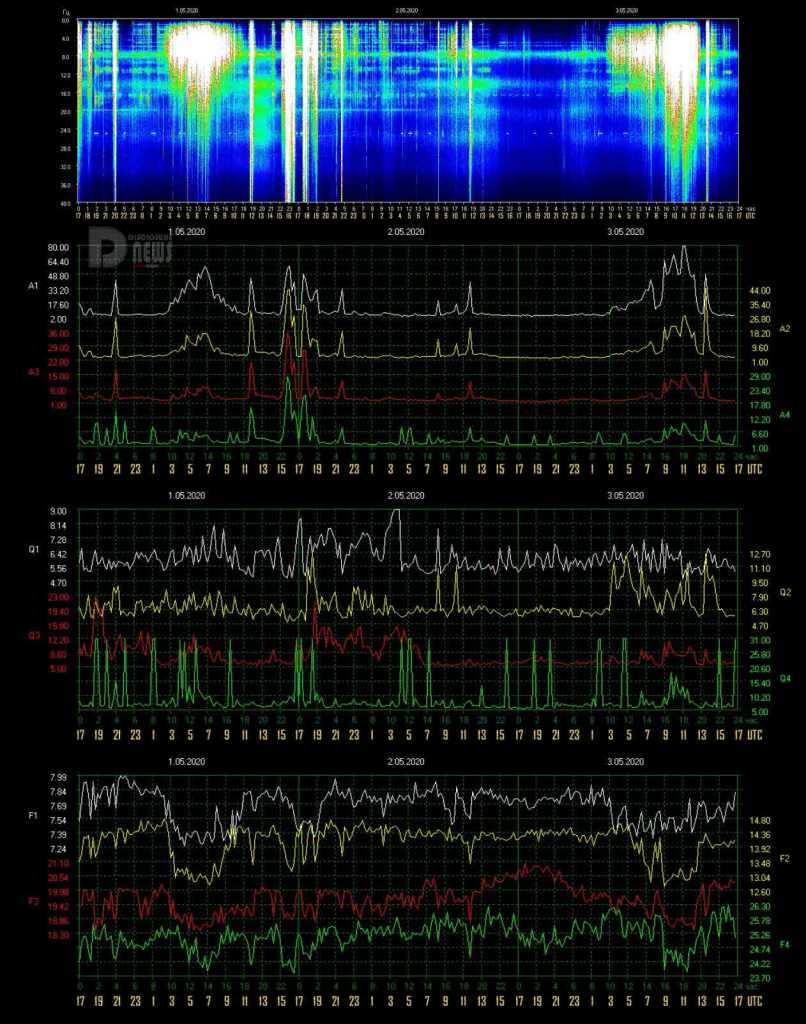
- 5/04 21:30 – We are now in a gradual descent, it is interesting to summarize the peaks reached during this phase (UTC times):
- 11 – Power 91
- 12 – Power 70
- 14 – Power 61
- 15 – Power 61
- 17 – Power 50
- 18 – Power 37
- 21 – Power 20
- 5/04 17:00 – From the beginning of today’s movements at 7 UTC, 10 hours ago, there has been no interruption, there have been two particularly intense periods, from 10 to 12 UTC when we have been constantly above Power 60, and from 14 to 16 UTC when the Amplitude has always remained above Power 50. Apart from a short period of time of about 30-40 minutes around 13 UTC, from 8 to 16, then 8 hours, we have been constantly above Power 37, quite impressive, do we understand the message from Terra/Gaia?
- 5/04 14:30 – The activity of the best days distinguishes today, after the very strong peak at Power 91, there has been a short break of about 45 minutes at Power 32 before the new increase in progress that is reaching Power 70 at the time of this update. While the Quality remains at minimum levels (and therefore the ECC is not at stratospheric values), the Frequency remains below the base value.
- 5/04 12:00 – The series of peaks in constant increase continues, after the 77 previously reported others followed in rapid succession exceeding 80 until reaching Power 91 shortly after 11 UTC. The graphs show strong fluctuations in Quality and Frequency as well.
- 5/04 10:30 – The script is repeating itself, 15 hours of total calm, from 15 UTC yesterday until 6 UTC today when abrupt changes in Quality and Frequency started which were followed by Amplitude movements that reached a first peak at 8 UTC up to Power 50. The Frequency continued to decrease to 7.32 Hz and this minimum further increased the maximum amplitude value bringing it to Power 77 at 10 UTC.
- 5/03 17:00 – Today’s activity lasted 11 hours, from 3 to 14 UTC when a last peak at Power 49 seems to have closed a strong sequence that has always been increasing. May seems to be a crucial month, we shall see if the Schumann Resonance will ‘resonate’ appropriately. The situation at the time of this update seems to have returned to calm even if the Frequency is not yet back at the base value, it is still quite low, so other slight movements may occur.
- 5/03 12:00 – Today so far it has been a continuous crescendo, after the last update we had a peak at Power 65 at 9 UTC, one at Power 72 at 10 and, like a clock, Power 80 at 11 UTC. At 11 o’clock there is a drop in Quality, part of the wide oscillations, and the Frequency which always remains at fairly low levels.
- 5/03 08:00 – Another increase, after the previous peak, a rapid and short drop before going back to Power 63 at 9 UTC. As before Quality in ever wider oscillations and low Frequency.
- 5/03 08:00 – As anticipated, the activity is continuing, it started at 3 UTC and with a slow and constant increase it reached the maximum value so far of Power 43 at 7:30 UTC. The oscillations of the Quality increased in intensity without however reaching high values while the frequency continued to decrease until it reached 7.32 Hz.
- 5/03 06:30 – Once again a period of calm, lasting about 15 hours, from 12 UTC yesterday to 3 this morning. All values measured during this period remained stable at basic levels. From 3 UTC there is a gradual increase in Amplitude which at the time of this update reached Power 20, this movement is accompanied by an equally increase in Quality and a less gradual decrease in Frequency which is going below 7.40 Hz. There is the feeling that the activity can continue to increase.
- 5/02 17:00 – Calm.
- 5/02 13:00 – We hope you like the constantly updated charts! Today’s situation, after the final part of the activity previously reported yesterday, shows a period of almost calm that started at 22 UTC yesterday and that lasted for about 10 hours until 8 UTC today. During this period, the Amplitude and the Frequency remained on normal values while the Quality had a variation between 3 and 4 UTC. The first isolated peak of Amplitude at 8 UTC reached Power 20, the second, still isolated, reached Power 18 at 8 UTC and the last, isolated as well, reached Power 41 at 11:40 UTC. While these peaks occurred, the Frequency, as it almost always happens, has had wide oscillations towards lower values, but not too low.
- 5/01 23:00 – Today we worked hard to make the way that the main chart is updated independently of these textual updates, the work is not yet finished but I think it was worth it already! As for the situation, we see that from 15 to 19 UTC the activity was powerful with 3 major peaks at Power 58, 47 and 30. A further isolated peak reached Power 34 at 21:30 UTC. There have also been wide fluctuations in Quality, indicating that the “message” has not always been the same while the Frequency has had a sharp drop between 17 and 19 UTC.
- 5/01 17:00 – Even today, little or no calm, after the movements described previously we had an isolated peak that reached Power 44 shortly before 12 UTC. In the following 3 hours there were fluctuations in Quality and Frequency but the Amplitude remained at normal values. From 15, however, a rapid drop in Frequency began and once again an increase in Amplitude which in one hour, at 16 UTC, reached today’s maximum at Power 58. Frequency is still very low at the time of this update so it is possible that the activity continues.
- 5/01 08:30 – There was the impression that the activity would have continued and it did. Resuming from the last update, where we highlighted the frequency that remained high, it remained so, with the Amplitude on normal values, until 2 UTC when a rapid drop began. At the same time, the Amplitude gradually started to rise to reach the maximum at Power 58 just before 7 UTC. This peak was followed by a new drop towards Power 20 and with an increase in frequency.
Frequency means how many wave cycle happen in a second, 1 Hz. means 1 cycle per second, 40 Hz. means 40 cycles per second, Amplitude is the size of the vibration, how big is the wave, the chart shows the frequency variation in Hz and the amplitude using the white color.
Note
The Ancient Indian Rishis called 7.83 Hz the frequency of OM. It also happens to be Mother Earth’s natural heartbeat rhythm Schumann resonances are named after professor Schumann who was involved in early German secret space program and was later paper-clipped into the United States. The frequencies of Schumann resonances are fairly stable and are mainly defined by the physical size of the ionospheric cavity. The amplitude of Schumann resonances does change and is bigger when ionospheric plasma gets excited. Ionospheric plasma excitation happens because of solar activity, thunderstorms, use of scalar plasma weapons and HAARP and lately also when the Light forces are clearing the plasma anomaly.
Schumann Resonance Today – Energy of Consciousness Currents
Show entriesSearch:
| Time UTC +7 | Amplitude | Quality | A+Q | Freq. | Base Freq. | Delta | ECC Increase | TOTAL ECC |
|---|---|---|---|---|---|---|---|---|
| 04/05/2020 18.00.00 | 91 | 5 | 96 | 7,91 | 7,83 | 0,08 | 8 | 104 |
| 03/05/2020 07:00:00 | 81 | 7 | 88 | 7,28 | 7,83 | 0,55 | 48 | 136 |
| 01/05/2020 07:00:00 | 58 | 8,08 | 66,08 | 7,53 | 7,83 | 0,3 | 20 | 86 |
| 30/04/2020 21:15:00 | 90 | 7,46 | 97,46 | 7,36 | 7,83 | 0,47 | 46 | 143 |
| 29/04/2020 17:00:00 | 76 | 6,91 | 82,91 | 7,31 | 7,83 | 0,52 | 43 | 126 |
| 23/04/2020 10:00:00 | 138 | 4,74 | 142,74 | 7,42 | 7,83 | 0,41 | 59 | 201 |
| 19/04/2020 14:45:00 | 88 | 6,49 | 94,49 | 7,25 | 7,83 | 0,58 | 55 | 149 |
| 18/04/2020 16:15:00 | 110 | 7,21 | 117,21 | 7,26 | 7,83 | 0,57 | 67 | 184 |
| 18/04/2020 14:00:00 | 90 | 7,22 | 97,22 | 7,34 | 7,83 | 0,49 | 48 | 145 |
| 18/04/2020 12:00:00 | 81 | 10,9 | 91,9 | 7,24 | 7,83 | 0,59 | 54 | 146 |
Showing 1 to 10 of 67 entriesPreviousNext
Schumann Resonance Today – Energy of Consciousness Currents Posts

Major Cosmic Blasts On-Going — The School Bell Rings!

Galactic Activation Portals – Effect On Earth/Gaia

Message From Mama Gaia!
Schumann Resonance PDF Archives
Images Archive
All the SR daily images in one single page See the Images


Explanation of The Chart
The Schumann Resonance Spectrogram Chart
The Schumann Resonance Chart displays data from the magnetic field detector to monitor the resonances occurring in the plasma waves constantly circling the earth in the ionosphere. These three days spectrograms show the activity occurring at the various resonant frequencies from 1 to 40 Hz. Within the spectrogram, the power, or intensity level of each frequency is displayed as a color, with white being the most intense. The Schumann Resonances appear as the horizontal lines at 0.0, 4.0, 8.0, 12.0, 16.0, 20.0, 24.0, 28.0, 32.0, 36.0 & 40.0 Hz. This chart is based on Tomsk, Russia, time UTC +7 (UTC = Universal Time Coordinated).
What is a Spectrogram?
The Spectrogram Calendar is a visual representation of the range of frequencies in the magnetic field at a given location. Similar to how an equalizer displays the frequency content of music played on your stereo, the spectrogram calendar displays the frequency content of a magnetic field. Instead of showing a brief snapshot, it shows changes over a period of time, in this case 3 days.
The local magnetic field is a dynamic field that changes constantly because of variations in the ionosphere and sun and many other influences not yet fully understood. The range of variation displayed in the spectrogram chart is from 0 to 40 cycles per second. The vertical axis is frequency and the horizontal axis is time. The amplitude of a particular frequency at a specific time is represented by the intensity of color (green, yellow, white) of each point in the image.

What is the Schumann Resonance?
The Herathbeat of Planet Earth Read
Clicks on the Ads Keep Us Alive 🙂

Dream
You can’t reach anything if you don’t dream about it. Everything in existence, was before conceived like a dream, everything achieved, was before thought. One thing is sure, if you can’t imagine… you can’t achieve.
Stephen Littleword


 (@DeAnna4Congress)