Twitter has deleted two tweets from Brazilian president Jair Bolsonaro on Sunday in which he challenged the need for social distancing and urged citizens to keep the country going. In one tweet, Bolsonaro posted a video in which he mixed with supporters on the streets of Brasilia – which Twitter says contradicted public health information from official sources and could put people at greater risk of transmitting the coronavirus. Twitter has also deleted a tweet by Trump attorney Rudy Giuliani in which he quoted conservative influencer Charlie Kirk – who claimed that hydroxychloroquine “in at least three international tests was found 100% effective in treating the coronavirus.” Brazil is reporting ‘exactly’ 400 new cases every day.
On the back of the recent seismic uptick observed across the Kamchatka region –including the Kuril Islands’ M7.5– comes the violent eruption of Shiveluch; Russia’s largest and most active volcano. The powerful explosion occurred on March 25, with the Kamchatkan Volcanic Eruption Response Team (KVERT) recording an ash plume reaching a maximum estimated altitude of 49,200 ft (15 km), and drifting in a NW direction.The volcano’s lava dome, at an elevation of 8,200 ft (2.5 km), remains “in a very active state”.
President Donald Trump slammed House Speaker Nancy Pelosi on ‘Fox and Friends,’ suggesting the federal government could take over her “slum” district San Francisco, as the two locked horns on the coronavirus pandemic response. “Look, she’s a sick puppy in my opinion,” the president said when asked about Pelosi criticizing his response to the coronavirus outbreak. “She really is. She’s got a lot of problems.” Trump continued his fuming against Pelosi later when he slammed her for “playing the impeachment game” and being controlled by “the radical left,” including freshman New York Congresswoman and Green New Deal author Alexandria Ocasio-Cortez.
Jerusalem’s Church of the Holy Sepulchre has closed its doors to the public for the first time since the Black Death ravaged the city in 1349. The custodians of one of the holiest buildings in Christianity were forced to lock the highly carved wooden doors after the Israeli government shut down places of worship in a bid to contain the spread of the Covid-19 illness.
Despite Tom Cruise’s desire to produce an authentic representation of military flight in “Top Gun: Maverick,” the US Navy quickly halted the American actor’s dreams by denying him the ability to fly a $70 million F/A-18 Super Hornet.
Russia has sent a plane with medical equipment to the United States amid the pandemic of COVID-19, US President Donald Trump told reporters on Monday. “I have to say, we’ve had great relationships with a lot of countries. China sent us some stuff,” he told reporters during a briefing at the White House. “Russia sent us a very, very large plane load of things. Medical equipment. Very nice.”
Authorities in Wuhan are unlikely to disclose the overall number of deaths until now in the central Chinese city despite renewed concerns about underreporting of fatalities from the coronavirus pandemic. An official at Wuhan’s Civil Affairs Bureau said on Monday that the numbers would be released in the second week of June as scheduled, and that there is no plan to alter the date. The comment came after reports that funeral homes in Wuhan have ordered thousands more urns than the official death tally of coronavirus patients in the city.
Saudi Arabia will finance treatment for anyone infected with the coronavirus in the country, the health minister said on Monday, while the agriculture ministry took steps to boost wheat and livestock supplies amid global fears of a food shortage.
Construction is complete on one of the biggest breakwaters in Japan, a massive seawall built alongside coastal areas here to prevent flooding in the event of a tsunami. The breakwater is up to 15 meters tall and stretches 17.5 kilometers in length. It is expected to withstand a massive tsunami caused by a Nankai Trough earthquake and dramatically reduce flooding.
The latest safety measure of the Nagoya-based expressway operator can be found in bathroom stalls at the Ebina Service Area rest stop on the Tomei Expressway in Ebina, Kanagawa Prefecture. When the user sits on the toilet and presses a button on the LCD screen installed on a wall, their fatigue level will be shown about one minute later. “Fatigue can lead to careless driving. We thought about ways to let drivers know, ‘You must be tired,’” said Koji Yamamoto of NEXCO Central’s Yokohama Maintenance/Customer Service Center.
Sun Activity
A new sunspot is emerging in the sun’s northern hemisphere, right here. Its magnetic polarity identifies it as a member of new Solar Cycle 25. If the sunspot lasts long enough to receive an official designation, it will become the 4th numbered new-cycle sunspot this year, a sign that Solar Cycle 25, while still weak, is gaining steam.
Strongest EQ in Europe M4.4 Azores-Cape St. Vincent Ridge Strongest EQ in North America M2.8 California Strongest EQ on the Planet M5.3 Taiwan Deepest EQ M4.2 290 km Northern Mariana Islands News Burst 31 March 2020
Share this: Send the word out using these buttons!
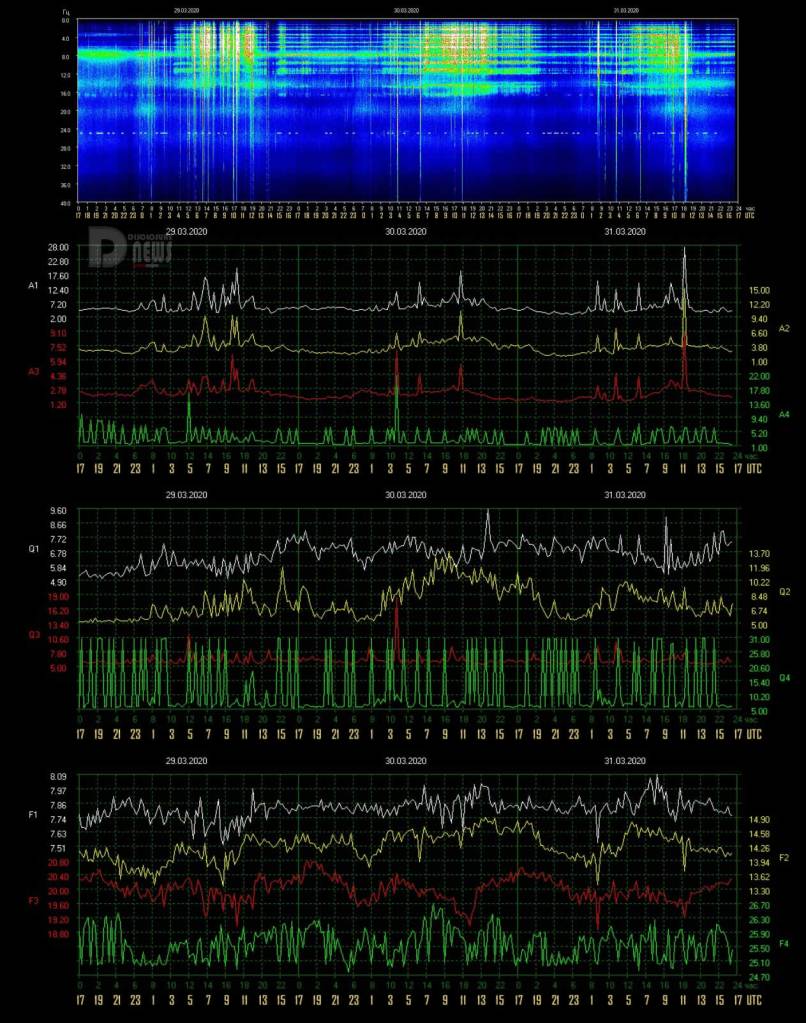
Editor’s Note: We can see from the graph above the cyclic manner in which the Schumann Resonance energies. This also infers the cyclic manner in which cosmic energies are coming to the Earth, which, in turn…prompt the Earth to resonate with the Schumann Resonance energies.
Remember….the Earth “rings like a bell” in response to receiving energies from our Sun, and the Galactic Central Sun. Knowing this rhythmic receipt for the energies promoting Love also allows humanity to relax from the struggle for survival, allowing us all to BE in…
Schumann Resonance Today. We will try to keep you updated about the variations of the Resonance with this page. The great variations that nobody can explain but that give us a clear sign that the planet is changing. The Earth is vibration higher and higher, just like us!
The Chart time is based on Tomsk – Russia – UTC (Universal Time Coordinated) +7Source
RS Base Frequency 7.83 Hz.
Schumann Resonance Today Peaks:
“Every second, a multitude of pulses travel around the world in this unique, resonant chamber between Earth and the ionosphere, sending colluding signals to all microorganisms. These signals couple us to the Earth’s magnetic field. Named after their discoverer, these Schumann Resonances (SR) drive the harmonizing pulse for life in our world.” Eric Thompson
3/31 12:00 – In the new graphs can be seen that the “almost calm” lasted 6 hours, from 19 yesterday to 1 am UTC today when new movements started which led to a spike that reached Power 15, this was followed by other variations between Power 10 and 15 until 11 UTC when a new peak has reached Power 28.
3/30 17:00 – The horizontal bands are back while the dotted line generated by Quality remains. The amplitude values, on the other hand, are almost calm.
3/30 14:00 – How long since the last totally calm day? Today the movements once again show moderate activity starting around 4 UTC and continuing with a steady slight increase up to the strongest peak so far at Power 19 at 11 UTC. The dotted line on 25 Hz also continues with what now seem to have become consuetudine, Quality Q4… all these Q should make you think.
3/29 17:00 – Almost calm.
3/29 14:30 – Today’s new activity began very gently after midnight UTC when the amplitude very slowly started a steady increase. The maximum values were of medium intensity, Power 20 was reached at 10 UTC and at 13 the situation returned to calm. The Quality Q4, which has graphically generated a sort of ‘Morse Code’, also appears to be in the subsidence phase.
3/28 23:00 – The new graphs show what apparently seems calm, in reality the dotted line continues on the 25 Hz line due to the dense and continuous variations of the Quality Q4. The intense green coloring on the 8 Hz line seems to be due to the A4 amplitude.
3/28 17:00 – A last isolated movement at Power 29 at 13:40 closes the today’s graph (local timeline) but not the slight movements of the Quality.
3/28 14:00 – What graphically seems to have been the period of the “bands”, from around 1 UTC on 26 March, is apparently closing with the latter peak at Power 45 at 12 UTC today, so just under 3 days when the activity, between ups and downs, it has been practically continuous.
3/28 11:00 – Another day of significant activity, given the situation on the planet, it seems obvious that this could be the case. The first movement, as previously reported, reached Power 30 between 18 and 19 UTC yesterday; the second occurred at midnight UTC, from 11 pm to 1 am, and was the maximum value reached so far, Power 47. The latter was followed by a period of relative calm until 10 UTC when a new leap brought the amplitude at Power 33. A purely personal interpretation of these movements could be the updating of the Etheric DNA, 9 strands are involved which have had one of the many “firmware updates”, this first group was completed at 12; the second group of 8 was completed at 18 and the filament 5, at 7.83 Hz, was done powerfully at midnight UTC. It appears that there are now 4 left.
3/27 21:00 – The activity has steadily and slowly increased since 13 UTC yesterday, with the new charts we see a strong peak that has brought amplitude to Power 30, the movement started at 18 UTC and lasted about 1 hour.
3/27 17:00 – There was a drop in the highs reached but the activity remained significant. A series of variations between 11 and 13 UTC, accompanied by a dive in the frequency, reached Power 20 once again but in this period of time we have been for about an hour and 30 minutes above Power 15. The horizontal bands continue even if with less intensity. Has anyone tried to decipher the Morse Code formed by lines and dots on the Frequency of 25 Hz in the main graph?
3/27 11:00 – No calm today, after the series of “stripes” which have remained at an amplitude around Power 10 some significant movements have interrupted this peculiar “graphic”. The first movements beyond the 10 threshold occurred at 5 UTC with what is the strongest peak so far, Power 26, correlated with a discreet leap in frequency, an increase. Between 7 and 8 UTC it reached Power 20 but even if the amplitude was smaller a strong oscillation of the frequency, a decrease this time, brought the ECC close to the value of the previous peak.
3/26 22:30 – In the new chart we see a rather particular graphic representation consisting of a series of horizontal lines, instead of the usual vertical ones, spaced by a few Hz in the lower part of the frequency band while the distance increases slightly as the frequency increases, the last line corresponds to 14. Difficult to give an explanation with the data shown in the graphs.
3/26 17:00 – Today we had two peaks at Power 17, at 1 am and 2 am UTC, these were followed by a very light activity that touched Power 10 on several occasions, always keeping the light movements constant. Note the strong Quality peak that occurred at 1 UTC when it reached 17×2, Power 34, which, together with a sudden drop in frequency to 7.27 Hz, brought the ECC to 78 as shown in the table below. From 14 UTC it seems that a more intense period has started. The dotted line in the main chart si continuing, generated by the values of Quality 4.
3/26 01:30 – After about 13 hours of calm we had this isolated peak at Power 17 at 1 am UTC.
3/25 17:00 – Today’s activity took place in a time span of 8 hours, from 2 to 10 UTC, the maximum value reached was Power 41 at 8:15 within a period of about 2 hours, from 7 to 9 UTC, with greater intensity. From 14 UTC, a calm situation seems to have returned.
3/25 08:30 – We had about 12 hours of almost calm until 2 UTC when new movements suddenly brought the amplitude around Power 35 with two peaks at 2:30 and 4 UTC. From 7 UTC it seems that the intensity is increasing towards Power 41 and beyond at 8 UTC.
3/24 17:00 – The last 24 hours have been characterized by an initial part of calm, from 17 to 2 am UTC. All the parameters in the graphs show minimum values, even the dotted line generated by the Quality has stopped. Just before 2 UTC, slight variations began with Amplitude between Power 10 and 15, also Quality and Frequency have resumed the movements. Around 9 UTC in the main graph we can see a more intense coloring due to the decreasing movements of Frequency and increase of Quality value. The highest peak in Amplitude was at 4:30 UTC at Power 17 while the combination of all parameters gave an ECC peak at 36 at 9 UTC, compared to 24 of the previous peak.
3/23 17:00 – The activity decreased gradually, the last peak in time order was at about 13 UTC and reached Power 15, however there are still variations especially in the Quality which with “rhythmic” movements is apparently “drawing” the dotted line on the 24 Hz in the main graph.
3/23 11:30 – Moar movements occurred with another series between 8 and 10 UTC, here the maximum reached was Power 30 at 8 am and Power 20 at 9:30 UTC.
3/23 04:30 – We are on the move again, after about 4 hours in which the variations have reduced, since after midnight UTC we see a gradual increase, Power 15 has been exceeded at 2:30 and for about 1 hour we have remained on that value until a strong peak has brought the SR back to Power 46.
3/22 17:00 – Let’s summarize the activity shown in today’s chart. The movements lasted 12 hours, from 5 to 17 UTC. The most important part started at 10 UTC and is still ongoing. The peaks were initially Power 50 and then moved to Power 60 around 13 UTC. At the time of this update there are strong isolated peaks but very close to each other that reach between Power 40 and 45.
3/22 15:00 – This wave of very strong activity has reduced fro now, started at 10 UTC went above Power 40 at 11 and has returned below the threshold of 40 at 14 UTC, 3 hours of very strong activity in which the average was Power 50.
3/22 12:30 – Big movements in progress, after the ‘opening’ at Power 50 a much more powerful activity started at 9 UTC and brought the maximum to Power 56. The changes have been significant in all parameters and at the time of this update Gaia is still telling us something.
3/22 08:30 – We’re back to a condition of strong activity, at 5 UTC we had a first movement and within 40 minutes we had a powerful peak at Power 50 for the duration of 20 minutes until 6 UTC. This initial spike has been followed by another, Power 23 at 7 UTC. The movements seem to continue.
3/21 17:00 – Today was a mild activity day, the slight variations that colored the main graph were of the Quality and Frequency. A line around 24 Hz can be seen in the primary graph, it started at 9 UTC yesterday and stopped almost exactly 24 hours later at 9 UTC today. The detector that generated this line seems to be that of the Frequency, the F4 detector has measured almost the same value for 24 hours.
3/20 17:00 – After the maximum peaks occurred during the UTC night, the movements continued with ups and downs but never stopped. At 9 UTC a surge in amplitude reached Power 34 and then lowered around Power 10, and so it remained practically until this update. In the last hours of the main graph a “colored” activity is shown, in this regard the cause of this “coloring” is due to the wide variations both in Quality and Frequency, the latter increasing. In this regard, although the variations in frequency may seem minor, these have a strong impact on the main graph and consequently on the Energy of the Collective Consciousness.
3/20 09:30 – Even today strong activity, for three days the movements have been almost continuous and at the time of this update we are above Power 30. The most massive part so far has started just after midnight UTC, the changes have brought the amplitude gradually to Power 44, this value was practically maintained for almost two consecutive hours, from about 2 am to 3:30 UTC. Thereafter there wasn’t a real pause, but only a decrease in the amplitude of these movements which once again reached a significant peak at 9 UTC with Power 34.
3/19 22:00 – As anticipated, after a series of slight movements straddling the change of graphs, from 21 UTC there has been about an hour of activity that brought the amplitude of the SR first to Power 22 and then to Power 32 just before 22 UTC.
3/19 17:00 – The activity has decreased in the period from 12 to 17 UTC but in the last two hours there are fluctuations in the Quality which, together with a slight increase in the Amplitude, suggest a restart of the movements.
3/19 11:00 – Even today we are having some activity, isolated peaks with increasing amplitude started from 1 UTC, the most significant movements were at 7:30 UTC with Power 28 and at 9:30 UTC with Power 32.
3/18 17:00 – The activity lasted about 20 hours, from 19 UTC yesterday to 15 UTC today. Now the movements have decreased significantly.
3/18 09:30 – A day of strong activity, Gaia is responding to the moment of strong impact. The strongest peaks so far have occurred in the UTC night when at midnight the amplitude reached Power 50, they were not isolated movements but a set of variations of all the values reported. From 7 UTC to now, even if the amplitude fluctuates around Power 40, both the Quality and Frequency are having very strong movements, bringing the ECC to 85.
3/18 00:00 – The new graphs started with a bang, after a first peak at Power 36 at 19:30 UTC the activity continued as predicted and continued to increase, from 21 UTC the movements increased in intensity to reach Power 45 at 22 UTC, from what we can see it seems that there will be be further activity.
3/17 21:00 – The new charts, of March 18 but technically still on 17 in UTC time, show a moderate activity that started shortly after 18 UTC and that in about 1 hour brought the amplitude to Power 36. The activity seems to continue.
3/17 17:00 – Calm.
3/17 10:30 – Another day of light activity, so far the maximum has been reached at 00 UTC today with Power 14.
3/16 17:00 – Today we saw quite significant movements started at 3 UTC and continued until 14. The maximum values did not reach high peaks but the variations of all three parameters gave a much more intense coloring than yesterday. Now it seems that we have entered a period of calm, we shall see if “Coincidence 17” will be repeated with the new graphs.
3/16 07:30 – Today’s activity has become more relevant but not so much for the variations in amplitude but rather for the movements that we can see in the line graph of the Quality and the drop in that of Frequency. This series of movements is highlighted in the main graph in the period from 3 to 7 UTC. The activity is continuing.
3/15 17:00 – No changes, slight background activity.
3/15 11:00 – The activity continued with slight movements as yesterday but with a slight increase, the strongest peak in the new charts occurred shortly after 19 UTC yesterday and reached Power 32. Subsequently, the background hum remained with variations of both Quality and Frequency, from these the lively coloring of the main graph.
3/14 17:00 – Today’s, shown in the graphs, is divided into two parts, the first characterized by calm, the second by slight movements around Power 10 that seem to continue.
3/14 11:30 – Today’s graphs show that from 2 UTC the light movements are almost continuous, the amplitude of these variations is moderate reaching several times the maximum of Power 13.
3/13 17:00 – After the peak previously reported at Power 42, which was the strongest of the day, light movements continued until 11 UTC with a final jump to Power 13 and since then it has been calm.
3/13 10:30 – In the new graphs we can see that from just after midnight UTC slight movements began which, up to 7 UTC, had oscillations of amplitude around Power 10. From 7 to 8 UTC there was a strong peak that led the amplitude at Power 42, after this movement we went back to a slight background activity.
3/12 17:00 – After the strong peak at Power 57 between 8 and 9 UTC, the activity completely and suddenly subsided returning to a calm state.
3/12 9:00 – March 12 is a special day, we would have liked to make a prediction… In any case, the activity had a small surge in yesterday’s UTC evening, between 19 and 22, with variations in amplitude that reached Power 20. These were followed by relative calm until 6 UTC when we had an isolated peak at Power 24. At 7 UTC the strongest activity so far began, and brought amplitude to Power 57 between 8 and 8:30 UTC. The ECC for this peak turns out to be 90, see table below.
3/11 22:00 – As anticipated, with the new charts we see that the activity has returned with a crescendo that, from 19 UTC, has led the amplitude to reach Power 20 at 21 UTC. The activity seems to continue.
3/11 17:00 – Slight movements continued after 7 UTC reaching a maximum of Power 8 at 14 UTC. Not much after, just at the time of this update seems like new movements are starting.
3/11 13:00 – The latest updated graphs show a period of calm that lasted from 10 UTC yesterday until 1 am when a series of very light movements around Power 10 started, these oscillations continued until 7 UTC, from that moment calm seems to have returned.
3/10 17:00 – Always and only 17, after the peaks at Power 17 the calm began at 17 local timeline, 10 UTC.
3/10 09:30 – The activity continued even if all along at moderate levels, the peaks continued around Power 17. We got it, 17… 5:5 🙂
3/9 17:00 – Power 17 remained the highest value on today’s chart but there is still a slight background activity.
3/9 13:00 – The new graphs show that a slight activity has always been present for almost 48 hours. The most significant movements, so far, have started around 1 UTC when the amplitude has exceeded Power 10. Around 6 UTC there was a further increase in Power 13 and at 10 UTC we had Power 16. The crescendo is continuing and at the time of this update we are at Power 17.
3/8 17:00 – From 13 UTC the activity started to subside.
3/8 15:00 – The last 24 hours have been characterized by an average activity with the most intense part in the hours preceding midnight UTC. For the remaining part, the movements were continuous but limited around Power 10, shortly after 17 of the local timeline (10:30 UTC) there was a movement that reached Power 17.
3/7 22:00 – We had anticipated that we could have a significant activity and so it is. The rise was constant until 21 UTC when a powerful peak reached Power 41.
3/7 17:00 – Around 15 UTC started what appears to be the beginning of an activity that could become significant, the amplitude exceeded Power 10 just before 17 UTC.
3/7 13:00 – Not much to report except that the very light background movements have continued, in today’s graph we can note two isolated peaks, one at 18 UTC yesterday that reached Power 13, and one at 11 UTC today that reached Power 14.
3/6 17:00 – After a calm night (UTC), very light movements began at 3 UTC which almost cyclically brought the amplitude to Power 13 around 7 am UTC, the maximum value of today, which was repeated at 9 UTC. After these last light isolated peaks, the very slight background movements continued.
3/5 17:00 – After the last isolated peak at Power 22 happened at 13 UTC, the movements quickly subsided and we are now in a calm condition.
3/5 13:00 – The activity in today’s chart occurred in three distinct periods: from 18 to 20 UTC (yesterday) when we had the strongest peak so far at Power 36; around 1 UTC with the maximum of 29 Power; from 9 to 11 UTC with various movements that had the maximum at Power 22. If we analyze the three line graphs we see that the strongest peak, in terms of ECC, was that at 8 where we see significant variations in quality and in frequency, the value is 59.
3/4 20:30 – The slight movements that we saw at the passage of the new chart were the preamble to a series of significant spikes that started around 18 and in a few minutes brought the amplitude to Power 26, which was followed, about an hour later at 19:30 UTC, by a further increase to Power 36.
3/4 17:00 – Minor movements around Power 10 continue.
3/4 09:00 – The calm period lasted about 20 hours, from little after midnight UTC some slight movements started and reached the maximum at Power 9, from 5 UTC the values slightly increased up to Power 11. Looking at the frequency graph we see that it is actually in a downward peak, possible indicator of more powerful activity.
3/4 00:00 – The total calm in which we are in has lasted for more than 12 hours.
3/3 17:00 – The last two isolated movements, before the calm, occurred at 9 and 11 UTC reaching Power 9.
3/3 10:00 – In the new main graph we see a series of very close vertical thin lines that begin shortly after midnight UTC and from 6 am start to fade out. The peaks have been of moderate values, so far the maximum has been Power 13 just before 4 UTC. It can be noted, once again, how the movements that have the most ‘chromatic’ impact on the graph are those that have seen changes also in the Quality.
3/2 17:00 – Other minor movements in the latter part of the day around Power 10 occurred between 9 and 12 UTC, after which it was calm.
3/2 09:00 – Today’s chart shows a calm condition until 1 UTC when few slight isolated movements started, they occurred over a 8 hours hours period, until 9 UTC. The maximum value reached was Power 21 at 5 UTC, this specific movement saw frequency and quality oscillations, in addition to the amplitude, and the ECC value was 43.
3/1 17:00 – Today’s graphs show two different types of activity, one given only by the Amplitude, identified by the isolated white lines, and one given by the other parameters, with various colors of green yellow and red. Today’s periods of greatest activity do not correspond to the maximum amplitude peaks, which reached Power 10 just before 1 UTC. The most intense, relatively speaking, part instead took place from 20 to 21 UTC yesterday.
Frequency means how many wave cycle happen in a second, 1 Hz. means 1 cycle per second, 40 Hz. means 40 cycles per second, Amplitude is the size of the vibration, how big is the wave, the chart shows the frequency variation in Hz and the amplitude using the white color.
Note
The Ancient Indian Rishis called 7.83 Hz the frequency of OM. It also happens to be Mother Earth’s natural heartbeat rhythm Schumann resonances are named after professor Schumann who was involved in early German secret space program and was later paper-clipped into the United States. The frequencies of Schumann resonances are fairly stable and are mainly defined by the physical size of the ionospheric cavity. The amplitude of Schumann resonances does change and is bigger when ionospheric plasma gets excited. Ionospheric plasma excitation happens because of solar activity, thunderstorms, use of scalar plasma weapons and HAARP and lately also when the Light forces are clearing the plasma anomaly. Show entriesSearch:
All the SR daily images in one single page See the Images
Explanation of The Chart
The Schumann Resonance Spectrogram Chart
The Schumann Resonance Chart displays data from the magnetic field detector to monitor the resonances occurring in the plasma waves constantly circling the earth in the ionosphere. These three days spectrograms show the activity occurring at the various resonant frequencies from 1 to 40 Hz. Within the spectrogram, the power, or intensity level of each frequency is displayed as a color, with white being the most intense. The Schumann Resonances appear as the horizontal lines at 0.0, 4.0, 8.0, 12.0, 16.0, 20.0, 24.0, 28.0, 32.0, 36.0 & 40.0 Hz. This chart is based on Tomsk, Russia, time UTC +7 (UTC = Universal Time Coordinated).
What is a Spectrogram?
The Spectrogram Calendar is a visual representation of the range of frequencies in the magnetic field at a given location. Similar to how an equalizer displays the frequency content of music played on your stereo, the spectrogram calendar displays the frequency content of a magnetic field. Instead of showing a brief snapshot, it shows changes over a period of time, in this case 3 days.
The local magnetic field is a dynamic field that changes constantly because of variations in the ionosphere and sun and many other influences not yet fully understood. The range of variation displayed in the spectrogram chart is from 0 to 40 cycles per second. The vertical axis is frequency and the horizontal axis is time. The amplitude of a particular frequency at a specific time is represented by the intensity of color (green, yellow, white) of each point in the image.
I look forward to a great future for America – a future in which our country will match its military strength with our moral restraint, its wealth with our wisdom, its power with our purpose.
John F. Kennedy
Share this: Send the word out using these buttons!
A Blue Moon happens when we have two Full Moon’s within the same calendar month. While Blue Moon’s are fairly rare, this is the second Blue Moon for 2018.
Falling on March 31st in the sign of Libra, the Blue Moon is going to deliver us a big dose of lunar energy to work with.
While a Blue Moon is no different from a regular Full Moon, having two Full Moon’s in the same calendar month signifies an opportunity to really release and let go under the vibration of that month.
Seeing as March is a number 3 month, it seems that we are all being guided to tap into this number 3 energy and begin releasing all that is blocking us from bringing this “3” energy into our lives.
In numerology, number 3 represents the divine trinity, and is all about bringing balance to your mind, body, and spirit. In astrology, the number 3 is also the number of divine communication, and represents the harmony that is achieved when you are in communication with all aspects of your mind, body, and soul.
There is a great comfort that comes in learning how to talk and listen to yourself. It is only when you tune in and go within that you can really work out what messages and wisdom is waiting to be given to you.
Everything you need is already inside of you, and under the presence of this Libra Blue Moon, you will really be able to unlock and release all that is stopping you from knowing who you truly are and accessing the innate wisdom that lives within.
Seeing as this Full Moon falls in the sign of Libra, you are also going to be encouraged to think about how you can bring balance back into your life.
If you have been feeling scattered, or have had trouble finding your footing since the start of the year, this Full Moon will really help you to let go of all that is throwing you off center.
Full Moon’s are always pulling and drawing things out of us so we can clear the past and make space for the future. They also have a way of triggering us to delve deeper into our emotions so we can make sense of what is really troubling us underneath it all.
If emotions come up around the Full Moon, know that they have arisen in order to be looked at, dealt with and cleared. This is so you can get yourself back into balance and feel grounded and centered with the direction of your life.
One of the most powerful tools for releasing is forgiveness. When you forgive yourself and others, when you release yourself of any guilts and pains and bring acceptance in its place, it can be extremely healing and recharging.
If heavy, heated emotions like anger come up, try to dig a little deeper and see if you can uncover any sadness that may be lingering behind the scenes. Often anger and other heated emotions are really just masks for pain and sadness.
It is also worth mentioning that Mercury is in retrograde and very active around this Full Moon, so being mindful of what you say, and really following your instincts is going to be important.
While doing your own healing work is extremely powerful, especially under the influence of this Libra Blue Moon, don’t be afraid to also seek external support too. Seeing a counsellor, going for reiki, or having an acupuncture session are all great ways to help support your healing journey.
The first few months of the year can sometimes feel unsettling as we get used to the new energies and new vibrations, but following this Blue Moon, it is likely we are all going to feel a little more at ease and a little more balanced with what is to come.
This Blue Moon is going to be drawing us to our center point and from here, we will be able to open up to the wisdom that lies within.
This is a powerful Blue Moon that is here to help you balance the scales in your own life. Don’t be afraid to do away with things that are no longer serving you, don’t be afraid to let go of emotions that are throwing you off balance, don’t be afraid to forgive yourself, and release yourself from any burdens or guilts you may be carrying.
Through shedding your thick heavy coat, you will feel reborn and you will be able to tap into the wisdom and messages that reside within.
~~~~~~~~~
Share this: Send the word out using these buttons!