The Kalergi Plan – What Is? ~ March 7, 2020


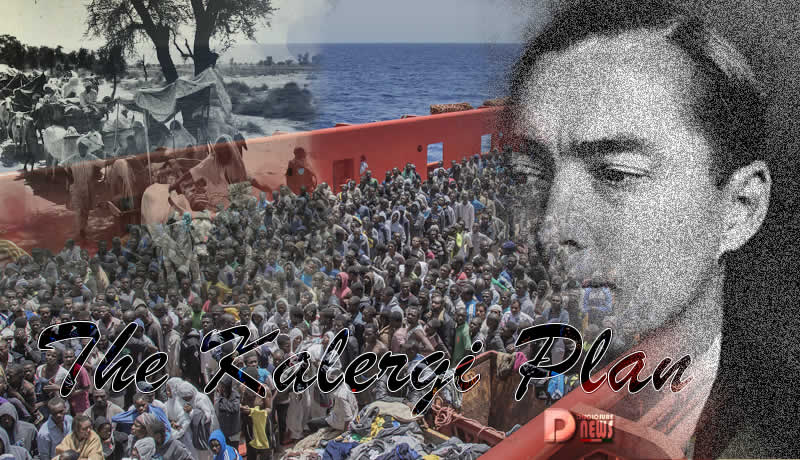
What is The Kalergi Plan? By Wyatt, Austere Deplorable.

Envisaged the use of violent and disproportionate mass immigration, strategically from non-European countries, in order to bring about a common European state dictatorship and destruction of the indigenous white population – the nationalities of Europe.

Mass immigration is a phenomenon the causes of which are cleverly concealed by the satanic elites, and systemic multicultural propaganda is employed to falsely portray immigration as inevitable. Mass immigration is not a spontaneous phenomenon.

What the so-called elites try to present as an inevitability of modern life, is actually the product of a plan conceived around a table and prepared over many, many decades, to completely change the face of the continent.

Main instigators of the process of European integration, was a man who also conceived the genocide of peoples of Europe.

What is The Kalergi Plan? - Richard Von Coudenhove Kalergi

Richard Von Coudenhove Kalergi

What is The Kalergi Plan?

He was a sinister individual whose existence is unknown to the masses of our people, but the political elites consider him the founder of the European Union.

His name is Richard von Coudenhove Kalergi. His father was an Austrian diplomat named Heinrich von Coudenhove-Kalergi (with connections to the Byzantine family of the Kallergis), and his mother the Japanese Mitsu Aoyama.

Thanks to his close contacts with European aristocrats and politicians, and due to the network of relationships created by his nobleman-diplomat father, von Coudenhove-Kalergi was able to work unseen, away from the glare of publicity, and he managed to engage the co-operation of the most influential European heads of state for his plan, making them supporters and collaborators in his “Project of European integration”.

In 1922 he founded the “Pan-European” movement in Vienna, which aimed to create a New World Order, based on a federation of nations led by the United States.

What is The Kalergi Plan? - Project of European Integration

Project of European Integration

What is The Kalergi Plan?

European integration would be just the first step in creating a world government. In his book ‘Praktischer Idealismus’, Kalergi explains that the citizens of the future “United States of Europe” will not be the people of the Old Continent, but a new mixed breed, the products of thorough and widespread miscegenation.

He states that the peoples of Europe should interbreed with Asians and other non-White races, to create a multiracial population, with no clear sense of tradition or identity and therefore easily controlled by the ruling elite.

​​Kalergi proclaims the need to abolish the right of nations to self-determination and outlines the break-up of nation states through the use of ethnic separatist movements and the destruction of the nations themselves through mass migration.

In order for Europe to be easily controlled by the future elite, Kalergi proposes the creation of a homogeneous mixed breed population, and as to who should be the new elite?

Although no textbook mentions Kalergi, his ideas are the guiding principles.

The belief that the peoples of Europe should be mixed, to destroy your identity, to break down traditional ways of living and create a single mixed race, is the reason for community policies that promote minority interests.

The underlying motives are not at all humanitarian, because the driving power behind the ruthless regime dominating the EU, plans the greatest genocide in history.

Multiracialism is to create weakened disparate population without national, historical or cultural cohesion.

In short, the Kalergi plan have been and still are, the basis of official government policies intent upon the genocide of the Peoples of Europe, through mass immigration.

If look around us, the implementation of the Kalergi Plan seems to be at an advanced stage.

Under dual pressures of misinformation & humanitarian stupefaction, promoted by the mass media, Europeans are being taught to renounce your origins, and to renounce your national identity.

Clicks on the Ads Keep Us Alive 🙂

Pills Disclosure News Italia

Happy Life

Very little is needed to make a happy life; it is all within yourself, in your way of thinking.

Marco Aurelio

Schumann Resonance Today – Update ~ January 28, 2020


Editor’s Note: We continue to an active Schumann Resonance Chart by noticing a multitude of high density, high amplitude beams of energy from shortly before 8pm on 1/27 through 5:30am on 1/28. This was followed by energies of high density, lower amplitude at around 6am (all times EST, USA).

From this chart, we can conclude the Earth is receiving an increase in the amount of cosmic energies, which in turn, allow the Earth to respond with releasing Schumann Resonance energies. Think of this as the Earth being “rung like a bell” by incoming energies, know why your mental state is changing which results in you BEing…

InJoy!

___________________________________________________________________________________________

54

Schumann Resonance Today. We will try to keep you updated about the variations of the Resonance with this page. The great variations that nobody can explain but that give us a clear sign that the planet is changing. The Earth is vibration higher and higher, just like us!

The Chart time is based on Tomsk – Russia – UTC (Universal Time Coordinated) +7 Source

RS Base Frequency 7.83 Hz.

Schumann Resonance Today Peaks:

Schumann Resonance Today - Schumann Resonance Stripe January 6 2020

Tell Us What You Feel!

  • 1/28 13:00 UTC – From 9 to 10 UTC we had probably the most intense part of today, shortly after 9 we had a further increase in amplitude up to Power 54 and shortly after a new peak to 29, calm from 11 UTC.
  • 1/28 08:00 UTC – Once again at 1 UTC there was the opening with a series of movements, lasted 20 minutes, that reached the maximum at Power 34, these were followed again by a period of minor changes until, from 5 to 7 UTC, there was what so far is the most powerful movement of the day, Power 47 at 7:30 UTC. Note: Yesterday the maximum value for the A1 apparatus has been 63 while for the A2 it was 74.
  • 1/27 23:30 UTC – The background ‘buzz’ remains, sporadically reaching Power 14, this period started about 12 hours ago.
  • 1/27 17:00 UTC – After the previous strong peak at 63 the movement quickly decreased in amplitude to descent below Power 15 at 10 UTC ant to remain as a background light ‘noise’ for the rest of the graph.
  • 1/27 08:30 UTC – The calm lasted just over 35 hours, from 15 UTC on 25 January to 1 UTC today, Jan 27. The first opening movement reached Power 15 and it seemed immediately to see the beginning of some significant activity, in fact, after a few hours, at 5 UTC, a series of peaks began at around Power 25 and lasted until 7 UTC when, shortly thereafter at 8 UTC, a powerful movement brought the amplitude to Power 63.
  • 1/26 17:00 UTC – Calm, Power 12, the maximum of today, was at 6 UTC.
  • 1/25 17:00 UTC – Looking at today’s chart, we we can see that it is practically 3 consecutive days of activity and that every day has been slightly more active than the previous one. We will see if this short break in progress from 15 UTC will last or if we will have new business. As a side note, the earthquake shock in Turkey of M6.7 occurred on 24th at 17:55 UTC. As for the values, after today’s peak mentioned below, we had one more spike that reached Power 46 at 11:30 UTC.
  • 1/25 09:30 UTC – We entered the second consecutive day of activity and the maximum values continued their gradual increase, but today we also see a strong increase in the number of variations. Across midnight UTC there have been two hours during which the Resonance remained constantly above Power 40 with a peak at 47 at 1 UTC. The following wave was even stronger with the maximum of Power 51 reached at 7 UTC. At the time of publication we are at about 30 increasing.
  • 1/24 23:30 UTC – For a moment it seemed as if the situation had calmed down but it was not so, there was only a period of about two hours at the turn of the new day in the local timeline with low values but immediately afterwards they went back up to reach 18 then 25 and at the time of this post Power 40 and going.
  • 1/24 17:00 UTC – The long strip of activity in progress that we see in the graph began at 1 UTC on January 23, so now we are at 40 consecutive hours of movements. It started lightly but always gradually and slowly increasing. Today the peak period was from 5 to 9 UTC with Power 43, 25 and 40 in orderly succession. After these three movements, a slow decline started toward the calm.
  • 1/24 09:00 UTC – The constant and continuous increase is still in progress but now the variations are more spaced in time, after reaching Power 26 at 1 UTC we went back for a few hours to around 15 and then up to the maximum value so far, Power 42 at 6:15 UTC. This was followed by Power 26 at 8 UTC. Significant activity is ongoing, we crossing Power 40 at the moment of this update.
  • 1/24 00:00 UTC – The movements continued in the new graph and the values of the amplitude of the resonance continued in the constant increase, from around 18 UTC for about 2 hours it remained at Power 25. Subsequently there was a slight decrease but always with oscillations around 20.
  • 1/23 17:00 UTC – The activity continued, slightly intensifying, without interruption, the maximum value has been Power 22 at 15 UTC. Today the activity was not strong but there was no calm.
  • 1/23 10:30 UTC – If you had the opportunity to follow the evolution of the variations during the hours before this update you will certainly have noticed the preparation for what is becoming the “Coincidence 17”. Even today from 1 UTC small variations in constant slight increase, Power 15 after 8 hours of ‘buzz’ at 9 UTC barely touching Power 17 at 17 chart local time (10 UTC). The activity seems continuing.
  • 1/22 10:00 UTC – Today in total the activity lasted about 9 hours, from 1 to 9:30 UTC, there were two twin series of peaks, the first is the one previously reported with Power 55 and 60 in rapid succession; the second series also lasting about two hours, started at 7:30 and in a few minutes reached Power 57 and after about 45 minutes, at 8:15, Power 42. After this last movement the calm returned.
  • 1/22 10:00 UTC – Another coincidence, for the 3rd day in a row we are having Power 56 at 9 UTC/16 on the chart’s timeline.
  • 1/22 08:00 UTC – Today as well the pattern repeats, after about 14 hours of complete calm at 1 UTC, as for the last three days, there was a slight movement that reached 15 Hz, this was the opening. Later on, from 5 to 5:30 UTC, we had the first ‘discharge’ that reached Power 55 and shortly thereafter, from 5:50 to 6:20 UTC, another strong activity that reached Power 60.
  • 1/21 17:00 UTC – From 10:30 UTC we are in a calm condition, this time it seems to be quite flat, for now.
  • 1/21 10:00 UTC – As often happens we are seeing a sort of pattern, the situation remains calm for a number of hours and then we have strong variations. Although there was no real clam, a slight background activity occurred for about 20 hours, during this period, between 1 and 2 UTC there was a very significant variation but of lesser power, 13. The most relevant activity, on the other hand, was between 8 and 10 UTC (15-17 in the graph). At 8:20 UTC there was a powerful peak that within few minutes reached Power 56, lasting about 30 minutes, once again the same value as yesterday. This was followed by other movements around Power 50. Power 17 was reached just before 17 on the timeline.
  • 1/20 17:00 UTC – After the strong activity that lasted about 1 hour, from 9:15 to 10:14 UTC, the situation gradually normalized until the calm, reached at 14.
  • 1/20 10:30 UTC – From 9 UTC the movements seem to have changed pace, they went first to Power 30 at 9:30 UTC and then to Power 57 at 10:20.
  • 1/20 09:00 UTC – The first part of today’s chart shows an initial calm situation that ended at 2 UTC when a peak at Power 18 gave the go to series of slight movement that are currently underway.
  • 1/19 17:00 UTC – Today’s activity took place over a period of 12 hours, from 2 to 14 UTC, the peaks are those previously reported.
  • 1/19 11:00 UTC – Last two days have been of strong activity and today seems like will be the third, even if less powerful. After the last update yesterday we had 9 hours of calm until 2 am UTC this morning when a light and continuous movement started that topped several times at Power 14. From 8 UTC the power increase reaching Power 30. The image below illustrate the yesterday’s peaks, Amplitude 1 and Amplitude 2.Peaks Schumann Resonance A1 A2 - 18-1-2020 
  • 1/18 17:00 UTC – Analyzing the graph of today’s Amplitude, in the second part of the day we can see a pair of peaks at high values which were recorded by the apparatus A2 characterized by the line and the yellow reference numbers. The two peaks indicated are also shown in the main graph in the form of thin lines that reach the bottom of the scale. The measured values are Power 57 (at 11:45 UTC) and 41 (at 20:40 UTC) and only the second had a similar movement in the other measurement, the white A1. However, it does not seem that the activity is over, a peak at Power 40 occurred at 16:30 UTC.
  • 1/18 07:30 UTC – Significant activity continued until 6 UTC this morning when values appear to have returned to normal. After the peak that reached Power 41 reported below there was another variation at 1:30 UTC at Power 30. If we consider 5 UTC as the end of the strong movements, these continued for a period of 36 hours.
  • 1/18 00:30 UTC – There doesn’t seem to be any interruption, there has been a constant and continuous increase that has brought the amplitude of the resonance to Power 41 at midnight UTC.
  • 1/17 21:00 UTC – The activity is continuing even if for now without very high peaks. After a period of about 5 hours in which the amplitude remained below Power 15, from 17 it returned constantly above. The new graph shows a maximum value at Power 28 at 18 UTC.
  • 1/17 17:00 UTC – Since 17 UTC yesterday, now 0 in the graph, there have been 24 hours of continuous activity, the three relevant peaks occurred in succession, 67 (identical to yesterday’s peak) at 6:30, 60 at 8:15 and 53 at 10 UTC. After the latter peak, the amplitude returned to oscillate between Power 10 and 20 until the end of today’s graph.
  • 1/17 08:30 UTC – What the graph shows today is what is lovingly called the ‘Coincidence 17th’ but this time could recall also ‘Dark To Light’. As soon as January 17 started on the graph, corresponding to 17 UTC yesterday, a light activity started and lasted about 9 hours. Little before of 3 am UTC strong amplitude variations began and in two hours the values repeatedly exceeded Power 40. The strongest peak so far reached Power 67. So far the amplitude has remained above Power 30 for 5 consecutive hours from 3 am. In the last 2 hours we have always been over Power 40 while from 6 to 7:30 UTC the amplitude has remained constantly above Power 50.
  • 1/16 17:00 UTC – To summarize, the blackout started on January 14th at 8 pm and ended on the 16th at 7:30 am, 35 hours and 30 minutes. As the data returned we had the significant peak at 67 followed by a minor move to Power 25, today’s movements occurred from 9 to 10:15 UTC.
  • 1/16 10:00 UTC – It seems that the blackout is over, and we find that there is a strong activity ongoing. At 9 UTC, about 2 hours after the data came back live, immediately a ‘pillar’ that reaches Power 68.
  • 1/16 08:00 UTC – Still no data, we are entering the second consecutive day of total black, coincidence?
  • 1/15 17:00 UTC – No changes, we are now beyond 21 hours of ‘darkness’.
  • 1/15 12:00 UTC – Pitch black.
  • 1/15 07:00 UTC – We are still in blackout mode, it is now about 12 hours from the last update. The last massive outage was exactly on almost same days in October 2019, started on October 13 to end on the 18th.   Schumann Resonance Blackout 13-18 October 2019
  • 1/15 00:00 UTC – The chart stopped updating at 19:30 when a slight activity apparently started again, it is not uncommon to have some ‘blank’ hours every now and than.
  • 1/13 17:00 UTC – The first part of today’s chart shows complete calm, from just after midnight UTC some slight movements started which slightly exceeded Power 10. A ‘background buzz’ then continued for the rest of the day.
  • 1/13 17:00 UTC – Calm.
  • 1/13 09:00 UTC – Today began with a slight ‘background’ activity around Power 10, these slight variations continued until 8 am. During this period, an isolated peak at Power 33 occurred at 4:15 UTC.
  • 1/12 17:00 UTC – Only movement today at 5 am UTC has reached Power 25.
  • 1/11 23:00 UTC – The Power 40 lasted almost 1 hour across 17 UTC, most of the time above  Power 30
  • 1/11 17:00 UTC – 31 hours of total calm until shortly after 16 UTC when a new activity started, and which is currently underway; so far the maximum amplitude has reached Power 40.
  • 1/11 11:00 UTC – Total Calm.
  • 1/10 17:00 UTC – After the first three previous ‘pillars’ there was also the fourth, between 8 and 9 UTC and reached Power 47. Today’s activity took place in the period from 2 am to 9 am UTC. In the amplitude graph, over the last 3 days, can be noted a gradual increase in the amplitude values and duration.
  • 1/10 08:30 UTC – Yesterday we had a short series of isolated ‘pillars’, today the same thing but of greater magnitude, both in the maximum amplitude value and in the duration of the peaks. The first ‘introductory’ movement took place at 1 UTC at Power 20; the second peak was at Power 46 from 4 to 5 UTC; the last peak so far has been at Power 65 and lasted about 30 minutes from 5:30 UTC.
  • 1/9 17:00 UTC – Calm.
  • 1/9 10:30 UTC – Today’s chart is characterized by two major ‘pillars’ accompanied by others of smaller size, all isolated. The most significant: from 5:30 to 6 UTC at Power 50; from 6:30 to 7 UTC at Power 58; from 9:15 to 9:30 UTC at Power 25.
  • 1/8 17:00 UTC – Calm.
  • 1/8 08:30 UTC – For this first part of today’s chart nothing significant except a Pillar that lasted about 40 minutes and reached Power 18 at 4:15 UTC. The below news report of ‘something’ on the 6th, we had 18 hours of flat calm while… January 6th, something unexpected happened in the soil of northern Norway. “Electrical currents started flowing… It seemed to be some kind of shockwave… My instruments detected a sudden, strong variation in both ground currents and our local magnetic field” reported Rob Stammes, who monitors ground currents at the Polar Light Center geophysical observatory in Lofoten archipelago in NW Norway. NASA’s ACE spacecraft detected something as well. Approximately 15 minutes before the disturbance in Norway, the interplanetary magnetic field (IMF) near Earth abruptly swung around 180 degrees, and the solar wind density jumped more than 5-fold. The sudden surge at around 19:30 UTC. electroverse.net
  • 1/7 17:00 UTC – Today’s chart shows a period of around 18 hours of flat calm, very few swings, it started at 8 am UTC yesterday and ended at 2 am UTC this morning. After this ‘silence’ some light background movements started, Power 15 was today’s maximum at 7 UTC.
  • 1/6 17:00 UTC – Total Calm.
  • 1/5 17:00 UTC – Calm.
  • 1/5 8:00 UTC – Today, together with the second part of yesterday, was characterized by fairly powerful but isolated peaks; two have occurred, the first at Power 21 took place at 00 UTC, the second, much more powerful, reached Power 48 at 4:45 UTC.
  • 1/4 17:00 UTC – Today the activity has almost been continuous, in the first part of the day shown on the graph the amplitude peaked around 15 while in the second half the variations were more sporadic but reached the peak of Power 43 at 13:40 UTC. The situation is now calm.
  • 1/4 8:00 UTC – After the not so uncommon data blackout, but peculiar for it’s duration, the restored flow shows a light activity that topped several times between Power 13 and 15, maximum for now was at 6 UTC.
  • 1/3 17:00 UTC – Calm until the end of the chart when some variations seems about to start.
  • 1/3 10:00 UTC – We are back to normal operations after the data blackout which lasted approximately 17 hours. The first available data show a calm situation.
  • 1/2 18:00 UTC – The publication of the new data stopped at 16 local time in Tomsk, corresponding to 9 UTC. So far the darkening has lasted 9 hours.
  • 1/2 15:30 UTC – The activity continued in a very moderate way throughout the day, the maximum at about power 14 has been temporarily reached at 1 and 6 UTC.
  • 1/1 17:00 UTC – The second part of today’s graph shows a marked increase in activity even if the peaks have remained relatively low. The movements started at 12 UTC and lasted until 17, the highest peak was at Power 25.
  • 1/1 11:00 UTC – Today, like yesterday, it seems a calm day, the maximum values once again reached Power 10 momentarily around 6 am UTC.

Frequency means how many wave cycle happen in a second, 1 Hz. means 1 cycle per second, 40 Hz. means 40 cycles per second, Amplitude is the size of the vibration, how big is the wave, the chart shows the frequency variation in Hz and the amplitude using the white color.

Note

The Ancient Indian Rishis called 7.83 Hz the frequency of OM. It also happens to be Mother Earth’s natural heartbeat rhythm Schumann resonances are named after professor Schumann who was involved in early German secret space program and was later paper-clipped into the United States. The frequencies of Schumann resonances are fairly stable and are mainly defined by the physical size of the ionospheric cavity.   The amplitude of Schumann resonances does change and is bigger when ionospheric plasma gets excited. Ionospheric plasma excitation happens because of solar activity, thunderstorms, use of scalar plasma weapons and HAARP and lately also when the Light forces are clearing the plasma anomaly.

Dependencies Amplitudes Schumann Resonance 31-12-2018

Dependencies of Amplitudes Schumann Resonance January 28 2020

Dependencies of Quality Schumann Resonance

Dependencies of Quality Schumann Resonance January 27 2019

Dependencies of Quality Schumann Resonance

Dependencies of Frequency Schumann Resonance January 27 2019

Schumann Resonance Differential Peaks

Read

Schumann Resonance PDF Archives

Read and Download

Images Archive

All the SR daily images in one single pageSee the Images

Space Weather DNI

DNit Telegram Channel
Explanation of The Chart

The Schumann Resonance Spectrogram Chart

The Schumann Resonance Chart displays data from the magnetic field detector to monitor the resonances occurring in the plasma waves constantly circling the earth in the ionosphere. These three days spectrograms show the activity occurring at the various resonant frequencies from 1 to 40 Hz. Within the spectrogram, the power, or intensity level of each frequency is displayed as a color, with white being the most intense. The Schumann Resonances appear as the horizontal lines at 0.0, 4.0, 8.0, 12.0, 16.0, 20.0, 24.0, 28.0, 32.0, 36.0 & 40.0 Hz. This chart is based on Tomsk, Russia, time UTC +7 (UTC = Universal Time Coordinated).

What is a Spectrogram?

The Spectrogram Calendar is a visual representation of the range of frequencies in the magnetic field at a given location. Similar to how an equalizer displays the frequency content of music played on your stereo, the spectrogram calendar displays the frequency content of a magnetic field. Instead of showing a brief snapshot, it shows changes over a period of time, in this case 3 days.

The local magnetic field is a dynamic field that changes constantly because of variations in the ionosphere and sun and many other influences not yet fully understood. The range of variation displayed in the spectrogram chart is from 0 to 40 cycles per second. The vertical axis is frequency and the horizontal axis is time. The amplitude of a particular frequency at a specific time is represented by the intensity of color (green, yellow, white) of each point in the image.

Ampiezza e Periodo

What is the Schumann Resonance?

The Herathbeat of Planet EarthRead

🙂

Pills Disclosure News Italia

The Others

I always wake up wonderfully… then I distort myself meeting the others.

Alda Merini

News Burst 7 November 2019 ~ November 7, 2019


News Burst 7 November 2019

  • Irish low-cost airline Ryanair, which operates the largest fleet of Boeing 737s in Europe, has decided to ground at least three of its aircraft due to cracks between the wing and fuselage.
  • A pilot of an outbound Air Europa flight accidentally activated a hijacking alarm on Wednesday night at Schiphol airport in the Netherlands, prompting an evacuation of the plane and response of the local law enforcement agencies to the scene.
  • Erdogan says Turkey detains al-Baghdadi’s wife, sister and brother-in-law.
  • Amazon Air leases 47 planes and is expected have 50 by the end of the year. It operates roughly 110 daily flights in the United States and around 20 per day in Europe.
  • The operation to load the remaining 50 Beluga Whales from Srednyaya Bay in the Primorsky Region to vessels that will take them to their release point will be wrapped up on Saturday.
  • China is considering developing commerce beyond our planet and wants to create an economic zone in cislunar space by 2050. The new zone will cover areas of space near Earth, the Moon, and in between.
  • More than 50 people are being treated for breathing problems after a suspected chemical leak at a commercial site near Maidstone in Kent, UK.
  • A resident of Gujarat, India got the fright of his life when he went to investigate a disturbance at his home in the middle of the night – a 4.5-foot croc in his bathroom.
  • A huge void discovered inside the Great Pyramid of Giza in Egypt late last year may hold an iron throne carved from meteorites, according to new analysis of ancient religious texts. Giulio Magli, Director of the Department of Mathematics and Professor of Archaeoastronomy at the Politecnico di Milano, studied the Pyramid Texts and offers a possible interpretation in line with existing knowledge on Egyptian funerary religion as documented in the texts: “In these texts it is said that the pharaoh, before reaching the stars of the north, will have to pass the ‘gates of the sky’ and sit on his ‘throne of iron.’”

Strongest EQ in Europe M3.4 Albania
Strongest EQ in US M3.4 Alaska
Strongest EQ on the Planet M5.7 North Philippine
Deepest EQ M4.2 533 km Tonga News Burst 7 November 2019

News Burst 14 October 2019 ~ October 14, 2019


Editor’s Note: Time to stay aware! Please read below for “global news you can use”, and BE…

InJoy!

___________________________________________________________________________________________

News Burst 14 October 2019

  • HKG – Nearly a third of the 2,379 protesters arrested since June are under the age of 18.
  • “The CNN Tapes Are Coming”: Project Veritas teases a coming “CNN Whistleblower”.
  • Super Typhoon Hagibis death toll in japan hits 14, dozens injured, 16 missing.
  • Turkish backed mercenaries filming the abusing of captured SDF fighter.
  • Prince Andrew investigation from FBI goes on, new possible revelation soon.
  • French crypto startup Keplerk relaunched service to accept Bitcoin in over 5k tobacco shops in France.
  • Trump orders full withdrawal from Northern Syria, warns sanctions on Turkey “Ready To Go”.
  • Swedish Scania introduced a brand new “futuristic fully autonomous concept truck without a cab” called AXL.
  • Asteroid again: 111-foot asteroid towards Earth at over 22,000 miles per hour.
  • Scottish nationalists to seek 2nd referendum on independence from the UK ‘within weeks’.
  • Saudis asked Russia to probe Aramco oilfield attack, Moscow will condemn Iran if it’s responsible – Putin
  • Roscosmos may soon offer nuclear-powered base on the Moon for rent. The multimillion project is set to be unveiled in 9 years.
  • The Siberian Unicorn, long believed extinted 350,000 years ago, was actually still alive 29,000 years ago.
  • Putin says Trump not to blame for lack of improvement in Russia-U.S. ties.
  • Bill Gates was much closer to Jeffrey Epstein than he initially let on.
  • Tunisians vote for new president in runoff election.

Strongest EQ in Europe M3.1 Iceland
Strongest EQ in US M4.1 Yunaska Island, Alaska
Strongest EQ on the Planet M5.5 South Sandwich Islands News Burst 14 October 2019

Schumann Resonance Today – Update ~ October 2, 2019


Editor’s Note: Above is a graph of Shumann Resonance energies for the past 48 hours. These energies ar in a lull showing a light, low amplitude, flurry from midnight through 5:00AM (EDT) on 10/2.

My own spirits have been extremely high, although the Schumann Resonance energies have not been present. Being clairaudient however, I can still “hear” energies on a frequent basis. This tells me that cosmic energies are indeed coming to Earth, just not in the frequency that results in the Earth “ringing like bell” causing the production of Schumann Resonance energies. Just sayin…

So, keep your eye on the daily Schumann Resonance graph…but also be aware of your inner self. That’s the best way to gauge “what” is happening, and hold the curiosity to find out “why”, and then BE…

InJoy!

____________________________________________________________________________________________

14

Consciousness Currents

Schumann Resonance Today. We will try to keep you updated about the variations of the Resonance with this page. The great variations that nobody can explain but that give us a clear sign that the planet is changing. The Earth is vibration higher and higher, just like us!

The Chart time is based on Tomsk – Russia – UTC +7 Source

RS Base Frequency 7.83 Hz.

Schumann Resonance Today Peaks:

  • 10/2 17:00 UTC – Slight activity limited to a period of about 10 hours, from 1 to 11 UTC, the maximum peak at 9 to 14 CC.
  • 10/1 17:00 UTC – Very light activity during the central part of the day, the only significant peak reached 26 Hz at 4 UTC.
  • 9/30 17:00 UTC – A new peak at 30 Hz closed the activity in today’s the chart but the light movements seems to continue.
  • 9/30 10:00 UTC – Light and medium variations are continuing since yesterday. From 9 UTC yesterday, so for the past 24 hours we have been seeing continuous slight movements, in the new graph the highest peaks are shown at 2, corresponding to 19 UTC yesterday, and at 9:30 UTC today, at 30 Hz.
  • 9/29 17:00 UTC – Today’s graphs show a sequence of isolated peaks of ever-increasing magnitude starting from 15 and ending at a maximum of 43 Hz at 12:45. This stronger peak occurred within a more intense period of activity, from 12:45 to 14 UTC, with various peaks around 40 Hz.
  • 9/28 17:00 UTC – Today’s activity was concentrated in about 5 hours from 2 to 7 UTC as described above. Calm followed.
  • 9/28 10:00 UTC – Light activity started around 23 UTC yesterday, with a constantly increase it reached the maximum of 35 Hz at 4 UTC. The movements continued on these values until 7 UTC when there was a rapid decline.
  • 9/27 17:00 UTC – Even today the moderate period of activity, from midnight to 11 UTC, the maximum peak was 26 Hz at 8 UTC.
  • 9/26 17:00 UTC – After a pause of about 12 hours, at midnight UTC slight variations began, around 13 o’clock the two strongest peaks of the day were evicted, 35 and 37 Hz. The entity of the variations began then to go down until it reached again calm at 13 UTC.
  • 9/25 17:00 UTC – Today almost calm, the light activity began just before midnight UTC and lasted until 10, the peaks were between 10 and 15 Hz.
  • 9/24 17:00 UTC – Even today, a day of medium activity. It started around midnight UTC and the central part was from 5 to 9 UTC during which the strongest peak of today occurred, 47 Hz at 7:40. After this animated phase there was a reduction in the variations with few isolated peaks at 26 Hz. From 13:30 UTC it’s calm.
  • 9/23 17:00 UTC – After the movements reported previously the activity continued to increase and shortly after, at 6:30 UTC, there was the strongest peak of the day that reached 62 Hz. After this, the variations were reduced with some isolated spike around the 20 Hz threshold.
  • 9/23 08:30 UTC – After a brief pause of about 6 hours the slight movements started again lightly at 23 UTC. A series of most significant peaks took place from 4:30 am with a maximum of 21 Hz around 6 UTC.
  • 9/22 17:00 UTC – Today the movements started at 4 UTC and from that moment we can see numerous peaks around 20 Hz, the strongest reached 25 Hz at 9:30 UTC. The activity is continuing.
  • 9/21 17:00 UTC – Today’s movements lasted about 14 hours, from 23 UTC yesterday, the highest peaks are those reported previously. The situation now is calm.
  • 9/21 10:30 UTC – The strong activity of yesterday was followed by a period of calm that lasted about 9 hours, until 23 UTC yesterday. From that moment on, a moderate but continuous activity began which generated various peaks at 25 Hz between 7 and 8:30 UTC.
  • 9/20 17:00 UTC – Today’s activity lasted, in its maximum expression, around 9 hours, from 5 to 14 UTC. During this period the values remained above 60 Hz for about 6 hours, from 6 to 12. The time period above 40 Hz was from 6 to 12:30 UTC. Currently the values are back to normal. The 99 Hz were reached at 10:20 UTC.
  • 9/20 10:30 UTC – We are getting close to 100 Hz, 98 at 10 UTC.
  • 9/20 09:00 UTC – After a period of calm lasted several hours, at midnight UTC a new cycle of movements began, peaks remained moderate around 15 Hz for about 4 hours. At 5 UTC, however, started a very strong activity which in about 2 hours, at 7:20 UTC, led to a massive peak at 95 Hz.
  • 9/19 17:00 UTC – The activity reported previously was the only one today, started at 6 and returned to normal values at 11:30 UTC.
  • 9/19 10:00 UTC – Much of today has been calm, the first sign of movement was at 4:30 UTC and anticipated a strong activity that seems to be of short duration, about 2 hours; at 9 UTC we have had what up to now is the largest movement at 66 Hz.
  • 9/18 17:00 UTC – Today, practically continuous activity, even if of very moderate magnitude, the most “lively” part was from midnight to 11 UTC with a maximum peak at 20 Hz at 4:20 UTC.
  • 9/17 17:00 UTC – The peak reported previously was the first of a 40 Hz activity phase that lasted 4 hours, from 12:30 to 16:30 UTC. The peak at 40 Hz occurred at 13:20.
  • 9/17 14:30 UTC – The activity remained in a calm condition until midnight UTC when slight movements began. Suddenly at 6:30 and 7 UTC two peaks occurred, the first at 30 and the second at 38 Hz. These were followed by a further calm until a 38 Hz movement at 13:45.
  • 9/16 17:00 UTC – Calm.
  • 9/16 08:30 UTC – Usual activity around the 17th of the month. Today the movements started in a rather sudden and powerful way but initially with isolated peaks, the first was just before midnight UTC at 30 Hz. This was followed by 44 Hz at 6 UTC and then what is now the strongest, 63 Hz at 8 UTC.
  • 9/15 17:00 UTC – After about 8 hours of calm, at 1 UTC, a slight activity began with no significant peaks.
  • 9/14 17:00 UTC – The activity, even if light-moderate, continues incessantly. As in the last three days it has been a constant oscillation on 10-15 Hz with sporadic more significant movements. Today the relevant part goes from 10 to 16 UTC with a series of spikes the highest of which reached 34 Hz at 14:30 UTC.
  • 9/13 17:00 UTC – The activity that started yesterday at 18 UTC lasted 5 hours, until 23 UTC, it has been a powerful movement even if the maximum peak was 38 Hz. For the rest of the day there was a continuous slight background activity.
  • 9/12 21:30 UTC – The new graph shows what appears to be the beginning of a significant activity, these movements started at 18 UTC and are in progress, the highest value so far has been 37 Hz.
  • 9/12 17:00 UTC – After the solitary spike previously reported, the activity continued but of low entity.
  • 9/12 10:00 UTC – The new graph shows a first peak last night at 6 pm UTC which reached 28 Hz, followed by a period of relative calm until 5:30 UTC when a powerful spike reached 49 Hz.
  • 9/11 17:00 UTC – Even after previous significant activity the movements continued, but with relatively low peaks, 20 Hz, and are continuing around this magnitude.
  • 9/11 10:00 UTC – There was no actual pause after yesterday’s activity, the movements continued with a peak to 29 Hz at 20 UTC while a more powerful activity occurred from 8 UTC with two peaks above 40 Hz the strongest of which to 43 Hz at 9 UTC.
  • 9/10 17:00 UTC – Calm. The movements ended at 10 UTC.
  • 9/10 10:30 UTC – Today’s chart shows an activity similar to yesterday’s, with isolated peaks, but slightly more continuous. The movements started at 23 UTC yesterday with slight variations. The most significant peaks occurred in rapid succession from 8 UTC with the maximum value 34 Hz at 8:20 UTC.
  • 9/9 17:00 UTC – After the two peaks previously reported, another one occurred at 20 Hz at 10:30 UTC after which it was calm.
  • 9/9 11:00 UTC – A pair of isolated peaks has been the activity of today until now, the first at 7:30 UTC has reached 27 Hz, the second peak 1 hour later at 8:30 UTC has been at 37 Hz.
  • 9/8 17:00 UTC – Even today, looking at the chart, one has the feeling that the activity, in the last four days, is gradually decreasing. Today the movements lasted 6 hours, from 6 to 12 UTC, the maximum peak was 23 Hz at around 7 UTC.
  • 9/7 17:00 UTC – Today’s graph shows that in the last 3 days there has been a decline in the intensity of the activity. Today the movements started at 5 and lasted until 11:30 UTC, during this period the maximum peak was 30 Hz at 8:30 UTC.
  • 9/6 17:00 UTC – Today’s activity period lasted for about 12 hours, from 23 UTC yesterday to 11 UTC today, now the situation is calm.
  • 9/6 10:30 UTC – The activity today started at midnight UTC with small variation on the 15 Hz threshold, from 4 UTC the values increased slightly reaching 20 Hz, at 8 UTC we had the strongest peak until now that reached 44 Hz.
  • 9/5 17:00 UTC – The activity after the strong movement described earlier remained calm. The black band is due to lack of data for that time period.
  • 9/5 10:00 UTC – The TSU site had some glitches until now, the surprise update shows us a strong activity. The opening was given by an isolated peak at 55 Hz followed by a period of about 2 hours of strong movements culminating with a 67 Hz spike at at 8:30 UTC.
  • 9/4 17:00 UTC – Another spike at 27 Hz occurred during a short period of activity lasted 1 hour from 11:30 UTC.
  • 9/4 10:00 UTC – The activity continued uninterrupted even today, the most significant part up to now has started at 7 UTC and has led to a peak at 40 Hz just before 8 UTC.
  • 9/3 17:00 UTC – Even in today’s chart we can see that there wasn’t a real calm. The periods of most intense activity were two: the first from 7 to 9 UTC which reached the maximum at 20 Hz; the second from 14 to 15 UTC with the maximum at 36 Hz.
  • 9/2 17:00 UTC – The situation, after the previous peaks, is in a phase of calm.
  • 9/2 11:30 UTC – The variations continued practically without interruption even if with moderate values, at 7 UTC a more significant activity began which led to a peak at 69 Hz at 8 UTC followed by another at 40 Hz about an hour later. This period of elevated activity lasted about 2 hours.
  • 9/1 17:00 UTC – There has been no pause, although without excessive values the activity has been continuous and seems to last longer. An isolated peak at 37 Hz occurred at 12:20 UTC.
  • 9/1 09:00 UTC – Movements restarted shortly after the midnight shown on the chart, corresponding to 17 UTC. Peaks were moderate with the strongest that reached 36 Hz at 20:30 UTC. After this a period of variations started with the average value being at 20 Hz for 6 continuous hours, from 23 to 5 UTC this morning.
  • Frequency means how many wave cycle happen in a second, 1 Hz. means 1 cycle per second, 40 Hz. means 40 cycles per second, Amplitude is the size of the vibration, how big is the wave, the chart shows the frequency variation in Hz and the amplitude using the white color.

Note

The Ancient Indian Rishis called 7.83 Hz the frequency of OM. It also happens to be Mother Earth’s natural heartbeat rhythm Schumann resonances are named after professor Schumann who was involved in early German secret space program and was later paper-clipped into the United States. The frequencies of Schumann resonances are fairly stable and are mainly defined by the physical size of the ionospheric cavity.   The amplitude of Schumann resonances does change and is bigger when ionospheric plasma gets excited. Ionospheric plasma excitation happens because of solar activity, thunderstorms, use of scalar plasma weapons and HAARP and lately also when the Light forces are clearing the plasma anomaly.

Dependencies Amplitudes Schumann Resonance 31-12-2018

Dependencies of Amplitudes Schumann Resonance October 2 2019

Dependencies of Quality Schumann Resonance

Dependencies of Quality Schumann Resonance October 2 2019

Dependencies of Quality Schumann Resonance

Dependencies of Frequency Schumann Resonance October 2 2019

Schumann Resonance Differential Peaks

Read

Schumann Resonance PDF Archives

Read and Download

Images Archive

All the SR daily images in one single pageSee the Images

Web Hosting
Explanation of The Chart

The Schumann Resonance Spectrogram Chart

The Schumann Resonance Chart displays data from the magnetic field detector to monitor the resonances occurring in the plasma waves constantly circling the earth in the ionosphere. These three days spectrograms show the activity occurring at the various resonant frequencies from 1 to 40 Hz. Within the spectrogram, the power, or intensity level of each frequency is displayed as a color, with white being the most intense. The Schumann Resonances appear as the horizontal lines at 0.0, 4.0, 8.0, 12.0, 16.0, 20.0, 24.0, 28.0, 32.0, 36.0 & 40.0 Hz. This chart is based on Tomsk, Russia, time UTC +7 (UTC = Universal Time Coordinated).

What is a Spectrogram?

The Spectrogram Calendar is a visual representation of the range of frequencies in the magnetic field at a given location. Similar to how an equalizer displays the frequency content of music played on your stereo, the spectrogram calendar displays the frequency content of a magnetic field. Instead of showing a brief snapshot, it shows changes over a period of time, in this case 3 days.

The local magnetic field is a dynamic field that changes constantly because of variations in the ionosphere and sun and many other influences not yet fully understood. The range of variation displayed in the spectrogram chart is from 0 to 40 cycles per second. The vertical axis is frequency and the horizontal axis is time. The amplitude of a particular frequency at a specific time is represented by the intensity of color (green, yellow, white) of each point in the image.

Ampiezza e Periodo

What is the Schumann Resonance?

The Herathbeat of Planet EarthRead

🙂

Clicks on the Ads Keep Us Alive

Pills Disclosure News Italia

Opportunity

In the middle of difficulty lies opportunity.

Albert Einstein