Editor’s Note: No wonder I could not go to sleep last night…could you when rather intense energies were reaching our planet? Please read the article below, learn how you may be affected by the cosmic energies, and be…
InJoy!
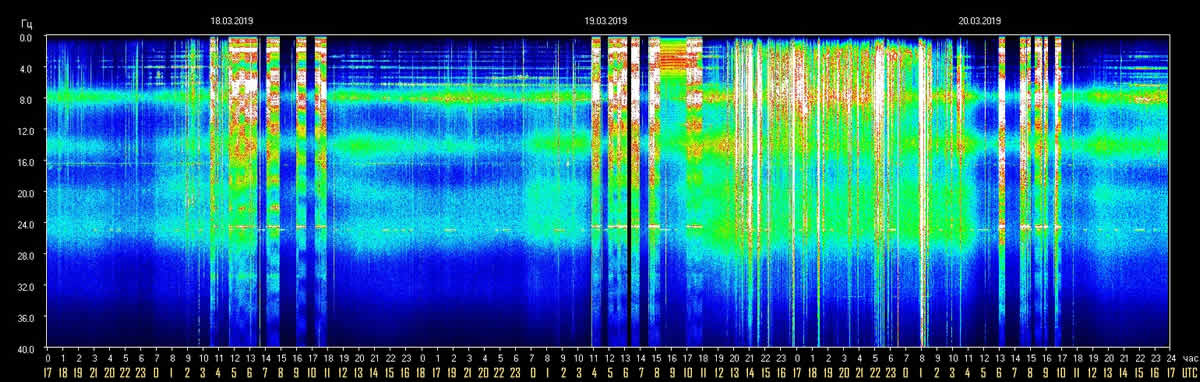
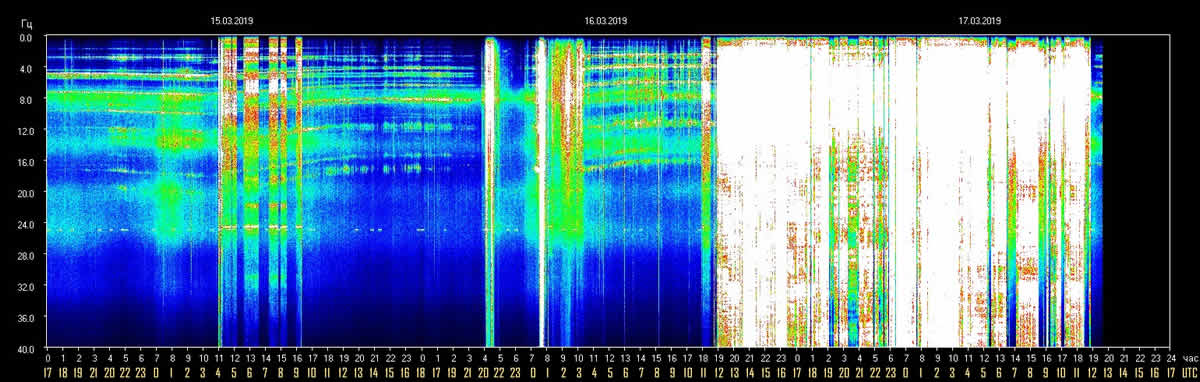
Schumann Resonance Today. We will try to keep you updated about the variations of the Resonance with this page. The great variations that nobody can explain but that give us a clear sign that the planet is changing. The Earth is vibration higher and higher, just like us! RS Base Frequency 7.83 Hz.
Schumann Resonance Today Peaks:
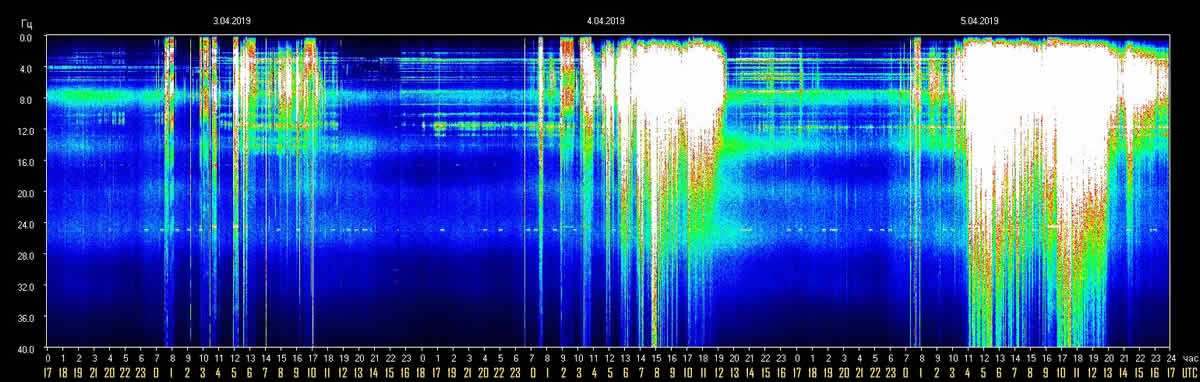
- 4/5 17:00 UTC – After the 96 Hz peak the resonance frequency amplitude slowly started to go down and in about 6 hours it returned to normal levels.
- 4/5 11:30 UTC – Increased activity, after the last update in which there seemed to be a possible drop we are instead back in the “white” with a powerful spike that reached 96 Hz at about 10:30 UTC.
- 4/5 09:00 UTC – Even today strong activity, it is not common to see so many consecutive days of great variations. We’ll see if even in April, as in March and February we will have a very strong activity on the 17th (letter Q). Today the activity started with a small “introductory” peak at 20 Hz around midnight UTC and then suddenly increased to 30 Hz at 3 UTC and 80 Hz at 5 UTC. After this peak there was a gradual decrease in the amplitude and, at 9 UTC, it is at 40 HZ.
- 4/4/ 17:00 UTC – From 11:30 UTC the gradual decrease of the activity began and reached normal values at 12:30 UTC.
- 4/4 12:00 UTC – The strong activity is continuing, after the peak at 69 Hz at 7:47 UTC the amplitude of the resonance frequency has slightly decreased but it has practically remained almost always on the 50 Hz threshold.
- 4/4 08:00 UTC – New powerful activity now underway, started with a steady increase at 00 UTC this morning with peaks at 40, 55, 65 to culminate with a strong peak at 89 Hz just before 8 UTC.
- 4/3 – Moderate activity today, the copy of yesterday but of shorter duration. The movements started at 00:30 UTC to finish shortly after 10:00 UTC, within this time frame there were several peaks at 20 Hz while the two highest peaks reached 25 Hz at 5:30 and at 10:00 UTC.
- 4/2 17:00 – After the peak reported previously, the activity continued but has been waning with an amplitude of around 15 Hz down to the current calm.
- 4/2 12:30 UTC – Even today there is a fair amount of activity going on, event though the peak above 40 Hz is still missing, there have been various movements started at 4 UTC with a maximum peak so far that has reached 28 Hz at 11 UTC.
- 4/1 – After the strong peak at the beginning of the last 24 hours the activity continued but in a moderate way, there were various peaks from 5 to 11 UTC, the highest of which reached 26 Hz at 8:50 UTC.
- We added a new chart below, we’ll try to post it daily to show the actual peaks above 40 Hz.
- Frequency means how many wave cycle happen in a second, 1 Hz. means 1 cycle per second, 40 Hz. means 40 cycles per second, Amplitude is the size of the vibration, how big is the wave, the chart shows the frequency variation in Hz and the amplitude using the white color.
The Chart time is based on Tomsk – Russia – UTC +7 Source
Note
The Ancient Indian Rishis called 7.83 Hz the frequency of OM. It also happens to be Mother Earth’s natural heartbeat rhythm Schumann resonances are named after professor Schumann who was involved in early German secret space program and was later paper-clipped into the United States. The frequencies of Schumann resonances are fairly stable and are mainly defined by the physical size of the ionospheric cavity. The amplitude of Schumann resonances does change and is bigger when ionospheric plasma gets excited. Ionospheric plasma excitation happens because of solar activity, thunderstorms, use of scalar plasma weapons and HAARP and lately also when the Light forces are clearing the plasma anomaly.
MARCH 2019
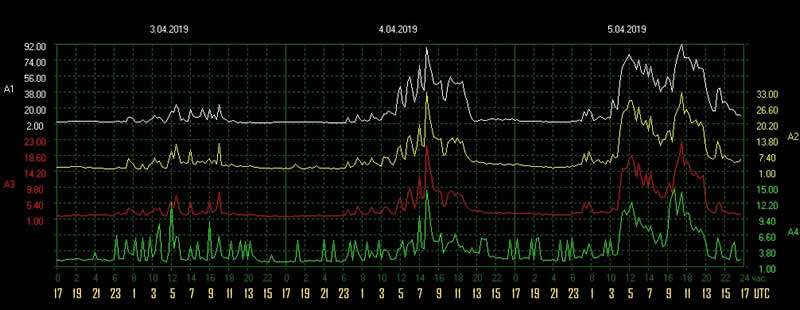
Dependencies Amplitudes Schumann Resonance April 5 2019
Schumann Resonance Differential Peaks
Schumann Resonance PDF Archives
Images Archive
All the SR daily images in one single pageSee the Images

Explanation of The Chart
What is the Schumann Resonance?The Hearthbeat of Planet EarthRead

Clicks on the Ads Keep Us Alive

Dark and Light
We can easily forgive a child who is afraid of the dark; the real tragedy of life is when men are afraid of the light.
Plato