Editor’s Note: It appears many “signs and synchronicities” are pointing to great spiritual for humanity from NOW through Jan 12, 2020. My thought is that the dates given are important milestones, but these re merely markers for our on-going journey.
So…please read this article, know all of humanity is headed toward the same place, our “lessons” have been merely opportunities for soul growth, and BE…
Prepare for a Solar Plexus activation bigger and more impactful than
we have ever experienced on this planet in known ‘history’ when Uluru gets
fully activated and switched on by the local indigenous custodians (The
Anungu people) and supporting visitors from 26th October for 5 days
after being able to climb it has been closed to the public.
According to Senior Star Lore Elder, precious Grandmother and
custodian of Uluru, Auntie Nelly Patterson, this is the time for the
Tjukurpa Pulka, the Creation Lore, Creation Time Dreaming and the New
Way Dreaming.
This powerful activation will also mean that there will be a Blast of
Divine Light and Activational Energy sent through the songlines of the
planet, connecting all of the Earth Chakras together. Especially one of
the major energetic arteries and songlines, The Rainbow Serpent
(representing Divine Feminine Energy to many).
According to Robert Coon, the line starts from Uluru (Solar Plexus)
and travels through Bali (World Purification Centre), to Glastonbury
(Heart & Third Eye Chakras), to Lake Titicaca (Sacral Chakra) and
then back around and through to Uluru.
This is all in preparation for the Saturn, Pluto, Mercury, Sun
quadruple conjunction in Sag (13 Star Sign Astrology) on 12 Jan 2020,
which will be the energetic completion of an ancient ceremony
(Ngaltawaddi) connected to Uluru that was interrupted a long time ago.
According to Coon ‘the great Ngaltawaddi cord was constructed between
Uluru and the Sun.’ This will culminate in the reactivation of the
Solar Umbillical Cord of planet Earth with the Sun and the Great Central
Sun on 12 Jan 2020.
An ideal event for creating an archetypal communicative link between
the Sun and the Earth. A re-establishment of the connection between
Heaven and Earth, so that we can physically manifest and experience
HEAVEN ON EARTH and fully embrace the Golden Age.
According to Coon, between Now and 12 Jan 2020 the ‘cord can be
strengthened through Meditations and Creative acts for anyone who works
at Uluru for this purpose’.
And I am performing these regularly here in Glastonbury to strengthen
the connection between the Heart, Third Eye and Solar Plexus Chakras
along the Rainbow Serpent songline.
Game on. . . Bring on the Activations!
~ Katharine Kinnie
shared with LOVE
Pars Kutay
~ ~
Share this: Send the word out using these buttons!
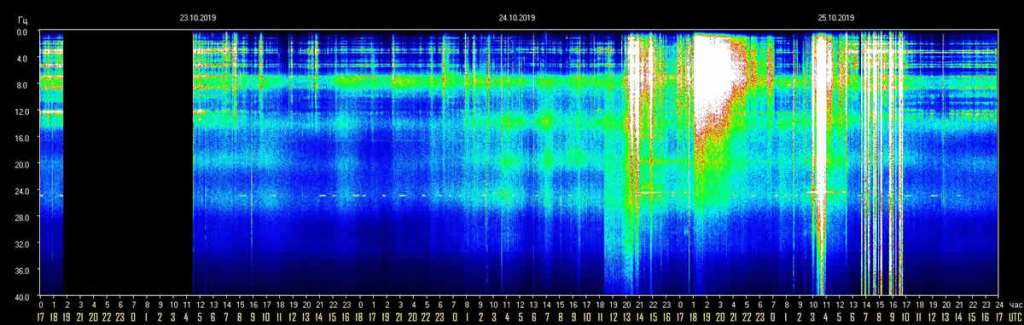
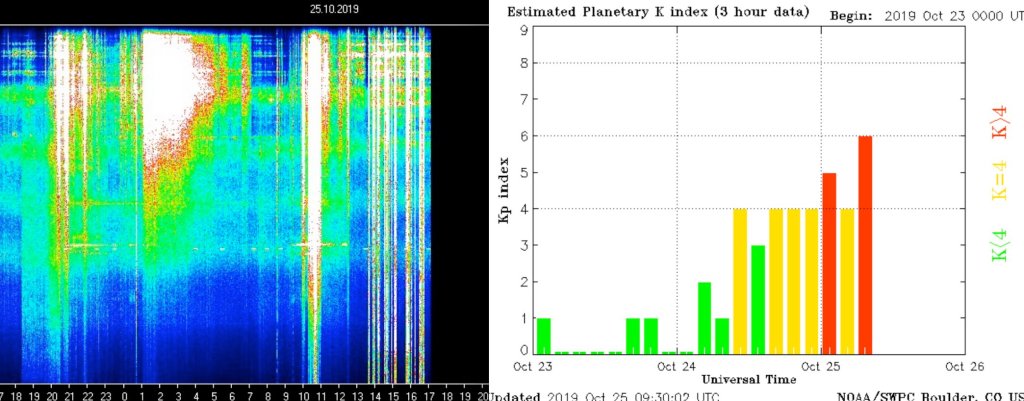
Editor’s Note: This is a repeat of yesterday’s graph with just a few more hours added in. We can clearly see almost 20 hours of activity which were of significant amplitude and strength. This mirrors the solar storm hitting Earth, so we know that solar activity can be a cause for the Earth to release Schumann Resonance energies.
From the graphs shown below the traditional Schumann Resonance chart, we can see a graph from Spaceweather showing the correlation between the S.R. energies and the magnetic energy levels reaching Earth from a solar wind stream. This is responsible for changing our DNA…and our hearts!
Please view this chart, correlate your emotional state to this graph, and BE…
Schumann Resonance Today. We will
try to keep you updated about the variations of the Resonance with this
page. The great variations that nobody can explain but that give us a
clear sign that the planet is changing. The Earth is vibration higher
and higher, just like us!
The Chart time is based on Tomsk – Russia – UTC (Universal Time Coordinated) +7Source
RS Base Frequency 7.83 Hz.
Schumann Resonance Today Peaks:
10/25 17:00 UTC – From 10 UTC the situation is calm.
10/25 11:00
UTC – Today the activity is completely on another level compared to the
last days. The series of movements in progress began yesterday at 13
UTC on the 25 Hz level, a few hours later, at 18 UTC it approached 30
and after a period of moderate fluctuations it reached its maximum peak
so far, 58 at 3:30 UTC. After this strong movement we see a series of
minor peaks on the 25 threshold. AUGUST Interactive PDF Archive
10/24 17:00 UTC – A bit of movement returned from 13 to 15 UTC with
two peaks that exceeded 20, the first at 24 and the second at 22. For
the rest of the day it was calm.
10/23 17:00 UTC – The sort of ‘vibration’ that we noticed yesterday
is perceived to have continued until the morning of today, unfortunately
it reached its maximum during the arc in which the data were not
recorded, the peak is shown at 10 Hz during the descent of the amplitude
towards normal values apparently started at 4 UTC.
10/22 17:00 UTC – In today’s amplitude graph we can see a very
slight and constantly increasing variation that began on the night
between 20 and 21 October, it seems a sort of increasing vibration, as
it is an amplitude it could be compared to an Om which from nothing
increases, little by little but constantly. Now we are around Power 8.
10/21 17:00 UTC – Another day of light activity, the only
significant movement reached 11 at 11 chart local time, corresponding to
4 UTC.
10/20 17:00 UTC – Very light activity, Power 10.
10/20 10:00 UTC – Not much to report, the most relevant movement reached an amplitude of Power 16 just before 9 am UTC.
10/19 17:00 UTC – Calm.
10/18 17:00 UTC – The only significant activity of today has been reported previously, we are now in a situation of calm.
10/18 10:00 UTC – A light activity continued after the previous
series of peaks, the average has been around Power 20 from 18 to 22 UTC.
Is seems the functionality on the TSU is still not fully recovered.
10/17 17:00 UTC – In the part of the graph available for today we
note 3 peaks one of Power 53, reported previously, the second of Power
57 at 10:15 UTC and the last minor at 25 at 12:40 UTC.
10/17 08:30 UTC – From 6 UTC the data are available again and, like
every self-respecting 17 in this last period, even today we have our
peak with a power of 53 at 7:20 UTC. We hope that the problem has been
solved and we can return to a normal flow of data.
10/16 17:00 UTC – Still frozen at yesterday’s image, other sources report peaks for today at 20.
10/15 17:00 UTC – Pitch black.
10/15 10:00 UTC – This is the little we have for the last few days,
lack of data. Other stations with different measurement report calm.
10/14 17:00 UTC – For the little we can see the situation remained calm.
10/14 09:30 UTC – The TSU site is back live but the interruption
data is not available as seen from the large blank space in the chart.
Looking for information on the web it seems that during this “void”
period the situation remained almost calm. Currently we see very light
movements at about 10 Hz.
10/13 22:00 UTC – TSU website still down.
10/12 17:00 UTC – TSU website is down, we will post an update as soon as it will return live.
10/11 17:00 UTC – After several days of calm, from yesterday at 7:30
UTC, we are seeing a medium activity which, despite being
uninterrupted, generated peaks of average amplitude. From 12 UTC today, a
period of more significant movements began which reached the maximum
peak at 59 Hz shortly after 15 UTC.
10/10 17:00 UTC – Today the activity has returned more significantly
since 1 UTC. The first significant variation started at 7:30 UTC and
within few hours reached the maximum of 42 Hz at 9:45 UTC. The movements
are continuing.
10/9 17:00 UTC – The light activity continues, the peak of today has
reached 13 Hz shortly after 9 UTC. A black vertical line is visible in
the chart, it’s due to missing data.
10/8 17:00 UTC – Almost calm, maximum 13 Hz at 10 UTC.
10/7 17:00 UTC – Even today very light activity, the maximum of 17
Hz was reached shortly after 4 UTC. This slight activity however lasted
from midnight to 15 UTC.
10/6 17:00 UTC – Calm.
10/5 17:00 UTC – Calm.
10/4 17:00 UTC – Practically calm, peak at 13 Hz at 11 UTC.
10/3 17:00 UTC – The pattern of slight daily increase, seems to be
underway again, the activity saw a first isolated peak at 1 UTC which
reached 17 CC and later, during a more relevant phase, 22 CC at 6:30
UTC.
10/2 17:00 UTC – Slight activity limited to a period of about 10 hours, from 1 to 11 UTC, the maximum peak at 9 to 14 CC.
10/1 17:00 UTC – Very light activity during the central part of the day, the only significant peak reached 26 Hz at 4 UTC.
Frequency means how many wave cycle happen in a second, 1
Hz. means 1 cycle per second, 40 Hz. means 40 cycles per second,
Amplitude is the size of the vibration, how big is the wave, the chart
shows the frequency variation in Hz and the amplitude using the white
color.
Note
The Ancient Indian Rishis called 7.83 Hz the frequency of OM. It also happens to be Mother Earth’s natural heartbeat rhythm
Schumann resonances are named after professor
Schumann who was involved in early German secret space program and was
later paper-clipped into the United States. The frequencies of Schumann resonances are fairly stable and are mainly defined by the physical size of the ionospheric cavity.
The amplitude of Schumann resonances does
change and is bigger when ionospheric plasma gets excited. Ionospheric
plasma excitation happens because of solar activity, thunderstorms, use
of scalar plasma weapons and HAARP and lately also when the Light forces
are clearing the plasma anomaly.
Dependencies of Amplitudes Schumann Resonance October 25 2019
Dependencies of Quality Schumann Resonance October 25 2019
Dependencies of Frequency Schumann Resonance October 25 2019
All the SR daily images in one single pageSee the Images
Explanation of The Chart
The Schumann Resonance Spectrogram Chart
The Schumann Resonance Chart displays data from the magnetic field
detector to monitor the resonances occurring in the plasma waves
constantly circling the earth in the ionosphere. These three days
spectrograms show the activity occurring at the various resonant
frequencies from 1 to 40 Hz. Within the spectrogram, the power, or
intensity level of each frequency is displayed as a color, with white
being the most intense. The Schumann Resonances appear as the horizontal
lines at 0.0, 4.0, 8.0, 12.0, 16.0, 20.0, 24.0, 28.0, 32.0, 36.0 &
40.0 Hz. This chart is based on Tomsk, Russia, time UTC +7 (UTC =
Universal Time Coordinated).
What is a Spectrogram?
The Spectrogram Calendar is a visual representation of the range of
frequencies in the magnetic field at a given location. Similar to how an
equalizer displays the frequency content of music played on your
stereo, the spectrogram calendar displays the frequency content of a
magnetic field. Instead of showing a brief snapshot, it shows changes
over a period of time, in this case 3 days.
The local magnetic field is a dynamic field that changes constantly
because of variations in the ionosphere and sun and many other
influences not yet fully understood. The range of variation displayed in
the spectrogram chart is from 0 to 40 cycles per second. The vertical
axis is frequency and the horizontal axis is time. The amplitude of a
particular frequency at a specific time is represented by the intensity
of color (green, yellow, white) of each point in the image.
EU Commission agree in principle on Brexit extension, but no date set yet.
UK PM Johnson had to ask the EU to extend the UK exit deadline until the end of January, 2020.
A serviceman of the repair and maintenance base in the Chita Region, Russia, shot dead eight soldiers.
Dutch Central Bank: “if the system collapses, the gold stock can serve as a basis to build it up again.”
Third largest US coal mine closes as new owner struggles with bonding.
Greek Researchers, after 25 years of studies, reveal what caused Alexander the Great’s death, pancreatic necrosis.
Soros pumped more cash into lobbying since Trump Took office than under Bush and Obama combined.
Worrisome connection between the Vatican and Link Campus,
Monsignor Paglia resign from Link Campus. Link Campus is where Mifsud
was a Professor at.
Cindy McCain is wearing a boot now?
The DOJ’s Russiagate probe just turned into a criminal investigation.
QAnon Godfather III: Reports have emerged of movement of Vatican
money through slush funds across Europe and a Vatican investment of more
than $250 million into luxury London apartments.
The White House is reportedly beginning to prepare to formally withdraw the U.S. from the Paris Climate Accord.
US Justice Department in recent weeks has started publishing documents related to the Trump-Russia probe, including Fusion GPS,
Christopher Steele, Bruce Ohr, and Peter Strzok.
Last weekend, no one was shot in NYC for the fist time since 1993!
Strongest EQ in Europe M4.6 Italia Strongest EQ in US M3.4 Alaska Strongest EQ on the Planet M5.0 Vanuatu Deepest EQ M4.9 545 km Indonesia
News Burst 26 October 2019
Share this: Send the word out using these buttons!