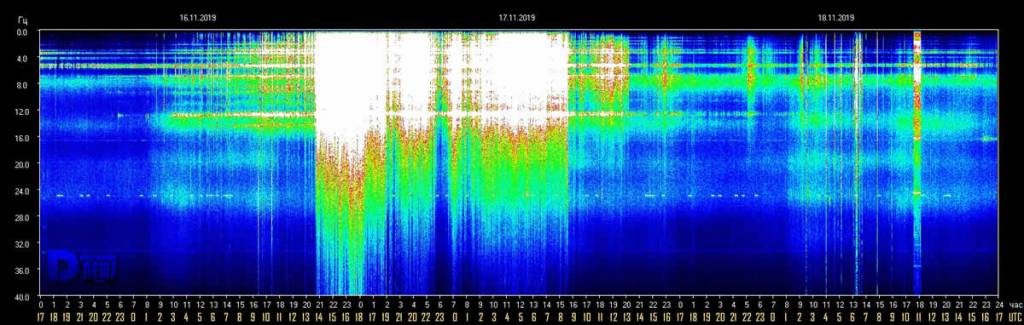
Editor’s Note: The graph above shows Schumann Resonance activity through noon of 11/18. Energies released by Mother Earth were sporadic with a few bouts of high amplitude, low density episodes at 1:30am and 5:30 am on 11/18 (EST USA).
Correlate times of Schumann Resonance with your own feelings and physiology, know humanity and the Earth are changing, and BE…
InJoy!
_______________________________________________________________________________________________
16
Schumann Resonance Today. We will try to keep you updated about the variations of the Resonance with this page. The great variations that nobody can explain but that give us a clear sign that the planet is changing. The Earth is vibration higher and higher, just like us!
The Chart time is based on Tomsk – Russia – UTC (Universal Time Coordinated) +7 Source
RS Base Frequency 7.83 Hz.
Schumann Resonance Today Peaks:
- 11/18 17:00 UTC – Today we returned to a condition of very light activity, there were only two movements that exceeded Power 10, 16 at 6 UTC and 11 at 11 UTC.
- 11/17 17:00 UTC – The strong activity, that seems to have ended at 9 UTC today, lasted 20 hours. The highest peaks occurred in its initial part which took place yesterday, today the highest value was Power 30 as previously reported.
- 11/17 09:00 UTC – Today is the 17th, lately a day of recurring SR activity, and the movements started yesterday continued uninterrupted, the peaks are not at very high values, Power 37 was reached at 00 UTC today, but the values remained constantly around Power 30.
- 11/16 23:00 UTC – The strong activity continued but with slightly less intensity, this period of strong variations started at 6 UTC and has been above Power 40 for 2 hours, from 15 to 17 UTC. At this time the maximum values are around Power 30.
- 11/16 17:00 UTC – Today’s chart shows an initial long period of flat calm until 1 UTC when very light movements have brought the variations to reach Power 10 at 9 UTC. From here the movements started to become more consistent up to starting a strong activity period from 13 UTC during which the today’s maximum value of Power 46 was reached. It seems that the movements should also continue in the new chart of Nov. 17th.
- 11/15 17:00 UTC – The movements continued and grew steadily until 10 UTC when it reached today’s high at Power 22 to returned to normal values just after.
- 11/15 09:00 UTC – Shortly after midnight local time from the graph, corresponding to 17 UTC, we saw a slow and gradual increase in amplitude values that reached Power 17 at 8 UTC. It seems that the activity should continue.
- 11/14 17:00 UTC – Virtually calm, only a few slight movements between 3 and 5 UTC with a maximum of Power 13.
- 11/13 17:00 UTC – Calm.
- 11/13 15:00 UTC – The first part of today’s chart day shows absolute calm, from 1 UTC there are very light movements that have given way to the light activity of today that lasted for the central part of today’s chart. During this phase there were 3 peaks that exceeded 20 and others that touched it, Power 24 was reached at around 6 UTC.
- 11/12 17:00 UTC – Today’s activity took place over a period of 9 hours, from 3 to 12 UTC, the most intense part with the maximum value of today as reported previously was from 5 to 8 UTC. The situation is now shown to be calm.
- 11/12 08:00 UTC – After several days of intense calm we come to a new series of movements characterized by rather significant peaks. The changes started suddenly at 3 UTC and in the span of four hours, at 7 UTC, there was the strongest peak so far at Power 48.
- 11/11 17:00 UTC – Today was mostly calm, the only variations with a maximum of Power 14 occurred from 7:30 to 9:30 UTC.
- 11/10 17:00 UTC – Calm.
- 11/10 11:00 UTC – Not much to say, compared to the calm we see only the “streaks” on the Power 10.
- 11/9 17:00 UTC – The series of light movements continued without interruption, a slight drop to values close to calm took place in the last hours.
- 11/9 11:30 UTC – In this first part of the day the movements continued, increasing numerically but with less powerful amplitude variations whose maximum was Power 25 at 2:30 UTC.
- 11/8 17:00 UTC – The series of most significant movements of today lasted about eight hours, from 3 to 11 UTC with the peaks previously reported, this period has been followed by more slight movements.
- 11/8 10:30 UTC – From today’s image, we can see how in the last three days there has been a sort of sequence of movements characterized by a constant increasing trend, will this coincidentally reach its maximum on 11 November? The significant peaks of today started at 3, at 6 UTC reached 35 and just before 10 the maximum value of these last 3 days, Power 43.
- 11/7 17:00 UTC – Slight movements have continued throughout the day, the highest peak is the one reported previously but shortly after 9 UTC we can see another variation that has reached Power 27.
- 11/7 09:00 UTC – The graph in the first part of today shows how the constant slight movement that began yesterday is continuing. Today we have had the strongest peak of these last 3 days and reached Power 32 at 3 UTC.
- 11/6 17:00 UTC – After a couple of days of relative calm today, shortly after midnight UTC, movements began again which gradually brought the current peak value of Power 23 to 9:30 UTC. Activity has not stopped but has continued and at present it seems to see a crescendo that will lead to higher values.
- 11/5 17:00 UTC – Today’s activity is very similar to that of yesterday, slight movements from 1 to 8 UTC with the maximum value reached of Power 12.
- 11/4 17:00 UTC – Today the calm has been almost total, very slight variations have reached Power 15 between 6 and 10 UTC.
- 11/3 17:00 UTC – During the last 24 hours reported in the chart there were only 3 significant short-term events, the first happened at 19 UTC of yesterday at Power 25, the second movement, which lasted about 2 hours, reached today’s maximum of Power 32 at 6:30 UTC and the last at 10 UTC at 23.
- 11/2 17:00 UTC – We could recap today activity with how long the amplitude remained above 40: 6 hours, from 3 to 9 UTC. Today’s maximum is Power 98 as previously reported. From 11 UTC the values are back to normal.
- 11/2 09:30 UTC – The strong activity that we see in progress at this time started decisively at the turn of the local midnight, corresponding to 17 UTC. Initially with peaks at Power 20, within two hours it reached 30 around 19 UTC. These first movements were followed by a period during which the amplitude was constantly oscillating between 10 and 20. At 1 UTC today, the very powerful activity began, bringing the amplitude close to Power 100. The maximum of Power 98 was reached at 5:30 UTC.
- 11/1 17:00 UTC – The situation shows the continuation of the variations also in this second part of the day where the greatest peak of today was had at Power 21.
- 11/1 12:30 UTC – The new chart shows slight movements around midnight UTC that have reached Power 18, for the rest just ‘background’ movements around 10.
Frequency means how many wave cycle happen in a second, 1 Hz. means 1 cycle per second, 40 Hz. means 40 cycles per second, Amplitude is the size of the vibration, how big is the wave, the chart shows the frequency variation in Hz and the amplitude using the white color.
Note
The Ancient Indian Rishis called 7.83 Hz the frequency of OM. It also happens to be Mother Earth’s natural heartbeat rhythm Schumann resonances are named after professor Schumann who was involved in early German secret space program and was later paper-clipped into the United States. The frequencies of Schumann resonances are fairly stable and are mainly defined by the physical size of the ionospheric cavity. The amplitude of Schumann resonances does change and is bigger when ionospheric plasma gets excited. Ionospheric plasma excitation happens because of solar activity, thunderstorms, use of scalar plasma weapons and HAARP and lately also when the Light forces are clearing the plasma anomaly.

Dependencies of Amplitudes Schumann Resonance November 18 2019

Dependencies of Quality Schumann Resonance Novembre 18 2019

Dependencies of Frequency Schumann Resonance November 18 2019
Schumann Resonance Differential Peaks
Schumann Resonance PDF Archives
Images Archive
All the SR daily images in one single pageSee the Images

Explanation of The Chart
The Schumann Resonance Spectrogram Chart
The Schumann Resonance Chart displays data from the magnetic field detector to monitor the resonances occurring in the plasma waves constantly circling the earth in the ionosphere. These three days spectrograms show the activity occurring at the various resonant frequencies from 1 to 40 Hz. Within the spectrogram, the power, or intensity level of each frequency is displayed as a color, with white being the most intense. The Schumann Resonances appear as the horizontal lines at 0.0, 4.0, 8.0, 12.0, 16.0, 20.0, 24.0, 28.0, 32.0, 36.0 & 40.0 Hz. This chart is based on Tomsk, Russia, time UTC +7 (UTC = Universal Time Coordinated).
What is a Spectrogram?
The Spectrogram Calendar is a visual representation of the range of frequencies in the magnetic field at a given location. Similar to how an equalizer displays the frequency content of music played on your stereo, the spectrogram calendar displays the frequency content of a magnetic field. Instead of showing a brief snapshot, it shows changes over a period of time, in this case 3 days.
The local magnetic field is a dynamic field that changes constantly because of variations in the ionosphere and sun and many other influences not yet fully understood. The range of variation displayed in the spectrogram chart is from 0 to 40 cycles per second. The vertical axis is frequency and the horizontal axis is time. The amplitude of a particular frequency at a specific time is represented by the intensity of color (green, yellow, white) of each point in the image.

What is the Schumann Resonance?
The Herathbeat of Planet EarthRead

Clicks on the Ads Keep Us Alive

Dream
When we are awake, we sleep. When we sleep, we dream. When we dream, we live.
Carl Gustav Jung