Schumann Resonance Today – Update ~ January 7, 2020


Editor’s Note: All appears calm on the Schumann Resonance graph, but but other energies are definitely out there swirling around in a storm of Love! Please keep your eyes on this graph, your hearts open to Love, and BE…

InJoy!

___________________________________________________________________________________________

15

Schumann Resonance Today. We will try to keep you updated about the variations of the Resonance with this page. The great variations that nobody can explain but that give us a clear sign that the planet is changing. The Earth is vibration higher and higher, just like us!

The Chart time is based on Tomsk – Russia – UTC (Universal Time Coordinated) +7 Source

RS Base Frequency 7.83 Hz.

Schumann Resonance Today Peaks:

Tell Us What You Feel!

  • 1/7 17:00 UTC – Today’s chart shows a period of around 18 hours of flat calm, very few swings, it started at 8 am UTC yesterday and ended at 2 am UTC this morning. After this ‘silence’ some light background movements started, Power 15 was today’s maximum at 7 UTC.
  • 1/6 17:00 UTC – Total Calm.
  • 1/5 17:00 UTC – Calm.
  • 1/5 8:00 UTC – Today, together with the second part of yesterday, was characterized by fairly powerful but isolated peaks; two have occurred, the first at Power 21 took place at 00 UTC, the second, much more powerful, reached Power 48 at 4:45 UTC.
  • 1/4 17:00 UTC – Today the activity has almost been continuous, in the first part of the day shown on the graph the amplitude peaked around 15 while in the second half the variations were more sporadic but reached the peak of Power 43 at 13:40 UTC. The situation is now calm.
  • 1/4 8:00 UTC – After the not so uncommon data blackout, but peculiar for it’s duration, the restored flow shows a light activity that topped several times between Power 13 and 15, maximum for now was at 6 UTC.
  • 1/3 17:00 UTC – Calm until the end of the chart when some variations seems about to start.
  • 1/3 10:00 UTC – We are back to normal operations after the data blackout which lasted approximately 17 hours. The first available data show a calm situation.
  • 1/2 18:00 UTC – The publication of the new data stopped at 16 local time in Tomsk, corresponding to 9 UTC. So far the darkening has lasted 9 hours.
  • 1/2 15:30 UTC – The activity continued in a very moderate way throughout the day, the maximum at about power 14 has been temporarily reached at 1 and 6 UTC.
  • 1/1 17:00 UTC – The second part of today’s graph shows a marked increase in activity even if the peaks have remained relatively low. The movements started at 12 UTC and lasted until 17, the highest peak was at Power 25.
  • 1/1 11:00 UTC – Today, like yesterday, it seems a calm day, the maximum values once again reached Power 10 momentarily around 6 am UTC.
  • 12/31 17:00 UTC – Calm.
  • 12/31 11:30 UTC – Calm.
  • 12/30 17:00 UTC – Calm.
  • 12/30 10:00 UTC – After yesterday’s very strong activity, the situation remained calm for about 9 hours until about 21 UTC (yesterday), when new moderate movements began which lasted almost 4 hours until 1:30 UTC. During this period the maximum amplitude value reached has been Power 30.
  • 12/29 17:00 UTC – Today’s activity lasted 13 hours, from 23 (yesterday) to 12 UTC (today), the average was about Power 70 and only once, briefly for about 15 minutes around 8 UTC, the amplitude went below Power 40. Graphically it looks like a column of light.
  • 12/29 13:30 UTC – In the second part of the day shown in the graph it is highlighted how the intensity of the variations has remained substantially unchanged and has generated the strongest peak of the day at Power 93. It seems that, suddenly as they started, the movements have rapidly dropped to normal values at 12 UTC.
  • 12/29 09:00 UTC – The situation changed suddenly at 23 UTC when a series of movements began and led the amplitude values to reach Power 72 at 7 UTC, from that moment onward the amplitude remained on values between Power 65 and Power 80 with the peak maximum at Power 82 at 1:30 and 2 UTC.
  • 12/28 17:00 UTC – Calm.
  • 12/27 17:00 UTC – Calm.
  • 12/27 13:30 UTC – What appears to be all of today’s activity took place in four hours, from 4 to 8 UTC. During this period there were 4 peaks, each stronger than the previous one, and the last one at 7:30 UTC at Power 38 was the strongest.
  • 12/26 17:00 UTC – Calm.
  • 12/25 17:00 UTC – The activity seems to be in slight and constant decline, today two slight peaks, the first at Power 18 at 3 UTC, the second at Power 12 at 12: 30 UTC.
  • 12/24 17:00 UTC – Today’s activity lasted for about eight hours, from 2 to 10 UTC, the highest values occurred between 6 and 7: 30 UTC and reached Power 27.
  • 12/23 17:00 UTC – Power 34 isolated at 10:30 UTC was all the activity for today.
  • 12/22 17:00 UTC – Today we could say that total calm lasted only 4 hours, from 5 to 9 UTC, the variations for the rest of time were not significant, apart from those previously reported.
  • 12/22 09:30 UTC – After several days of almost absolute calm, yesterday’s evening UTC time we had about 4 hours of significant activity, from 15 to 19 UTC. During this period the amplitude values remained for most of the time above Power 30 with the maximum at Power 37 at 18:30 UTC.
  • 12/21 17:00 UTC – A slight activity began today in the last hours shown in the graph, the first change in amplitude occurred just before 5 UTC at Power 18 followed by minor variations. Shortly after 15 UTC the movements became more intense with first Power 31 and then the maximum of today’s chart at Power 35 just before 17 UTC.
  • 12/20 17:00 UTC – Today it was still calm, the little variations seen in the graph reached Power 11.
  • 12/19 17:00 UTC – Calm.
  • 12/18 17:00 UTC – Technically we had an event that stands out as often happens lately on the 17th of the month, a peak at Power 17 on December 17th at 19 UTC (corresponding to today’s 2 am on the chart). For the rest, still calm.
  • 12/17 17:00 UTC – Calm, many consecutive days of complete cam are not common.
  • 12/16 17:00 UTC – Calm.
  • 12/15 17:00 UTC – Another calm day, just a wriggle at 3 UTC that reached Power 15.
  • 12/14 17:00 UTC – Calm.
  • 12/13 17:00 UTC – Calm.
  • 12/13 11:00 UTC – Significant activity even today and as in the last few days consisted mainly in isolated peaks. Those of today were 2, very strong, the first at 6 UTC reached Power 60, the second shortly after at 6:40 UTC reached Power 51.
  • 12/12 17:00 UTC – Calm.
  • 12/12 14:00 UTC – There we have it, the Coincidence 17 again today, the Amplitude has reached Power 74 between 16 and 17 on the chart. corresponding to 9-10 UTC. In this case we could start thinking about how many times it must happen before it becomes impossible…
  • 12/12 07:30 UTC – It is clearly a time of pillars, even today we had 30 very intense minutes; from 6 to 6:30 UTC there was the first movement with the amplitude values that reached Power 63 shortly after 6 UTC.
  • 12/11 17:00 UTC – Calm continued.
  • 12/10 17:00 UTC – After the umpteenth “Coincidence 17” it has been calm.
  • 12/10 11:30 UTC – Powerful activity once more, even if limited in time. It was calm until just after 3 UTC when a first isolated peak reached Power 54. From 5:30 to 6:30 it was the most intense part with the maximum value at Power 67. The last peak so far is was reached near 17 h on the chart, 10 UTC, and was at P50.
  • 12/9 17:00 UTC – The short but intense period of activity was all for today.
  • 12/9 11:30 UTC – It is no surprise that today this strong peak occurred and reached Power 74, it would have been a surprise if it had been a calm day. This strong series of movements lasted about 50 minutes, from 8:40 to 9:40 UTC, at 9:15 the maximum value.
  • 12/8 17:00 UTC – Calm.
  • 12/8 11:30 UTC – The situation today shows total calm until around 10 UTC when very slight variations in Amplitude started.
  • 12/7 17:00 UTC – Much of today’s activity has been concentrated in the first part of the UTC day, from midnight until 6, where maximum values have been reached. Other slight sporadic variations at P15 also occurred at 10: 30 UTC.
  • 12/7 09:00 UTC – After the record high of yesterday the variations continued sporadically at lower levels, the maximums were around Power 15. From midnight UTC a very active phase started again which kept the Amplitude above Power 50 for about 4 hours, from 1 to 5 UTC; during this period the maximum value achieved was Power 64.
  • 12/6 17:00 UTC – After the incredible Amplitude spike at Power 158 other strong movements continued, the period of activity in which the Amplitude has been above 100 lasted about 1 hour, from 7:45 am to 8:45 UTC. At 10:30 UTC there was a further flicker at Power 28, after which a slight background activity continues.
  • 12/6 10:30 UTC – The today’s graph began in a condition of general calm until 3 am UTC when the variations started. Immediately they reached Power 32 at 4 UTC; the movements continued with less magnitude until 7:45 UTC when some impressive movements started and reached Power 100 in around 15 minutes, at 8 UTC. This, despite the already impressive value, is still not the maximum for today, at 8:30 am the amplitude has further increased and reached an incredible Power 158, the most powerful peak of the last 2 years! In addition to the main and the amplitude graphs, the massive variation can also be seen in the other two charts, the Quality, which shows a value of 25, and that of the frequency of the SR, which shows a value of 8.80.
  • 12/5 17:00 UTC – Calm.
  • 12/4 17:00 UTC – Yesterday we saw a single peak, today the activity was very similar, 2 peaks, one at Power 23 at 21:30 UTC yesterday and another today at Power 19 this morning at 1:30 UTC. For the rest of the day it was calm.
  • 12/3 17:00 UTC – Total calm, the only wriggle at 7 UTC reached Power 13.
  • 12/2 17:00 UTC – Today the activity was not long lasting but very intense, in addition to the previous peak, which marked the beginning of the active period at 8:30 UTC, after a while, at 9 UTC, there was the maximum of today at Power 55, this was followed shortly after by a further movement on the 30s after which, from 10 UTC, the calm returned. Still, another movement around 17 hours of the graph.
  • 12/2 09:30 UTC – Today’s chart shows once again a stato of calm, the last significant peak at Power 20 was Nov. 30 at 19 UTC so it took about 36 hours before the amplitude values returned above P10. Today, however, it’s back, the peak was at Power 37 8:30 UTC.
  • 12/1 17:00 UTC – A single peak isolated at Power 25 in the first part of today’s chart and then calm.

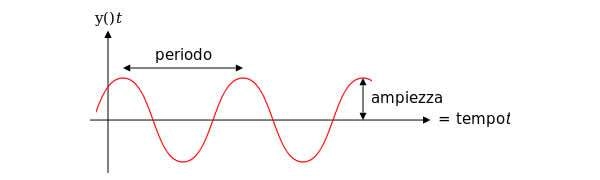
Frequency means how many wave cycle happen in a second, 1 Hz. means 1 cycle per second, 40 Hz. means 40 cycles per second, Amplitude is the size of the vibration, how big is the wave, the chart shows the frequency variation in Hz and the amplitude using the white color.

Note

The Ancient Indian Rishis called 7.83 Hz the frequency of OM. It also happens to be Mother Earth’s natural heartbeat rhythmSchumann resonances are named after professor Schumann who was involved in early German secret space program and was later paper-clipped into the United States. The frequencies of Schumann resonances are fairly stable and are mainly defined by the physical size of the ionospheric cavity.   The amplitude of Schumann resonances does change and is bigger when ionospheric plasma gets excited. Ionospheric plasma excitation happens because of solar activity, thunderstorms, use of scalar plasma weapons and HAARP and lately also when the Light forces are clearing the plasma anomaly.

Dependencies Amplitudes Schumann Resonance 31-12-2018

Dependencies of Amplitudes Schumann Resonance January 7 2020

Dependencies of Quality Schumann Resonance

Dependencies of Quality Schumann Resonance January 7 2019

Dependencies of Quality Schumann Resonance

Dependencies of Frequency Schumann Resonance January 7 2019

Schumann Resonance Differential Peaks

Read

Schumann Resonance PDF Archives

Read and Download

Images Archive

All the SR daily images in one single pageSee the Images

Web Hosting
Explanation of The Chart

The Schumann Resonance Spectrogram Chart

The Schumann Resonance Chart displays data from the magnetic field detector to monitor the resonances occurring in the plasma waves constantly circling the earth in the ionosphere. These three days spectrograms show the activity occurring at the various resonant frequencies from 1 to 40 Hz. Within the spectrogram, the power, or intensity level of each frequency is displayed as a color, with white being the most intense. The Schumann Resonances appear as the horizontal lines at 0.0, 4.0, 8.0, 12.0, 16.0, 20.0, 24.0, 28.0, 32.0, 36.0 & 40.0 Hz. This chart is based on Tomsk, Russia, time UTC +7 (UTC = Universal Time Coordinated).

What is a Spectrogram?

The Spectrogram Calendar is a visual representation of the range of frequencies in the magnetic field at a given location. Similar to how an equalizer displays the frequency content of music played on your stereo, the spectrogram calendar displays the frequency content of a magnetic field. Instead of showing a brief snapshot, it shows changes over a period of time, in this case 3 days.

The local magnetic field is a dynamic field that changes constantly because of variations in the ionosphere and sun and many other influences not yet fully understood. The range of variation displayed in the spectrogram chart is from 0 to 40 cycles per second. The vertical axis is frequency and the horizontal axis is time. The amplitude of a particular frequency at a specific time is represented by the intensity of color (green, yellow, white) of each point in the image.
Ampiezza e Periodo

What is the Schumann Resonance?

The Herathbeat of Planet EarthRead

🙂
Pills Disclosure News Italia

All Together

And all together, all the voices, all the goals, all the wishes, all the pains, all the joy, all the good and the evil, all together was the world.
All together was the river of the becoming, it was the music of life.

Hermann Hesse

News Burst 7 January 2020 ~ January 7, 2020


News Burst 7 January 2020

  • Newly revealed photos show Jeffrey Epstein’s face frozen in death and the torn strip of orange prison bedsheet he allegedly used as a noose to hang himself.
  • An Indonesian student described as Britain’s most prolific rapist was jailed for life on Jan 6 for a catalogue of sex offences on unsuspecting men he drugged and assaulted. Police believe he has abused at least 195 men over two-and-a-half years.
  • A virus against the protesters. Hong Kong authorities say six more suspected cases of mystery China virus have been reported, raising total in city to 21, but links to the unknown illness have been ruled out.
  • A 5.8-magnitude earthquake shook Puerto Rico on Jan 6, toppling houses and causing power outages and small landslides but there were no reports of casualties
  • Authorities in Australia have arrested close to 200 people for deliberately starting the bushfires that have devastated the country, yet the media and celebrities continue to blame “climate change” for the disaster.
  • Harvey Weinstein’s rape trial has begun, with the film producer facing up to life in prison as a possible outcome. Weinstein has pleaded not guilty on charges of assaulting two women in New York and faces up to life in prison for the more serious charge, predatory sexual assault
  • Russia is set to dismantle two of its Soviet-era intercontinental ballistic missiles. R-36M2 ICBM contains at least 1.2kg of gold, some 19kg of silver, a few grams of platinum as well as almost 6 tons of ferrous and 20 tons of non-ferrous metals.
  • Graphic new photos of Jeffrey Epstein’s autopsy have again raised doubt that the wealthy pedophile killed himself inside a New York prison. According to one coroner, Epstein’s injuries are consistent with murder.
  • Indonesians were told on Jan 6 to brace for more heavy downpours after record rains triggered flooding and landslides that authorities said had killed at least 66 people in and around Jakarta. Whole neighbourhoods in the capital – a megalopolis home to around 30 million people – were submerged last week by floodwaters that forced tens of thousands into temporary shelters.
  • After years of publishing distorted headlines, slanted news articles, and heavily biased news coverage, media giant CNN announced Friday that it has decided to launch a spinoff site that focuses on real news comprised of objective facts. “CNN: Real”
  • U.S.-led coalition tells Iraqi military it will withdraw from Iraq out of respect for the nation’s sovereignty.
  • ‘Voice of America’ confirms that Soleimani’s daughter that is directing suicide operations against the USA is a US citizen herself.
  • Chelsea Clinton has reaped $9 million in compensation since 2011 for serving on the board of an internet investment company, according to Barron’s, the financial publication.

Active Weather

  • Tropical Cyclone Blake 35 kts ↓ 991 hPa ↑ – North West Australia – Moving N 5 kts

Strongest EQ in Europe M4.1 Greece
Strongest EQ in US M3.1 Montana
Strongest EQ on the Planet M5.8 Puerto Rico
Deepest EQ M4.3 206 km AfghanistanNews Burst 7 January 2020

Headlines and Updates for January 7, 2020: The Build-Up to… What? [videos] ~ January 7 2020


Earth is a busy place today. Keeping in mind that nothing is what it seems, can we sit back and take a rational look? Yes, we’re a planet in crisis, for so many reasons—but we’ve got this.

There was another, larger quake at Puerto Rico in the small hours of the night with aftershocks still occurring this morning after the 6.6. The power is out, no fatalities reported and not a lot of damage as far as we know other than a home that slipped down on top of a car parked underneath it. Authorities say no danger of a tsunami from this one at a 10 km. depth.

The fake/orchestrated funeral for war hawk terrorist Soleimani led to a “stampede” that killed almost 40 people with around 120 reported injured. We are getting word the deep state bribed people to act as mourners with free meals. Why doesn’t that surprise us? Thanks, J.

That certainly makes more sense considering the flood of thank you’s to President Trump for eliminating a tyrant. And two with one blow. Extraordinary. This is a very revealing article with interesting comments. Perhaps the people who sold out Humanity for a little grub got their just desserts.

Ignored by Liberal Mainstream Media: Iranian Regime Bribed Funeral Attendees with Free Meals

Jan 5 – Nasiriyah, southern #Iraq#Iran-backed militias open fire on civilians refusing to attend a ceremony for the now dead IRGC Quds Force chief Qasem Soleimani.

All the while, @nytimes will describe him as a “popular general.”pic.twitter.com/cgBLnxzf6Z

— Heshmat Alavi (@HeshmatAlavi) January 6, 2020

And this is how the deep state psychos provoke even more tension.

Iran: Suleimani funeral crush death toll rises to more than 50 – latest updates

Who listens to the fake news any more?

Nikki Haley claims Democrats the ‘only ones mourning loss’ of Suleimani

This is real news. Coincidence?

Did you know there has been 3 terror attacks in Europe in just 3 days?

– Knifeman shouting “Allah Akbar” killed 1 man in Paris.

– Man shouting “Allah Akbar” threatened police in France.

– A man shouting “Allah Akbar” attacked police in Germany.

🤔

Why isn’t this bigger news?

— PeterSweden (@PeterSweden7) January 6, 2020

The deep state globalists have destroyed the country of Sweden. This is what President Trump has prevented from happening in America.

🇸🇪

WAR ZONE SWEDEN

Watch as gangs attack people with fireworks on the streets of Uppsala in Sweden.

This resembles a war zone.

😩

INSANE – What happened to my country? pic.twitter.com/zQyIk6Q18q

— PeterSweden (@PeterSweden7) January 7, 2020

The fake news can pretend that the monologue gifted to us by Ricky Gervais at the 2020 Golden Globe awards was humour, but it wasn’t as funny when you know the truth, was it? You could tell by the looks of shock on many faces.

Did he go off script? He said it the way it is. Yes, Jeffrey Epstein was their friend and many of them spent time in orgies and satanic rituals at his island and elsewhere.

Humour was the shroud, just as at the 2019 Golden Globes when the good guys had their army go out into the audience to “vaccinate” them, placing white hankies on them—which is part of an Illuminati ritual.

It’s good to let them know they’re not getting away with anything. There’s lots more excitement to come with hundreds of sealed indictments for California residents yet to be unveiled.

It appears the deep state actors have deeply infiltrated absolutely everything. The latest news on Field McConnell and the pedophile problem written by Timothy Holmseth is here, with several new articles.

This one is particularly surprising. I’m glad I wasn’t the only one who got the impression Kirk Pendergrass/E-Clause were representing Field McConnell.

Field McConnell Update: Responding to questions about E-Clause LLC regarding Field McConnell

This January 6 update sheds more light. Holmseth reiterates that the deep state fakes used a bogus case number in the arrest of Field, just as they did when CPS abducted Cyndie Abcug’s son, placed him in foster care, and took him to Disney World. They have a system and a business plan as James White of Northwest Liberty News pointed out.

Florida Governor DeSantis contacted regarding phantom case against Field McConnell – E-Clause LLC faces increased scrutiny

Unbelievable, but typical, I suppose for someone acquainted with the treasonous crimes of Field’s sister Kristine Marcy of the SES, her part in 9/11, the Boeing uninterruptible autopilot, Judge Rosemary Collyer, who recently resigned, and the rampant child trafficking—not to mention the plan for running the McConnell Veterans Ranch and rehabilitation for vets and trafficked children. We sincerely hope that Field will be released and reunited with his wife Denise very soon. This is outrageous, as the other articles reveal. It’s like something out of a B movie. You simply can’t make this up, folks.


Steve Lookner sourced updates from San Juan and other locations on the Island of Puerto Rico for the details on the latest quake.

6.5 Earthquake off Puerto Rico Coast – LIVE BREAKING NEWS COVERAGE

It appears the deep state doesn’t have much left besides the money they stole from the People, which they appear to be using to pay traitors in Australia to start fires, and to be Soleimani mourners for a funeral most of the world is celebrating. Pathetic.

52 Stealth Fighter Jets Elephant Walk In Show of Force Amid Threats of War

As Dave elucidated in his X22 Report last night, there’s a lot of posturing and manipulating of events trying to make it appear President Trump is a madman, but the Patriots are in control. I’m not concerned about war. If there were going to be war, it would have started long ago. Putin won’t be provoked by the deep state, and no one wants war BUT the deep state—and they’re outnumbered.

[DS] Payoffs Threatened, They Never Expected Trump To Expose The Entire Scam – Episode 2063b


This situation needs to be remedied fast. Voter fraud and election fraud are supposed to carry heavy penalties but the deep state executes it with impunity.

Judicial Watch Finds Millions of ‘Extra’ Registrants on Voting Rolls – Warns California, Pennsylvania, North Carolina, Colorado, Virginia to Clean Up Voting Rolls or Face a Federal Lawsuit


Did you hear about this? It sounds like it’s a cover for other things going on in the skies.

You know how the military always provides camouflage for their operations such as the one in LA at the Long Beach pier to distract from the one in which special forces dropped choppers on Wilshire Blvd. to remove what we believe was a bio-terror target. More recently they were conducting exercises in the desert near Twenty-Nine Palms as cover for the China Lake base raid.

When LEOs come up empty-handed, it’s probably a secret mission they don’t want us (or the enemy) to know about.

Armies Of Unidentified Drones Are Appearing Over The Western U.S. At Night, And It Is Really Freaking People Out

We haven’t shared any Pattie Brassard/Karen Macdonald info lately, but truth seekers may be interested in this update that goes into the creation of Earth and the seeding of Humanity by the creator gods.

We need this in book form, chronologically ordered so we understand what has happened; the experiment, who dunnit, the destruction and interference by the Pleiadians who broke our containment in the Petri dish which enabled advanced, predatory races to enter and manipulate us, the multiple wipe-outs of our civilizations to begin anew, how we got to today, and where we’re going.

Pattie is difficult to rein in and goes full steam ahead, cramming as much into the allotted time as possible so it’s a fast-moving interview with diagrams and charts. You never know what you’ll hear next.

As always, use your own discernment. Because this information is so far removed from most of the other reports out there, it may sound like fiction but much of it appears to be true. Thanks, J.

Report # 76: Pattie Brassard & Karen Ann Lucyk Macdonald–World Reality Update 1

Citizen journalists are capturing very unusual phenomena occurring across the planet, like this one. No drone.

Look at this glowing orb crossing railway tracks… What the heck is that?

Signing off for now.  ~ BP

Schumann Resonance Today – Update ~ January 6, 2020


Editor’s Note: No real activity today on the Schumann resonance graph, but we all know other energies are at play. How are you feeling? Please Be…

InJoy!

___________________________________________________________________________________________

10

Schumann Resonance Today. We will try to keep you updated about the variations of the Resonance with this page. The great variations that nobody can explain but that give us a clear sign that the planet is changing. The Earth is vibration higher and higher, just like us!

The Chart time is based on Tomsk – Russia – UTC (Universal Time Coordinated) +7 Source

RS Base Frequency 7.83 Hz.

Schumann Resonance Today Peaks:

Tell Us What You Feel!

  • 1/6 17:00 UTC – Total Calm.
  • 1/5 17:00 UTC – Calm.
  • 1/5 8:00 UTC – Today, together with the second part of yesterday, was characterized by fairly powerful but isolated peaks; two have occurred, the first at Power 21 took place at 00 UTC, the second, much more powerful, reached Power 48 at 4:45 UTC.
  • 1/4 17:00 UTC – Today the activity has almost been continuous, in the first part of the day shown on the graph the amplitude peaked around 15 while in the second half the variations were more sporadic but reached the peak of Power 43 at 13:40 UTC. The situation is now calm.
  • 1/4 8:00 UTC – After the not so uncommon data blackout, but peculiar for it’s duration, the restored flow shows a light activity that topped several times between Power 13 and 15, maximum for now was at 6 UTC.
  • 1/3 17:00 UTC – Calm until the end of the chart when some variations seems about to start.
  • 1/3 10:00 UTC – We are back to normal operations after the data blackout which lasted approximately 17 hours. The first available data show a calm situation.
  • 1/2 18:00 UTC – The publication of the new data stopped at 16 local time in Tomsk, corresponding to 9 UTC. So far the darkening has lasted 9 hours.
  • 1/2 15:30 UTC – The activity continued in a very moderate way throughout the day, the maximum at about power 14 has been temporarily reached at 1 and 6 UTC.
  • 1/1 17:00 UTC – The second part of today’s graph shows a marked increase in activity even if the peaks have remained relatively low. The movements started at 12 UTC and lasted until 17, the highest peak was at Power 25.
  • 1/1 11:00 UTC – Today, like yesterday, it seems a calm day, the maximum values once again reached Power 10 momentarily around 6 am UTC.
  • 12/31 17:00 UTC – Calm.
  • 12/31 11:30 UTC – Calm.
  • 12/30 17:00 UTC – Calm.
  • 12/30 10:00 UTC – After yesterday’s very strong activity, the situation remained calm for about 9 hours until about 21 UTC (yesterday), when new moderate movements began which lasted almost 4 hours until 1:30 UTC. During this period the maximum amplitude value reached has been Power 30.
  • 12/29 17:00 UTC – Today’s activity lasted 13 hours, from 23 (yesterday) to 12 UTC (today), the average was about Power 70 and only once, briefly for about 15 minutes around 8 UTC, the amplitude went below Power 40. Graphically it looks like a column of light.
  • 12/29 13:30 UTC – In the second part of the day shown in the graph it is highlighted how the intensity of the variations has remained substantially unchanged and has generated the strongest peak of the day at Power 93. It seems that, suddenly as they started, the movements have rapidly dropped to normal values at 12 UTC.
  • 12/29 09:00 UTC – The situation changed suddenly at 23 UTC when a series of movements began and led the amplitude values to reach Power 72 at 7 UTC, from that moment onward the amplitude remained on values between Power 65 and Power 80 with the peak maximum at Power 82 at 1:30 and 2 UTC.
  • 12/28 17:00 UTC – Calm.
  • 12/27 17:00 UTC – Calm.
  • 12/27 13:30 UTC – What appears to be all of today’s activity took place in four hours, from 4 to 8 UTC. During this period there were 4 peaks, each stronger than the previous one, and the last one at 7:30 UTC at Power 38 was the strongest.
  • 12/26 17:00 UTC – Calm.
  • 12/25 17:00 UTC – The activity seems to be in slight and constant decline, today two slight peaks, the first at Power 18 at 3 UTC, the second at Power 12 at 12: 30 UTC.
  • 12/24 17:00 UTC – Today’s activity lasted for about eight hours, from 2 to 10 UTC, the highest values occurred between 6 and 7: 30 UTC and reached Power 27.
  • 12/23 17:00 UTC – Power 34 isolated at 10:30 UTC was all the activity for today.
  • 12/22 17:00 UTC – Today we could say that total calm lasted only 4 hours, from 5 to 9 UTC, the variations for the rest of time were not significant, apart from those previously reported.
  • 12/22 09:30 UTC – After several days of almost absolute calm, yesterday’s evening UTC time we had about 4 hours of significant activity, from 15 to 19 UTC. During this period the amplitude values remained for most of the time above Power 30 with the maximum at Power 37 at 18:30 UTC.
  • 12/21 17:00 UTC – A slight activity began today in the last hours shown in the graph, the first change in amplitude occurred just before 5 UTC at Power 18 followed by minor variations. Shortly after 15 UTC the movements became more intense with first Power 31 and then the maximum of today’s chart at Power 35 just before 17 UTC.
  • 12/20 17:00 UTC – Today it was still calm, the little variations seen in the graph reached Power 11.
  • 12/19 17:00 UTC – Calm.
  • 12/18 17:00 UTC – Technically we had an event that stands out as often happens lately on the 17th of the month, a peak at Power 17 on December 17th at 19 UTC (corresponding to today’s 2 am on the chart). For the rest, still calm.
  • 12/17 17:00 UTC – Calm, many consecutive days of complete cam are not common.
  • 12/16 17:00 UTC – Calm.
  • 12/15 17:00 UTC – Another calm day, just a wriggle at 3 UTC that reached Power 15.
  • 12/14 17:00 UTC – Calm.
  • 12/13 17:00 UTC – Calm.
  • 12/13 11:00 UTC – Significant activity even today and as in the last few days consisted mainly in isolated peaks. Those of today were 2, very strong, the first at 6 UTC reached Power 60, the second shortly after at 6:40 UTC reached Power 51.
  • 12/12 17:00 UTC – Calm.
  • 12/12 14:00 UTC – There we have it, the Coincidence 17 again today, the Amplitude has reached Power 74 between 16 and 17 on the chart. corresponding to 9-10 UTC. In this case we could start thinking about how many times it must happen before it becomes impossible…
  • 12/12 07:30 UTC – It is clearly a time of pillars, even today we had 30 very intense minutes; from 6 to 6:30 UTC there was the first movement with the amplitude values that reached Power 63 shortly after 6 UTC.
  • 12/11 17:00 UTC – Calm continued.
  • 12/10 17:00 UTC – After the umpteenth “Coincidence 17” it has been calm.
  • 12/10 11:30 UTC – Powerful activity once more, even if limited in time. It was calm until just after 3 UTC when a first isolated peak reached Power 54. From 5:30 to 6:30 it was the most intense part with the maximum value at Power 67. The last peak so far is was reached near 17 h on the chart, 10 UTC, and was at P50.
  • 12/9 17:00 UTC – The short but intense period of activity was all for today.
  • 12/9 11:30 UTC – It is no surprise that today this strong peak occurred and reached Power 74, it would have been a surprise if it had been a calm day. This strong series of movements lasted about 50 minutes, from 8:40 to 9:40 UTC, at 9:15 the maximum value.
  • 12/8 17:00 UTC – Calm.
  • 12/8 11:30 UTC – The situation today shows total calm until around 10 UTC when very slight variations in Amplitude started.
  • 12/7 17:00 UTC – Much of today’s activity has been concentrated in the first part of the UTC day, from midnight until 6, where maximum values have been reached. Other slight sporadic variations at P15 also occurred at 10: 30 UTC.
  • 12/7 09:00 UTC – After the record high of yesterday the variations continued sporadically at lower levels, the maximums were around Power 15. From midnight UTC a very active phase started again which kept the Amplitude above Power 50 for about 4 hours, from 1 to 5 UTC; during this period the maximum value achieved was Power 64.
  • 12/6 17:00 UTC – After the incredible Amplitude spike at Power 158 other strong movements continued, the period of activity in which the Amplitude has been above 100 lasted about 1 hour, from 7:45 am to 8:45 UTC. At 10:30 UTC there was a further flicker at Power 28, after which a slight background activity continues.
  • 12/6 10:30 UTC – The today’s graph began in a condition of general calm until 3 am UTC when the variations started. Immediately they reached Power 32 at 4 UTC; the movements continued with less magnitude until 7:45 UTC when some impressive movements started and reached Power 100 in around 15 minutes, at 8 UTC. This, despite the already impressive value, is still not the maximum for today, at 8:30 am the amplitude has further increased and reached an incredible Power 158, the most powerful peak of the last 2 years! In addition to the main and the amplitude graphs, the massive variation can also be seen in the other two charts, the Quality, which shows a value of 25, and that of the frequency of the SR, which shows a value of 8.80.
  • 12/5 17:00 UTC – Calm.
  • 12/4 17:00 UTC – Yesterday we saw a single peak, today the activity was very similar, 2 peaks, one at Power 23 at 21:30 UTC yesterday and another today at Power 19 this morning at 1:30 UTC. For the rest of the day it was calm.
  • 12/3 17:00 UTC – Total calm, the only wriggle at 7 UTC reached Power 13.
  • 12/2 17:00 UTC – Today the activity was not long lasting but very intense, in addition to the previous peak, which marked the beginning of the active period at 8:30 UTC, after a while, at 9 UTC, there was the maximum of today at Power 55, this was followed shortly after by a further movement on the 30s after which, from 10 UTC, the calm returned. Still, another movement around 17 hours of the graph.
  • 12/2 09:30 UTC – Today’s chart shows once again a stato of calm, the last significant peak at Power 20 was Nov. 30 at 19 UTC so it took about 36 hours before the amplitude values returned above P10. Today, however, it’s back, the peak was at Power 37 8:30 UTC.
  • 12/1 17:00 UTC – A single peak isolated at Power 25 in the first part of today’s chart and then calm.

Frequency means how many wave cycle happen in a second, 1 Hz. means 1 cycle per second, 40 Hz. means 40 cycles per second, Amplitude is the size of the vibration, how big is the wave, the chart shows the frequency variation in Hz and the amplitude using the white color.

Note

The Ancient Indian Rishis called 7.83 Hz the frequency of OM. It also happens to be Mother Earth’s natural heartbeat rhythmSchumann resonances are named after professor Schumann who was involved in early German secret space program and was later paper-clipped into the United States. The frequencies of Schumann resonances are fairly stable and are mainly defined by the physical size of the ionospheric cavity.   The amplitude of Schumann resonances does change and is bigger when ionospheric plasma gets excited. Ionospheric plasma excitation happens because of solar activity, thunderstorms, use of scalar plasma weapons and HAARP and lately also when the Light forces are clearing the plasma anomaly.

Dependencies Amplitudes Schumann Resonance 31-12-2018

Dependencies of Amplitudes Schumann Resonance January 6 2020

Dependencies of Quality Schumann Resonance

Dependencies of Quality Schumann Resonance January 6 2019

Dependencies of Quality Schumann Resonance

Dependencies of Frequency Schumann Resonance January 6 2019

Schumann Resonance Differential Peaks

Read

Schumann Resonance PDF Archives

Read and Download

Images Archive

All the SR daily images in one single pageSee the Images

Web Hosting
Explanation of The Chart

The Schumann Resonance Spectrogram Chart

The Schumann Resonance Chart displays data from the magnetic field detector to monitor the resonances occurring in the plasma waves constantly circling the earth in the ionosphere. These three days spectrograms show the activity occurring at the various resonant frequencies from 1 to 40 Hz. Within the spectrogram, the power, or intensity level of each frequency is displayed as a color, with white being the most intense. The Schumann Resonances appear as the horizontal lines at 0.0, 4.0, 8.0, 12.0, 16.0, 20.0, 24.0, 28.0, 32.0, 36.0 & 40.0 Hz. This chart is based on Tomsk, Russia, time UTC +7 (UTC = Universal Time Coordinated).

What is a Spectrogram?

The Spectrogram Calendar is a visual representation of the range of frequencies in the magnetic field at a given location. Similar to how an equalizer displays the frequency content of music played on your stereo, the spectrogram calendar displays the frequency content of a magnetic field. Instead of showing a brief snapshot, it shows changes over a period of time, in this case 3 days.

The local magnetic field is a dynamic field that changes constantly because of variations in the ionosphere and sun and many other influences not yet fully understood. The range of variation displayed in the spectrogram chart is from 0 to 40 cycles per second. The vertical axis is frequency and the horizontal axis is time. The amplitude of a particular frequency at a specific time is represented by the intensity of color (green, yellow, white) of each point in the image.

Ampiezza e Periodo

What is the Schumann Resonance?

The Herathbeat of Planet EarthRead

🙂
Pills Disclosure News Italia

Tired

When your legs are tired, walk with your hearth.

Paulo Coehlo

Celebrations occur within each Hue-Being as the Light enters ~ January 6, 2020


Editor’s Note: Ah! Let us rejoice from the news we receive today from our spiritual brethren at Eireport (Gaia Portal) who use their feminine energies to gauge the vibratory rate for the collective human consciousness. Higher vibrations = happiness = JOY = heaven.

The message below is, well breathtaking as humanity reaches for the starts within them selves…their hearts! Please read this message, know the breathtaking Light deep within yourself, and BE…

InJoy!

___________________________________________________________________________________________

Celebrations occur within each Hue-Being as the Light enters.

Desperations are released, and abandoned, for all time.y!

Human strands are reconfigured to the Hue-Being.