Editor’s Note: The energies were not as frequent for July 12, yet showed intense blasts of high density/high amplitude Schumann Resonance energy for brief moments at 1am, and 3:40 am, wit a more extended beam from 10:15 to 11am (all times EDT, USA).
Thanks for staying aware of how incoming energies affect you, your life, and ultimately your world. Rest, relax, Love yourself, and then BE in…
Quantum Joy!
___________________________________________________________________________________________
Schumann Resonance Today. We will try to keep you updated about the variations of the Resonance with this page. The great variations that nobody can explain but that give us a clear sign that the planet is changing. The Earth is vibration higher and higher, just like us!
The Chart time is based on Tomsk – Russia – UTC (Universal Time Coordinated) +7 – Source
SR Base Frequency 7.83 Hz. – Schumann Resonance Today’s Peaks
58
Amplitude
6.40
Quality
7.93
Frequency Max
7.62
Frequency Min
30
Ampltude A2
20
Ampltude A3
15
Ampltude A4
“Every second, a multitude of pulses travel around the world in this unique, resonant chamber between Earth and the ionosphere, sending colluding signals to all microorganisms. These signals couple us to the Earth’s magnetic field. Named after their discoverer, these Schumann Resonances (SR) drive the harmonizing pulse for life in our world.” Eric Thompson

1/72/73/74/75/76/77/78/79/710/711/712/7020406080100
| x | Amplitude | Average |
|---|---|---|
| 1/7 | 85 | 85 |
| 2/7 | 75 | 80 |
| 3/7 | 18 | 59 |
| 4/7 | 68 | 62 |
| 5/7 | 41 | 57 |
| 6/7 | 99 | 64 |
| 7/7 | 35 | 60 |
| 8/7 | 23 | 56 |
| 9/7 | 69 | 57 |
| 10/7 | 82 | 58 |
| 11/7 | 12 | 55 |
| 12/7 | 58 | 55 |
Amplitude Max Values and Average – Schumann Resonance Today
More ChartsTell Us What You Feel! How to Read the Graphs


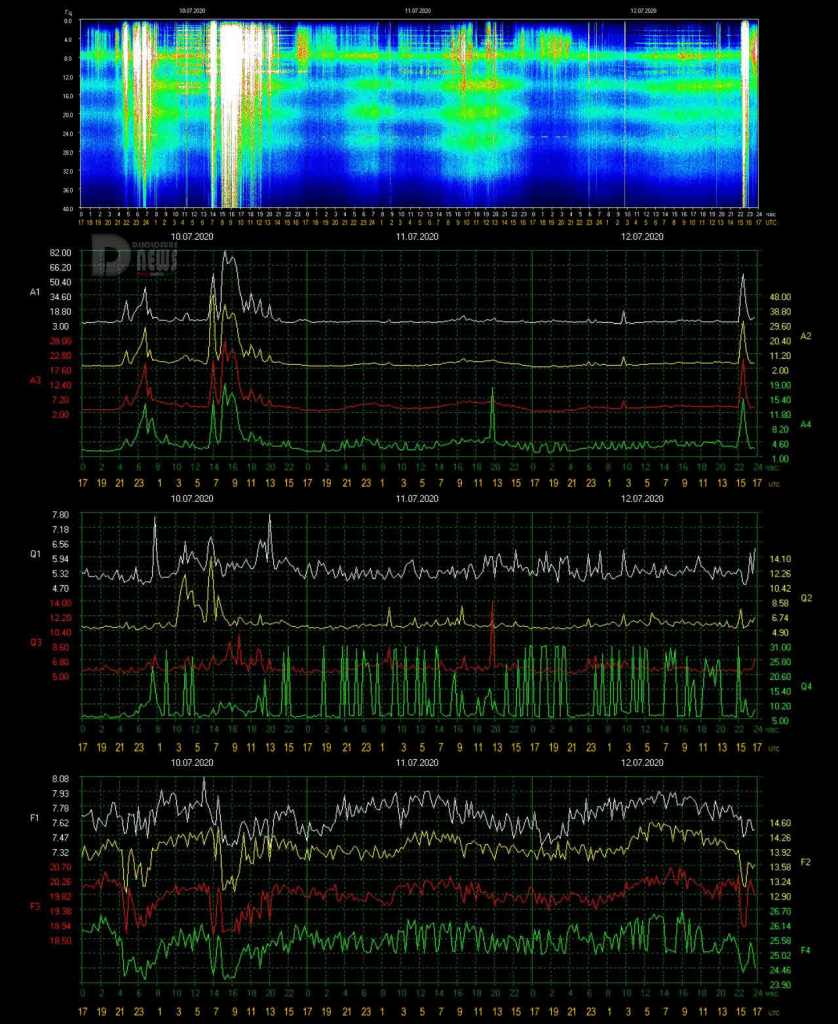
| 7/12 17:00 | The movement lasted little more than a hour from 15 UTC. The maximum was reached after 30 minutes at Power 58. This movement correspondend to the start of a Frequency decrease to and below 7.50 Hz. |
| 7/12 15:45 | A sudden peak started at 15 UTC and quickly reached Power 35 rising. |
| 7/12 15:00 | Second day of almost total calm, apart from minor short movements. Frequency seems to have assumed a 24-hour cycle as the shape of today’s graph matches almost perfectly with that of the previous day. The same happen with the Quality. |
| 7/12 10:30 | The total calm was interrupted by some isolated short-lived movements, the most significant of which occurred just before 3 UTC and reached Power 18. |
| 7/11 17:00 | A day of almost total calm, only a very light activity that did not pass Power 12 around 16 UTC with a tail of light ondulations. The Frequency at the time of this update is slightly oscillating above 7.60 Hz. |
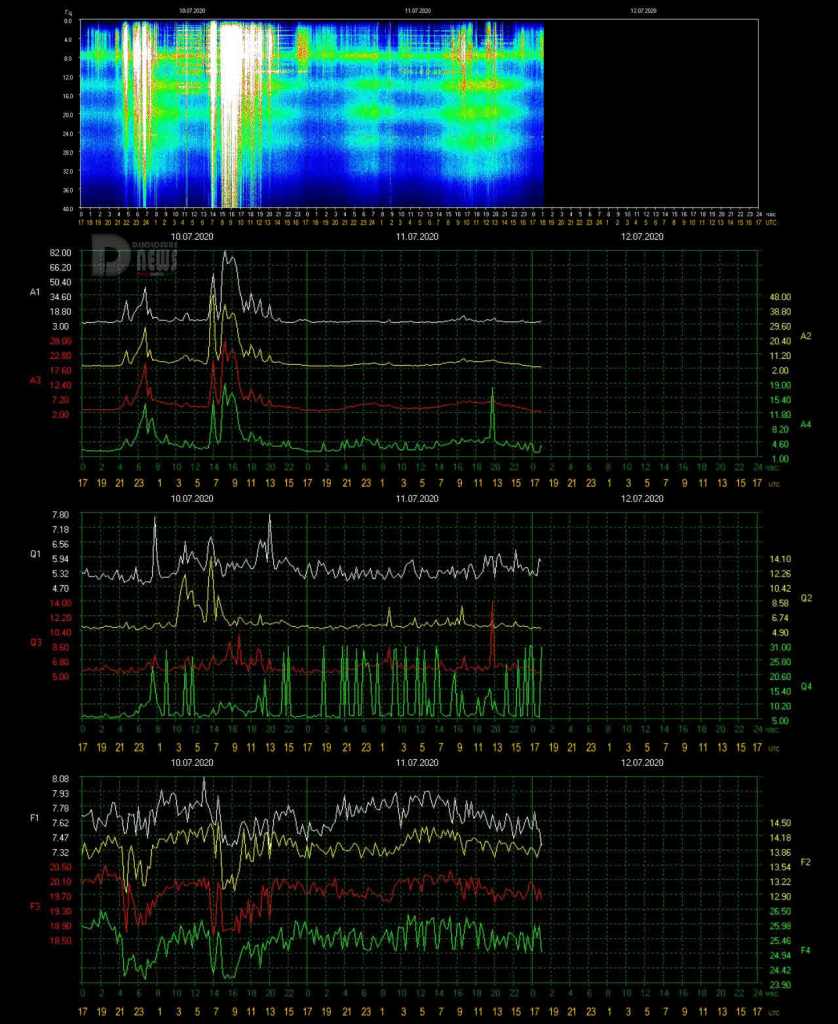
| 7/10 20:30 | Today’s activity took place in two periods, the first from 21 (yesterday) until 1 UTC today with two peaks, the first at Power 29 shortly before 23 UTC and the second at Power 44 at 24 UTC. The second period of activity was much more intense and started at 7:30 UTC and lasted about 6 hours, until 1 pm. The first peak reached Power 54 at 7, the second peak reached Power 82 at 8:30 UTC. From 8 to 9:30 UTC the Amplitude remained constantly above Power 70. |
| 7/10 07:00 | The frequency started to slowly rise from 3 UTC while after the last movement of the Amplitude, around midnight UTC, it returned back to normal values with sporadic peaks below Power 15. A rapid drop in frequency after hitting the highest value of these past few days started at 6 UTC and has triggered a new sudden spike that is passing Power 55 at 7. |
| 7/10 00:30 | The Amplitude is still rising passing Power 40 at 23 UTC, the Frequency is moving around 7.60 Hz. The maximum value has been reached at 23:30 with Power 42. |
| 7/9 22:30 | After about eight hours since the end of the previous amplitude movement a new wave started at 21 UTC with a rapid variation that reached Power 29 just before 22 UTC. Another movement is approaching Power 30 at the moment of this update. |
- 7/9 18:30 – After the significant movement at Power 52, the activity continued for 7 hours, up to 12 UTC. The amplitude values however remained modest only sporadically exceeding Power 15. In the frequency graph it is noted that the turnaround, that is when it started to rise, was around 12 UTC.
- 7/9 08:00 – The next wave arrived (see previous report) and brought the Amplitude to Power 69 at 5:30 UTC at the same time when the Quality reached the max value of these last three days at 8.70 and the Frequency went below 7.50 Hz.
- 7/8 23:30 – Looking at the Amplitude chart in the last 24 hours, we can see kind of waves, each time stronger and each cycle at 6 hours from the other. Of this series the last ‘wave’ was the strongest and at 20:20 UTC it reached Power 52. At this peak there were wide variations in Frequency.
- 7/8 17:00 – Slight movements continued until shortly after 13 UTC, today’s maximum value was Power 22 reached at 12 UTC. At the time of this update, the Frequency stabilized around 7.60 Hz while the Amplitude and Quality returned to normal values.
- 7/8 11:00 – Without considering the very slight activity that took place around 22 UTC yesterday, the calm lasted about 18 hours, until 5 UTC today, when the Frequency began a gradual descent to reach the minimum value of the last three days at 7.29 Hz at 9 UTC, at this minimum the maximum Amplitude value so far at Power 15 has been recorded, reached and being exceeded at the time of this update.
- 7/7 17:00 – The movement at Power 35 previously reported was the only significant one of the day, followed by oscillations of the Frequency between 7.60 and 7.70 Hz which are also continuing at the time of this update. The Amplitude did not have any variations that exceeded Power 10.
- 7/7 10:30 – Today’s graphs show a calm condition that started yesterday at 16 UTC and lasted about 17 hours, until 8:30 UTC when a rapid and deep drop of the Frequency to 7.37 Hz accompanied a peak of the Amplitude which reached Power 35 at 9:20 UTC. At the time of this update, the Frequency remains low, below 7.60 Hz.
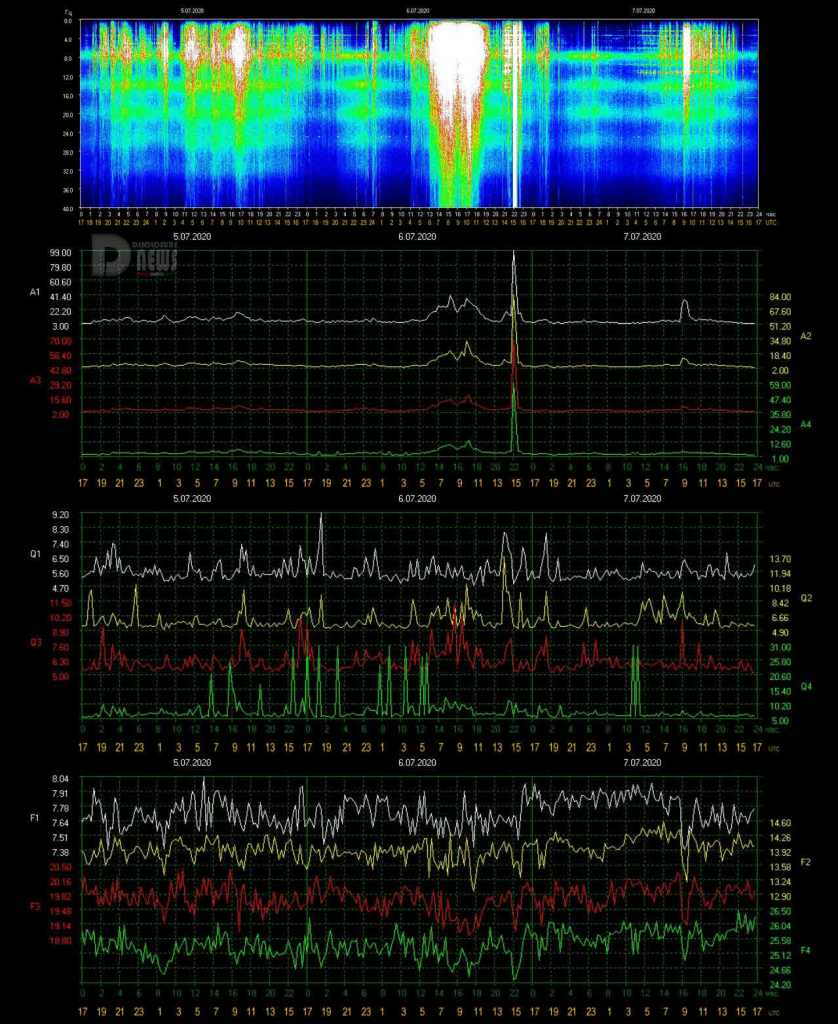
- 7/6 17:00 – The peak at Power 99 seems to have been an isolated movement inserted in a period of very wide variations in Frequency and Amplitude that are still in progress
- 7/6 16:00 – It seemed like a day with medium activity until a sudden and powerful peak did bring the amplitude to a massive Power 99, this level was maintained for about 20 minutes, from 14:50 to 15:10 UTC, we will see shortly if it was an isolated peak. The frequency during this movement did not have large variations while the quality also recorded a sudden rise at around 14 UTC.
- 7/6 14:00 – An average to strong activity occurred from 5 UTC for the duration of about 8 hours, up to 13 UTC. During this period there were wide oscillations of Frequency and the two strongest amplitude peaks were Power 41 shortly after 8 UTC and Power 37 at 10 UTC. From 13 UTC the situation still sees the Frequency around 7.60 Hz with wide oscillations.
- 7/5 17:00 – The situation has not changed since the last update, slight movements continued without however generating any significant peak.
- 7/5 11:00 – The new graphs show a continuous activity with wide fluctuations in both Quality and Frequency, the Amplitude has so far not reached high values but has remained below Power 15 until around 10 UTC when it recorded today’s maximum value of Power 21.
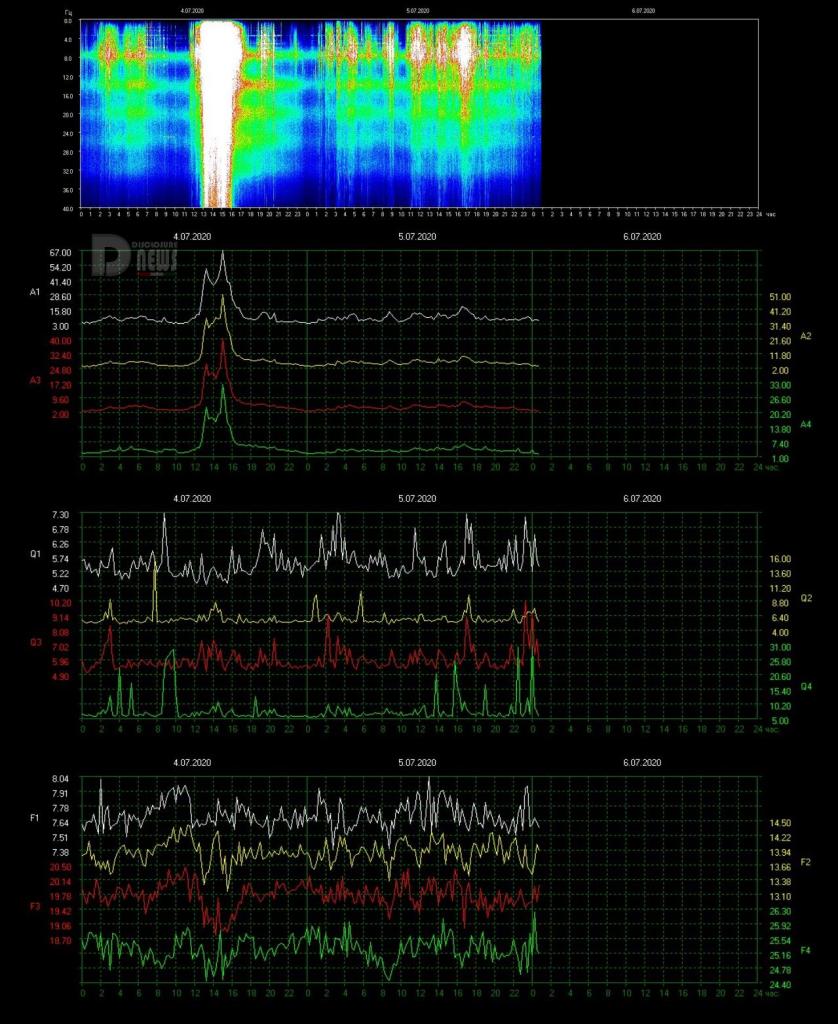
- 7/4 17:00 – The most significant period of activity today lasted about 5 hours, from 5 to 10 UTC, during this period were recorded the two peaks reported previously. In the period from 6 to 9 UTC the minimum amplitude was around Power 40. Other minor movements occurred between 12 and 14 UTC reaching as maximum Power 15. At the time of this update the Frequency oscillates around 7.70 Hz.
- 7/4 09:30 – While the frequency remains oscillating around 7.60 Hz, the amplitude continues to increase. After the previously reported peak, there was a slight decrease in correspondence of an increase in frequency at 7 UTC but almost immediately this was followed by a new increase that at 8 UTC reached Power 68.
- 7/4 07:30 – Once again we see short periods of calm interrupted by more or less significant movements, today the significant part started at 4 UTC, when a sudden and steep drop in frequency towards 7.60 Hz led to the amplitude to a steep climb from 5 UTC. This move in just over an hour led to a peak that reached Power 53 shortly after 6 UTC. At the moment of this update the Frequency remains around 7.60 Hz.
- 7/3 17:00 – The most significant part of today’s activity took place from 10 to 14 UTC, the Frequency oscillated around 7.60 Hz and the Amplitude reached the maximum of Power 20 at 13:30 UTC. At the time of this update the Frequency remains on the 7.60 Hz.
- 7/3 14:00 – Frequency continued in its variations and therefore there was no real calm, Amplitude reached Power 18 at 20:30 UTC yesterday and again today around 12 UTC when the Frequency’s oscillations increased in a downward trend.
- 7/2 17:00 – Frequency fluctuations continued and so did the Amplitude, with lesser variations of the Quality. The massive activity that slowed down from 13 UTC was followed by a new increase that reached Power 45 at 15 UTC, after this further movement there was a gradual decrease below Power 20 even if, once again, the frequency remains basically low.
- 7/2 14:30 – After the ‘Pillar’ lasting two hours from 11 to 13 UTC and which reached a maximum of Power 74, the amplitude slightly decreased to start rising again at the time of this update. The frequency during this period had significant fluctuations going from 8 to 7.50 Hz. It is interesting to note that the other amplitude recordings also reported significant values.
- 7/2 12:00 – The new graphs show a calm condition, after yesterday’s strong activity the Frequency started a slow and gradual rise until it stabilized around the base value of 7.83 Hz at about 3 UTC, shortly after a movement of the Amplitude that reached Power 17 at 2 UTC. At 10:45 UTC there was a sudden increase in Amplitude which reached Power 53 within 20 minutes, this in correspondence with a drop in Frequency. At the time of this update we can see a further increase in Amplitude.
- 7/1 17:00 – The most important part of today’s activity took place from 3 to 15 UTC when the frequency returned to rise and the amplitude to fall to values that are not yet normal but rather low, towards 7.50 Hz. In these 12 hours there was a period of more than 2 hours, from 8:30 to 10:30 UTC, during which the Amplitude remained constantly above Power 70. The time above Power 40 lasted 5 hours, from 6 to 11 UTC.
- 7/1 10:00 – Another increase, shortly after 9 UTC a new maximum was reached at Power 85, this at the same time as strong variations in Quality and minimum values of Frequency which remains almost constantly below 7.30 Hz touching the lowest value for these last days 7,24.
- 7/1 09:30 – Still rising, after reaching Power 78 the Amplitude continues to rise passing Power 80 at the time of this update. The Frequency remains very low, belo 7.30 Hz.
- 7/1 08:30 – Even the graphs of today show little or no calm, at 1 UTC the Frequency started to drop steeply. After reaching the maximum value of the last few days at 7.90 Hz at 23 yesterday, it went down to the minimum value of 7.25 Hz shortly after 7 UTC. Both Quality and Amplitude began to move at 3 UTC, the latter producing growing peaks in rapid succession, the maximum reached so far was Power 71 at 7:40 UTC, at the same time of the minimum Frequency’s value.
Frequency means how many wave cycle happen in a second, 1 Hz. means 1 cycle per second, 40 Hz. means 40 cycles per second, Amplitude is the size of the vibration, how big is the wave, the chart shows the frequency variation in Hz and the amplitude using the white color.
Note
The Ancient Indian Rishis called 7.83 Hz the frequency of OM. It also happens to be Mother Earth’s natural heartbeat rhythm Schumann resonances are named after professor Schumann who was involved in early German secret space program and was later paper-clipped into the United States. The frequencies of Schumann resonances are fairly stable and are mainly defined by the physical size of the ionospheric cavity. The amplitude of Schumann resonances does change and is bigger when ionospheric plasma gets excited. Ionospheric plasma excitation happens because of solar activity, thunderstorms, use of scalar plasma weapons and HAARP and lately also when the Light forces are clearing the plasma anomaly.
Schumann Resonance Today – Energy of Consciousness Currents
Show entriesSearch:
| Time UTC +7 | Amplitude | Quality | A+Q | Freq. | Base Freq. | Delta | ECC Increase | TOTAL ECC |
|---|---|---|---|---|---|---|---|---|
| 04/05/2020 18.00.00 | 91 | 5 | 96 | 7,91 | 7,83 | 0,08 | 8 | 104 |
| 03/05/2020 07:00:00 | 81 | 7 | 88 | 7,28 | 7,83 | 0,55 | 48 | 136 |
| 01/05/2020 07:00:00 | 58 | 8,08 | 66,08 | 7,53 | 7,83 | 0,3 | 20 | 86 |
| 30/04/2020 21:15:00 | 90 | 7,46 | 97,46 | 7,36 | 7,83 | 0,47 | 46 | 143 |
| 29/04/2020 17:00:00 | 76 | 6,91 | 82,91 | 7,31 | 7,83 | 0,52 | 43 | 126 |
| 23/04/2020 10:00:00 | 138 | 4,74 | 142,74 | 7,42 | 7,83 | 0,41 | 59 | 201 |
| 19/04/2020 14:45:00 | 88 | 6,49 | 94,49 | 7,25 | 7,83 | 0,58 | 55 | 149 |
| 18/04/2020 16:15:00 | 110 | 7,21 | 117,21 | 7,26 | 7,83 | 0,57 | 67 | 184 |
| 18/04/2020 14:00:00 | 90 | 7,22 | 97,22 | 7,34 | 7,83 | 0,49 | 48 | 145 |
| 18/04/2020 12:00:00 | 81 | 10,9 | 91,9 | 7,24 | 7,83 | 0,59 | 54 | 146 |
Showing 1 to 10 of 67 entriesPreviousNext
Schumann Resonance Today – Energy of Consciousness Currents Posts

Earth Gaia Pole Shift

After-Effects Of The Eclipse Portal

Dna Enhancement Thru Sound And Light
Schumann Resonance PDF Archives
Images Archive
All the SR daily images in one single page See the Images

Explanation of The Chart
The Schumann Resonance Spectrogram Chart
The Schumann Resonance Chart displays data from the magnetic field detector to monitor the resonances occurring in the plasma waves constantly circling the earth in the ionosphere. These three days spectrograms show the activity occurring at the various resonant frequencies from 1 to 40 Hz. Within the spectrogram, the power, or intensity level of each frequency is displayed as a color, with white being the most intense. The Schumann Resonances appear as the horizontal lines at 0.0, 4.0, 8.0, 12.0, 16.0, 20.0, 24.0, 28.0, 32.0, 36.0 & 40.0 Hz. This chart is based on Tomsk, Russia, time UTC +7 (UTC = Universal Time Coordinated).
What is a Spectrogram?
The Spectrogram Calendar is a visual representation of the range of frequencies in the magnetic field at a given location. Similar to how an equalizer displays the frequency content of music played on your stereo, the spectrogram calendar displays the frequency content of a magnetic field. Instead of showing a brief snapshot, it shows changes over a period of time, in this case 3 days.
The local magnetic field is a dynamic field that changes constantly because of variations in the ionosphere and sun and many other influences not yet fully understood. The range of variation displayed in the spectrogram chart is from 0 to 40 cycles per second. The vertical axis is frequency and the horizontal axis is time. The amplitude of a particular frequency at a specific time is represented by the intensity of color (green, yellow, white) of each point in the image.

What is the Schumann Resonance?
The Herathbeat of Planet Earth Read
Clicks on the Ads Keep Us Alive 🙂

Happy Life
Very little is needed to make a happy life; it is all within yourself, in your way of thinking.
Marco Aurelio