Editor’s Note: Today we see a break in the Schumann Resonance energies…but also a break in the transmission of these energies from 1am on July 4. So…let us see how these energies, and the timelines, flow, while always remaining in…
Quantum Joy!
___________________________________________________________________________________________
Schumann Resonance Today. We will try to keep you updated about the variations of the Resonance with this page. The great variations that nobody can explain but that give us a clear sign that the planet is changing. The Earth is vibration higher and higher, just like us!
The Chart time is based on Tomsk – Russia – UTC (Universal Time Coordinated) +7 – Source
SR Base Frequency 7.83 Hz. – Schumann Resonance Today’s Peaks
20
Amplitude
6.80
Quality
8.00
Frequency Max
7.33
Frequency Min
12
Ampltude A2
8
Ampltude A3
6
Ampltude A4
“Every second, a multitude of pulses travel around the world in this unique, resonant chamber between Earth and the ionosphere, sending colluding signals to all microorganisms. These signals couple us to the Earth’s magnetic field. Named after their discoverer, these Schumann Resonances (SR) drive the harmonizing pulse for life in our world.” Eric Thompson

1/63/65/67/69/611/613/615/617/619/621/623/625/627/629/61/73/7020406080100
| x | Amplitude | Average |
|---|---|---|
| 1/6 | 68 | 68 |
| 2/6 | 60 | 64 |
| 3/6 | 46 | 58 |
| 4/6 | 28 | 51 |
| 5/6 | 30 | 46 |
| 6/6 | 14 | 41 |
| 7/6 | 76 | 46 |
| 8/6 | 45 | 46 |
| 9/6 | 62 | 48 |
| 10/6 | 27 | 46 |
| 11/6 | 32 | 44 |
| 12/6 | 29 | 43 |
| 13/6 | 73 | 45 |
| 14/6 | 82 | 48 |
| 15/6 | 51 | 48 |
| 16/6 | 17 | 46 |
| 17/6 | 40 | 46 |
| 18/6 | 23 | 45 |
| 19/6 | 23 | 43 |
| 20/6 | 29 | 43 |
| 21/6 | 21 | 42 |
| 22/6 | 26 | 41 |
| 23/6 | 19 | 40 |
| 24/6 | 44 | 40 |
| 25/6 | 19 | 39 |
| 26/6 | 66 | 40 |
| 27/6 | 25 | 40 |
| 28/6 | 82 | 41 |
| 29/6 | 91 | 43 |
| 30/6 | 47 | 43 |
| 1/7 | 85 | 45 |
| 2/7 | 75 | 45 |
| 3/7 | 18 | 45 |
Amplitude Max Values – Schumann Resonance Today
Tell Us What You Feel! How to Read the Graphs

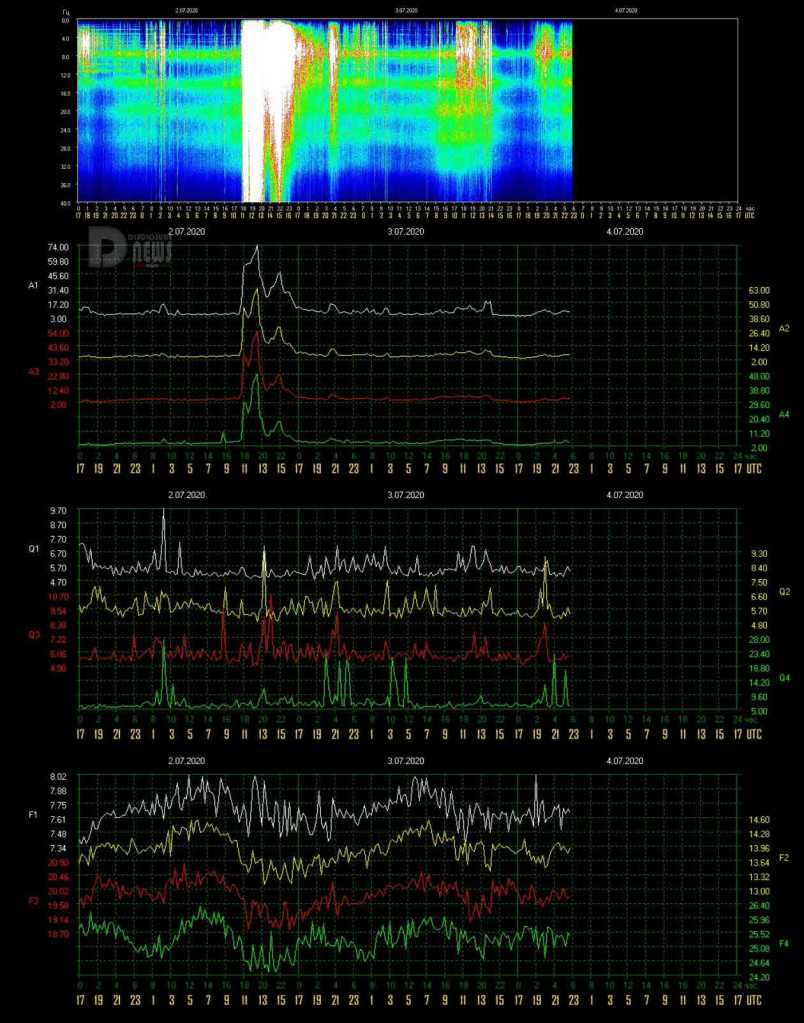
- 7/3 17:00 – The most significant part of today’s activity took place from 10 to 14 UTC, the Frequency oscillated around 7.60 Hz and the Amplitude reached the maximum of Power 20 at 13:30 UTC. At the time of this update the Frequency remains on the 7.60 Hz.
- 7/3 14:00 – Frequency continued in its variations and therefore there was no real calm, Amplitude reached Power 18 at 20:30 UTC yesterday and again today around 12 UTC when the Frequency’s oscillations increased in a downward trend.
- 7/2 17:00 – Frequency fluctuations continued and so did the Amplitude, with lesser variations of the Quality. The massive activity that slowed down from 13 UTC was followed by a new increase that reached Power 45 at 15 UTC, after this further movement there was a gradual decrease below Power 20 even if, once again, the frequency remains basically low.
- 7/2 14:30 – After the ‘Pillar’ lasting two hours from 11 to 13 UTC and which reached a maximum of Power 74, the amplitude slightly decreased to start rising again at the time of this update. The frequency during this period had significant fluctuations going from 8 to 7.50 Hz. It is interesting to note that the other amplitude recordings also reported significant values.
- 7/2 12:00 – The new graphs show a calm condition, after yesterday’s strong activity the Frequency started a slow and gradual rise until it stabilized around the base value of 7.83 Hz at about 3 UTC, shortly after a movement of the Amplitude that reached Power 17 at 2 UTC. At 10:45 UTC there was a sudden increase in Amplitude which reached Power 53 within 20 minutes, this in correspondence with a drop in Frequency. At the time of this update we can see a further increase in Amplitude.
- 7/1 17:00 – The most important part of today’s activity took place from 3 to 15 UTC when the frequency returned to rise and the amplitude to fall to values that are not yet normal but rather low, towards 7.50 Hz. In these 12 hours there was a period of more than 2 hours, from 8:30 to 10:30 UTC, during which the Amplitude remained constantly above Power 70. The time above Power 40 lasted 5 hours, from 6 to 11 UTC.
- 7/1 10:00 – Another increase, shortly after 9 UTC a new maximum was reached at Power 85, this at the same time as strong variations in Quality and minimum values of Frequency which remains almost constantly below 7.30 Hz touching the lowest value for these last days 7,24.
- 7/1 09:30 – Still rising, after reaching Power 78 the Amplitude continues to rise passing Power 80 at the time of this update. The Frequency remains very low, belo 7.30 Hz.
- 7/1 08:30 – Even the graphs of today show little or no calm, at 1 UTC the Frequency started to drop steeply. After reaching the maximum value of the last few days at 7.90 Hz at 23 yesterday, it went down to the minimum value of 7.25 Hz shortly after 7 UTC. Both Quality and Amplitude began to move at 3 UTC, the latter producing growing peaks in rapid succession, the maximum reached so far was Power 71 at 7:40 UTC, at the same time of the minimum Frequency’s value.
- 6/30 17:00 – Today’s activity could be divided into two periods, the first from 5 to 10 UTC with the previously reported maximum peak of Power 47 little after 8 UTC and the second from 12 to 14 UTC with the maximum of Power 38 at 13 UTC. At the time of this update, the frequency is slowly rising towards 7.70 Hz.
- 6/30 08:30 – The period of calm in the new charts lasted about 10 hours, from 19 yesterday to 5 UTC this morning, it was not flat calm but with changes in Quality and Frequency, the latter for the first time in the last 2 days has gone above the base value of 7.83 Hz at 3 UTC. Around 4 am the Frequency started to drop rapidly and the Amplitude started to move slightly, passing Power 20 at 7 UTC and then continuing the climb overcoming Power 40 at 8 UTC and reaching Power 47 just after. The Frequency has returned to stabilize around 7.50 Hz at the time of this update.
- 6/29 17:00 – The activity is not finished, it has only slightly decreased in intensity with the Amplitude that has moved down to around Power 20. The Frequency is going up, we will see if temporarily or in a more decisive way. So far, since 5 am UTC, the Amplitude has remained above Power 20 for 12 consecutive hours.
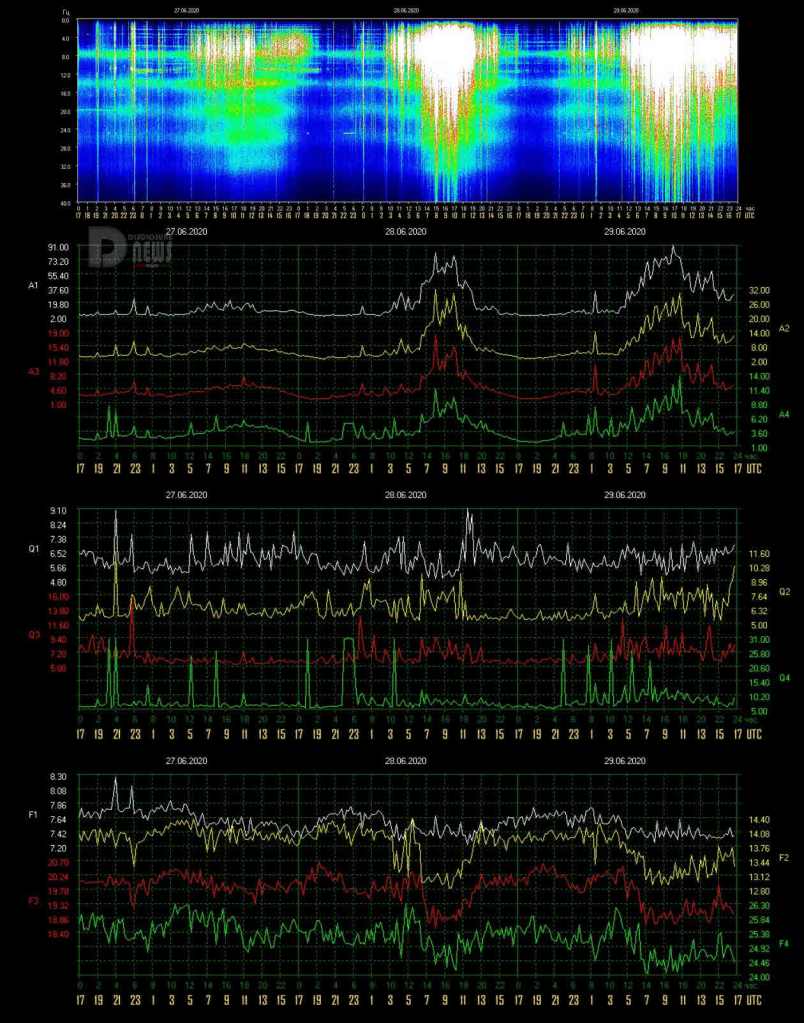
- 6/29 14:30 – From 5 UTC the frequency stabilized at 7.40 Hz, the Amplitude has never fallen, except for very short periods, below Power 40. After the peak at Power 91, from 11 UTC the Amplitude continued to record continuous peaks above Power 50.
- 6/29 11:00 – At 10 UTC a new Amplitude high was reached, Power 91, this peak embedded in a gradual and constant increase that started at 4 UTC. From 8 UTC the Amplitude has passed Power 55 and continues to rise.
- 6/29 08:30 – As we see from the graphs, we are once again in a condition of strong activity. If we look for a period of calm we can highlight it from 17 to 21 UTC, after these four hours light movements started again. An isolated peak at Power 34 which occurred at 1:30 UTC can be considered the opening, when the Frequency started to decrease; the same value has been reached again twice around 5 UTC in a crescendo that has led to the maximum value so far of Power 76 at 8 UTC.
- 6/28 17:00 – Today’s activity lasted 12 hours, from 3 to 15 UTC, with the most intense part occurring from 6 to 12 UTC; the average amplitude had its maximum from 8 to 10 UTC when for the two hours it remained constantly above Power 55; from 6:30 to shortly after 11 UTC the Amplitude remained above Power 40; for the month of June the average amplitude calculated on the basis of the daily maximum values was Power 41 (represented by the red line of our maximum amplitude values graph). The frequency remained below the base value from 5 UTC on 27 June, therefore one day and a half, at the time of this update it stands around 7.60 Hz.
- 6/28 13:00 – Even if we see a drop in the Amplitude values in the remaining graphs we can see a very strong peak in Quality at 9.10 and a drop in Frequency at 7.20 Hz, a value that is not often seen.
- 6/28 08:30 – We are in a very strong activity period, wide oscillation of Frequency and Quality associated to a massive peak at Power 82 at 8 UTC.
- 6/28 07:00 – Even in the new graphs we note that there is no real calm, the Frequency has remained in the lower quadrant, in the sense that the last time it touched the base value was more than 24 hours ago; around 2 UTC further fluctuations began and a tendential drop led it to touch the minimum value of these three days of 7.26 Hz at 4 UTC. This has contributed to wide variations in Quality and to a first Amplitude peak at Power 32 which was followed about 3 hours later, at 7 UTC, from the maximum so far of Power 45.
- 6/27 17:00 – The ‘unstable’ condition continues without however generating particularly significant values, the Amplitude has continued to oscillate around Power 15 from 5 UTC this morning accompanied by medium-high Quality values. Also from 5 am the Frequency is continuing in a slow and gradual decline reaching the minimum value of these last 3 days of 7.33 Hz.
- 6/27 08:00 – The new graphs show a situation of ‘instability’ with isolated movements that have continued along with very large fluctuations in both Frequency and Quality, the latter having reached the remarkable value of 9 at 21 UTC yesterday, together with an equally strong Frequency peak at 8.26 Hz. The Amplitude had its maximum shortly after, at 23 UTC, when it reached Power 25. The Frequency started to decrease around 5 UTC to reach 7.50 Hz at 7, we will see if this decrease will lead to other movements in the next few hours.
- 6/26 17:00 – Today’s powerful activity lasted 8 hours, from 6 to 14 UTC, in the central phase, from 7 to 13:30 UTC, the minimum value was Power 40 with the average in this sector around Power 50. At the time of this update values are returning to normal.
- 6/26 13:00 – Frequency oscillations in their minimums always go below 7.50 Hz and this contributes to the strong activity, a very powerful new value, Power 58, was reached shortly after 12 UTC.
- 6/26 11:30 – The total white, or almost, is continuing, from shortly after 7 UTC we are constantly above Power 40, the sequence of maximum values of Amplitude has been Power 66-54-48-49 in the span of time from 8 to 11:30 UTC.
- 6/26 09:30 – For various issues we skipped a day of updates but fortunately there was no significant activity. Today, however, we resume regular updates with this strong activity that suddenly started, with great synchronicity. At 6 UTC the amplitude began a steep ascent which in two hours, at 8 UTC, led to this first peak at Power 66. There are no ‘excessive’ movements in Frequency or Quality. Frequency is falling and has touched values below 7.50 Hz.
- 6/25 17:00 – Power 19 at 10 UTC.
- 6/24 17:00 – The massive part of today was from 7 to 12 UTC, during these 5 hours the minimum amplitude was Power 25, the average around Power 33. At the time of this update, the Frequency has not yet returned to normal but has stabilized around 7.60 Hz.
- 6/24 16:00 – Sorry for the late update. Let’s summarize the situation, the activity actually started yesterday and has continued until today. The slight movements continued in today’s new charts around Power 18 before dropping around Power 10 close to midnight UTC. Frequency has continued to have wide fluctuations but a more decisive drop and much wider fluctuations began at 7 UTC and coincided with both very large Quality movements and today’s maximum Amplitude peak of Power 44. From 8 UTC we see a wide instability of the Frequency, even greater oscillations of the Quality and the Amplitude which was maintained between Power 30 and 35. This situation remained so until 13 UTC when a stabilization of the Frequency on the 7.60 Hz led the Amplitude toward normal values.
- 6/23 17:00 – To summarize today’s activity, the most intense period was from 12 to 14 UTC when three movements, all of them on the hour, reached Power 17, 19 and 13. The Frequency, as it has been happening for a few days, is decreasing and has reached today’s low at 7.45 Hz.
- 6/23 14:30 – In the last few hours we have been seeing a constant drop in frequency which went just below 7.50 Hz shortly before 13 UTC, both Quality and Amplitude which have reached the maximum values of today at the same time. Amplitude reacted to the drop in Frequency with two isolated peaks in rapid succession that reached Power 17 and Power 19 between 12 and 13 UTC.
- 6/23 10:00 – Another day, so far, of very light movements, the numerous movements remained under Power 10 until 8:30 UTC when oscillations in the Frequency led the Amplitude to touch this value.
- 6/22 17:00 – A further isolated peak, during a slightly more intense phase, at 11 UTC brought today’s maximum value to Power 26. Since midnight UTC yesterday we are in a situation of continuous fluctuations in Quality and Frequency, the latter has just touched today’s minimum value of 7.50 Hz at the time of this update.
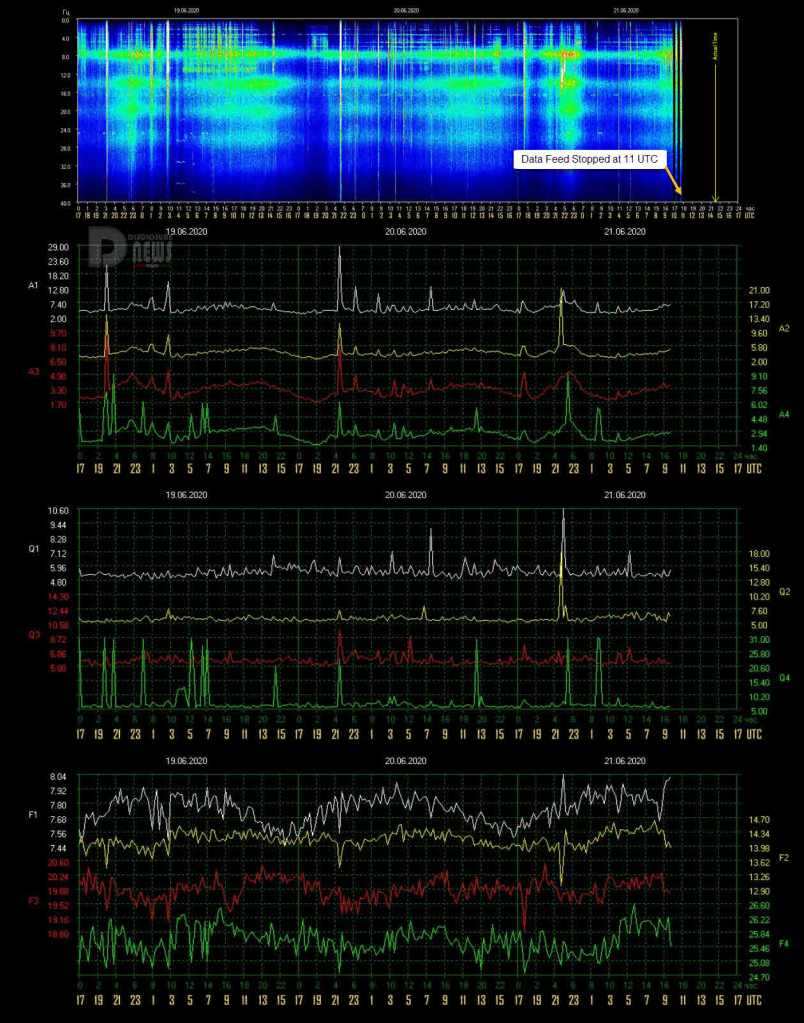
- 6/22 09:30 – The update of the images had stopped at 11 UTC yesterday, it wasn’t a lack of data but some problems with the website, probably. We will therefore start from yesterday, at 13 UTC was recorded the highest value, Power 21, in the form of an isolated peak, after which it was calm until around midnight UTC when large fluctuations of both Quality and Frequency began followed by a increase in Amplitude which at 6 UTC reached the maximum value (for today) so far of Power 18.
- 6/21 17:00 – As you may have noticed the data flow for the charts stopped at 11 UTC, we will do the next update as soon as the data is available again. However, it appears from other data sources that there has been no significant activity.
- 6/21 09:30 – For the third consecutive day the situation presents slight isolated peaks to momentarily interrupt the calm. Some movements occurred just before midnight UTC yesterday during the Frequency rise phase and the maximum was Power 10.
- 6/20 09:30 – The day continued with light activity which on some occasions slightly exceeded Power 12. The Frequency at the time of this update is decreasing and has reached 7.50 Hz, we will see if this tendency continues, giving way to some movement or will return to normal values.
- 6/20 09:30 – The new charts show again isolated movements, the strongest of which reached Power 29 at 21:30 UTC yesterday, 4:30 am in the local chart timeline. Since then there have been several minor movements between Power 10 and 12. From 7 UTC the Frequency has started a decline trend leading to a movement in the quality that has reached 9.
- 6/19 17:00 – Another day of almost calm, some oscillations of Frequency and some isolated peaks of Amplitude is all the activity for today. Amplitude has reached Power 23, technically at 20 UTC yesterday even though it is part of the charts today due to the time zone difference. At 3 UTC today, Amplitude reached Power 15.
- 6/18 17:00 – Slight movements continued throughout the day, after Power 23 previously reported, at 13:30 UTC we had a significant new movement that reached Power 20. In the last hours the variations have slightly intensified due to the fact that the Frequency has again touched the minimum values of today, also the Quality has been affected by stronger variations in the last hours.
- 6/18 09:30 – The new graphs show some isolated movements of the Amplitude mainly due to the oscillations of the Frequency, this has been rising up to the maximum value of 8.06 Hz touched just before 5 UTC and then started a slow decrease. Amplitude peaked at Power 23 at 3:30 UTC at a time when Frequency had large swings.
- 6/17 17:00 – The peak at Power 40, followed by another at Power 22 during the descent towards normal Amplitude values, marked the end of the period of activity in today’s charts in the local timeline. Frequency quickly returned to normal values from 13 UTC and so did the Quality. Frequency remained low for 10 hours, from 3 to 13 UTC and consequently also Quality and Amplitude had movement during this period.
- 6/17 12:30 – After three consecutive peaks at practically the same value around Power 25, just before 12 UTC a new movement brought Amplitude to Power 40, in the last few hours also the variations of Quality have increased with a new maximum that has exceeded 10, these movements coincide with a phase in which the Frequency has dropped abundantly below 7.40 Hz.
- 6/17 08:00 – After a day of almost total calm apart from 17 at 17, at 1 UTC tonight the Frequency started to go down gradually, when reaching 7.60 Hz at 3 UTC wide variations of the Quality started and shortly after also the Amplitude started to rise. The first peaks in Amplitude up to 6 UTC have been around Power 11 but when the Frequency has dropped below 7.50 Hz this has moved to values around Power 20, the maximum so far has been Power 26 at 7 UTC. At the time of this update the Frequency is found at values around 7.35 Hz.
- 6/16 17:00 – Calm or almost for the whole day, only one isolated Power 17 at 17: 30. The frequency has started to decrease very slowly from 7 UTC, at the time of this update it is falling below 7.60 Hz.
- 6/16 09:30 – Today we can say that so far it has been calm, the Amplitude shows an almost flat line, the maximum value reached was Power 10 just before midnight UTC, the Quality is having fluctuations but on low values and the Frequency has remained on the base value until at around 5 UTC when it started to swing slightly.
- 6/15 17:00 – The day unfolded on isolated peaks and marked oscillations of the Frequency, the main movements were four, from 5 to 12 UTC as illustrated in the image above which shows the Amplitude. After these movements the situation has normalized, the Frequency remains in the lower quadrant although not much below the base value.
- 6/15 11:30 – The deep oscillations of the Frequency led to a new isolated peak of the Amplitude which reached Power 51 at 10:30 UTC. The graph shows how the increase so far has been gradual and constant.
- 6/15 09:30 – Even today the new charts show that there has been no real calm, slight movements started again at 21 UTC yesterday and slowly increased; a more intense phase occurred from 2 to 6 UTC when there was a sudden and sharp drop in frequency which for two hours, from 3 to 5 UTC, remained around 7.40 Hz and then returned on normal values at 6 UTC. During this period the Quality and Amplitude have had variations, the latter touching Power 18. The Frequency has started to fluctuate widely again shortly afterwards and this has led to stronger Amplitude movements that have had the maximum at Power 45 at 7:30 UTC. At the time of this update, the Frequency is decreasing again.
- 6/14 17:00 – The most active part of today lasted 7 hours, from 7 to 14 UTC, all the parameters have undergone strong variations as shown in the various graphs, the Frequency has had a profound low while both the Quality and the Amplitude have peaked significantly. Now the situation seems to have calmed down even if the Frequency has not returned to normal values but has remained around 7.60 Hz.
- 6/14 12:30 – After the previously reported peak, which remained at that value for about 20 minutes, the Amplitude continued the steep climb to reach Power 82 at 11:30 UTC. Quality also had great variations, continuing the gradual increase that began at 4 UTC. The Frequency during this last phase remained at extremely low levels, below 7.30 Hz, an indicator that activity is continuing.
- 6/14 10:30 – From 3 UTC the Frequency started to oscillate causing some movements of the Amplitude that went close to Power 30 twice. Shortly after 5 UTC the Frequency, after reaching the maximum of 8.05 Hz, began a sharp drop until it reached , at 9 UTC, the minimum of the last 3 days at 7.25 Hz, at the same time there have been oscillations and an increase in Quality and a rapid increase in Amplitude which has reached the maximum value so far of Power 40.
- 6/13 17:00 – If we had to recap the duration of the activity we would have to say that is ongoing since 3 days, the last part of today though, the most intense part, started at 5 UTC, when the Frequency in its descent went below 7.60 Hz and ended just before 16 UTC . The average for this period was higher than Power 30.
- 6/13 15:30 – A new powerful peak, occurred shortly after 14 UTC, has brought the maximum value of today even higher reaching Power 73, this new surge occurred in the period when the Frequency further dropped below 7.50 Hz. At the time of this update Frequency is slightly rising.
- 6/13 11:00 – The frequency continues to remain very low, just above 7.30 Hz, the Quality continues in the wide oscillations and the Amplitude too, in the last 2 hours from 9 to 11 UTC we have had three significant peaks, Power 61, Power 52 and Power 54.
- 6/13 08:30 – Intense continuous activity, Power 71 was reached at 7:45 UTC in correspondence with the minimum frequency of 7.32 Hz.
- 6/13 07:30 – There was no break in the activity, the maximum calm we had was at the turn of the local midnight, from 15 to 19 UTC. As we noted in the previous update, the Frequency had remained low and this continued to lead to fluctuations in both Quality and Amplitude, the latter between Power 25 and 30. From 4 UTC the Frequency began a gradual further drop to reach values below 7.45 Hz and shortly thereafter there was a sudden increase in Amplitude which in 2 hours, at 7 UTC, reached Power 59.
- 6/12 20:30 – From the new graphs we can see once again that the Frequency continues to oscillate on tendentially low values, between 7.60 and 7.70 Hz, this together with the continuing oscillations of the Quality seem to have given rise to a peak of Amplitude that has reached Power 29 at 19 UTC.
- 6/12 17:00 – Today’s activity lasted about 9 hours, from 6 to 15 UTC. In this phase the amplitude peaks did not reach very high values but there were strong fluctuations in Quality especially in the last part, from this the most intense coloring of the main graph, even if the amplitude reached only Power 19.
- 6/12 12:30 – The Frequency started to decrease at 6 UTC after reaching the maximum of 8.01 Hz, it underwent many oscillations every time reaching a lower value down to the minimum of 7.33 Hz at 11 UTC. The Amplitude has followed this drop, gradually increasing also from 6 UTC with ever increasing peaks that reached the maximum value at 11 UTC with Power 27. Quality also had movements.
- 6/11 17:00 – After the previous movements that had the maximum at Power 32, a period of very low activity started very suddenly. The Frequency has continued to oscillate around 7.60 Hz and there have also been fluctuations in the Quality, the Amplitude during this period has remained below Power 10. At the time of this update, the frequency is around 7.50 Hz.
- 6/11 12:00 – The activity is continuing and so far has been steadily and gradually increasing. The maximum values in the last hours were Power 28 at 10 UTC and Power 32 at 11:30 UTC. At the same time, there were also several peaks in Quality while the Frequency continues to remain basically low with the possibility that the activity continues.
- 6/11 08:00 – From the graphs we can see how the Frequency has remained around 7.60 Hz since yesterday, this has led to a certain ‘instability’ with slight movements of Amplitude and Quality. The highest values were reached by two isolated peaks at 21 and 23 UTC yesterday and were around Power 17. At the time of this update the Frequency remains low while the Quality is having wide oscillations, the Amplitude is gradually increasing.
- 6/10 14:00 – Total calm, the Frequency is trending below 7,70 Hz.
- 6/10 14:00 – All is back to normal, very light activity .
- 6/10 13:00 – The TSU website is down (host unavailable) so we do not have the usual data from this source. Above the chart from an alternative source while we wait.
- 6/10 10:00 – The new graphs show that since yesterday afternoon the Frequency began a slow and gradual rise up to exceed the base value and reach and stabilize around 7.90 Hz, this trend was interrupted at 5 UTC when a rapid change in Frequency has also led to movements in the Quality and Amplitude that reached Power 27. After this isolated peak, the Frequency returned to its increasing trend and the other parameters returned to normal.
- 6/9 17:00 – Today’s activity period lasted for about 9 hours, from 5 to 14 UTC, the most intense phase was around 10 UTC when the maximum value of Power 62 was reached.
- 6/9 13:00 – Frequency has tended to be low and Amplitude and Quality movements have continued, a new peak at Power 31 occurred at 11:30 UTC while variations continue.
- 6/9 11:30 – After a first phase that produced the maximum at Power 40 as previously reported, a new ascent of the Amplitude took place from 8 UTC. This within two hours led to the peak of Power 62 at 10 UTC. At the time of this update we are around Power 45.
- 6/9 07:30 – The complete calm lasted only few hours, about 5 from 16 to 21 UTC yesterday, after which the Quality movements began, giving a light green coloring to the main graph, around 4 UTC the Frequency began to gradually decrease with large and rapid changes and soon the Amplitude has started to follow. From 5 UTC the Amplitude started to increase to Power 25, Power 31 and Power 40 in rapid succession with the last peak occurred just before 7 UTC.
- 6/8 17:00 – In what we might call the second period of activity, from 12 to 16 UTC, the most intense phase was around 14 with Power 37. The Frequency at the time of this update is leaving the low values around 7.50 Hz rising back.
- 6/8 14:00 – The low Frequency condition lasted one hour, from 12 to 13 UTC and within that we had the spike at Power 14.
- 6/8 13:00 – The Frequency dropped to today’s minimum of 7.37 Hz possible start of new spikes.
- 6/8 12:00 – The first period of activity seems to have gone into a temporary stop at 12 UTC even if the Frequency remains at basically low values and therefore foreshadowing other movements. These movements that we saw lasted about 4 hours, from 8 to 12 UTC and the highest value was Power 45 at 9:30 UTC.
- 6/8 09:30 – Frequency is slowly decreasing and Amplitude just passed Power 30.
- 6/8 09:00 – The new graphs show a period of calm that began yesterday at 15 UTC and ended at 6 UTC today when more marked oscillations of the Frequency started. As they became more significant, movements began as well in both Quality and Amplitude which reached Power 10 at the time of this update.
- 6/7 17:00 – Today’s activity lasted 11 hours, from 3 to 14 UTC, the part with the greatest peaks was between 10 and 11 UTC. For all this time of activity the Frequency has remained in the lower quadrant to rise slightly towards the end of the graph. From 7 to 12 UTC the Amplitude remained constantly above Power 47. The situation is now calm.
- 6/7 13:00 – As we can see from the graphs, the movements continued and with even higher values, Power 76 was reached at 10:30 UTC in correspondence with a further drop in the Frequency down to 7.31 Hz. The Frequency remains on low levels so other movements are likely.
- 6/7 10:00 – After the movements previously reported, the maximum values reached by the Amplitude continued to increase; after about an uninterrupted hour above Power 50, at 9 UTC a new high is recorded at Power 69. This simultaneously with wide oscillations of the Frequency.
- 6/7 08:00 – The strong activity that is currently underway began at 3 UTC when the Frequency started to drop steeply until it reached today’s minimum value of 7.40 Hz shortly after 5 UTC. Amplitude started to rise from 4 UTC with constantly increasing peaks until it reached what is the maximum so far, Power 61 at 7 UTC.
- 6/6 17:00 – The day shown so far has passed with very light and scattered movements for the most part, the highest value was Power 13 shortly after 6 UTC with other variations around Power 10 at 11 and 14 UTC. A sudden drop in Frequency around 16 UTC was followed shortly thereafter by a flicker of Amplitude, at the time of this update reached today’s maximum of Power 14 at 16:30 UTC.
- 6/6 08:00 – After a fairly long period of calm, slight movements began at 3 UTC with a drop in the Frequency below 7.60 Hz, this led to Amplitude oscillations that gradually increased until they exceeded Power 10 shortly after 10 UTC, Quality also started to fluctuate in the same period.
- 6/5 20:30 – Another day of scattered peaks, the first isolated movement was at 23 UTC yesterday evening and reached Power 20, a second peak at 3 UTC reached Power 30, accompanied by a rapid drop in frequency which immediately returned to normal values. The more consistent Frequency oscillations began again just before 6 UTC and, together with Quality movements, led to a series of Amplitude peaks around Power 17; this condition lasted about three hours, until 9 UTC. Since then the movements have lost vigor until they reach calm at 17 UTC.
- 6/4 20:30 – Today’s movements were isolated and scattered throughout most of the day, the maximum peaks occurred between 6 and 7 UTC and reached Power 28. Another period of activity, which reached Power 17, occurred between 10 and 12 UTC when the Frequency has reached today’s minimum value of 7.40 Hz.
- 6/3 22:00 – Today’s activity lasted about 8 hours, from 5 to 13 UTC, a period during which the Frequency reached the minimum of 7.27 Hz and corresponded to the maximum Amplitude peak at Power 46 at 17:34 local time, i.e. 12:34 UTC. The situation then calmed down considerably.
- 6/2 17:00 – The activity previously reported remained limited in three hours, from 6:30 to 9:30 UTC, after the peak at Power 60 at 7 UTC there were other movements that had the maximum around Power 28. The minimum Frequency value occurred at 8:30 UTC with 7.34 Hz after which it returned to rise to stabilize, in the last hours, around 7.70 Hz.
- 6/2 08:00 – Today the activity started at 6 UTC with the Frequency that began a rapid drop, ongoing at the time of this update, passing 7.50 Hz at 7 UTC, the Amplitude began to rise shortly after the initial Frequency drop, at 6:30 UTC, to reach Power 60 at 7.
- 6/1 17:00 – Today’s activity can be divided into two parts, the first from 3 to 12 UTC with medium-sized peaks was followed by a break lasting about 4 hours, until 15 UTC when a rapid dip in the Frequency, that reached 7, 42 Hz, pushed the Amplitude up to Power 68, reached at 16:20 UTC. At the time of this update, the frequency is rising around 7.70 Hz.
- 6/1 10:00 – The new graphs show a period of calm from 16 to 23 UTC, during this period all parameters have remained on normal levels. From midnight UTC the frequency started a slow and constant drop along with wide fluctuations in the Quality, the Amplitude also started to move toward the Power 30 threshold at 4:30 UTC, the Frequency reached the minimum value of 7.25 Hz at 6 UTC in correspondence with the maximum amplitude reached so far at Power 36. After these movements the Frequency remained below 7.50 Hz and variations in both Quality and Amplitude continued, the latter remaining around Power 20.
Frequency means how many wave cycle happen in a second, 1 Hz. means 1 cycle per second, 40 Hz. means 40 cycles per second, Amplitude is the size of the vibration, how big is the wave, the chart shows the frequency variation in Hz and the amplitude using the white color.
Note
The Ancient Indian Rishis called 7.83 Hz the frequency of OM. It also happens to be Mother Earth’s natural heartbeat rhythm Schumann resonances are named after professor Schumann who was involved in early German secret space program and was later paper-clipped into the United States. The frequencies of Schumann resonances are fairly stable and are mainly defined by the physical size of the ionospheric cavity. The amplitude of Schumann resonances does change and is bigger when ionospheric plasma gets excited. Ionospheric plasma excitation happens because of solar activity, thunderstorms, use of scalar plasma weapons and HAARP and lately also when the Light forces are clearing the plasma anomaly.
Schumann Resonance Today – Energy of Consciousness Currents
Show entriesSearch:
| Time UTC +7 | Amplitude | Quality | A+Q | Freq. | Base Freq. | Delta | ECC Increase | TOTAL ECC |
|---|---|---|---|---|---|---|---|---|
| 04/05/2020 18.00.00 | 91 | 5 | 96 | 7,91 | 7,83 | 0,08 | 8 | 104 |
| 03/05/2020 07:00:00 | 81 | 7 | 88 | 7,28 | 7,83 | 0,55 | 48 | 136 |
| 01/05/2020 07:00:00 | 58 | 8,08 | 66,08 | 7,53 | 7,83 | 0,3 | 20 | 86 |
| 30/04/2020 21:15:00 | 90 | 7,46 | 97,46 | 7,36 | 7,83 | 0,47 | 46 | 143 |
| 29/04/2020 17:00:00 | 76 | 6,91 | 82,91 | 7,31 | 7,83 | 0,52 | 43 | 126 |
| 23/04/2020 10:00:00 | 138 | 4,74 | 142,74 | 7,42 | 7,83 | 0,41 | 59 | 201 |
| 19/04/2020 14:45:00 | 88 | 6,49 | 94,49 | 7,25 | 7,83 | 0,58 | 55 | 149 |
| 18/04/2020 16:15:00 | 110 | 7,21 | 117,21 | 7,26 | 7,83 | 0,57 | 67 | 184 |
| 18/04/2020 14:00:00 | 90 | 7,22 | 97,22 | 7,34 | 7,83 | 0,49 | 48 | 145 |
| 18/04/2020 12:00:00 | 81 | 10,9 | 91,9 | 7,24 | 7,83 | 0,59 | 54 | 146 |
Showing 1 to 10 of 67 entriesPreviousNext
Schumann Resonance Today – Energy of Consciousness Currents Posts

Dna Enhancement Thru Sound And Light

Powerful Blasts Of Light – A Reminder Of The Transformative Times!

Understanding The Original Yogas
Schumann Resonance PDF Archives
Images Archive
All the SR daily images in one single page See the Images


Explanation of The Chart
The Schumann Resonance Spectrogram Chart
The Schumann Resonance Chart displays data from the magnetic field detector to monitor the resonances occurring in the plasma waves constantly circling the earth in the ionosphere. These three days spectrograms show the activity occurring at the various resonant frequencies from 1 to 40 Hz. Within the spectrogram, the power, or intensity level of each frequency is displayed as a color, with white being the most intense. The Schumann Resonances appear as the horizontal lines at 0.0, 4.0, 8.0, 12.0, 16.0, 20.0, 24.0, 28.0, 32.0, 36.0 & 40.0 Hz. This chart is based on Tomsk, Russia, time UTC +7 (UTC = Universal Time Coordinated).
What is a Spectrogram?
The Spectrogram Calendar is a visual representation of the range of frequencies in the magnetic field at a given location. Similar to how an equalizer displays the frequency content of music played on your stereo, the spectrogram calendar displays the frequency content of a magnetic field. Instead of showing a brief snapshot, it shows changes over a period of time, in this case 3 days.
The local magnetic field is a dynamic field that changes constantly because of variations in the ionosphere and sun and many other influences not yet fully understood. The range of variation displayed in the spectrogram chart is from 0 to 40 cycles per second. The vertical axis is frequency and the horizontal axis is time. The amplitude of a particular frequency at a specific time is represented by the intensity of color (green, yellow, white) of each point in the image.

What is the Schumann Resonance?
The Herathbeat of Planet Earth Read
Clicks on the Ads Keep Us Alive 🙂

Conversion
Life sets aside moments of joy and years of pains. It’s better you convert the moments in hours and the years in minutes.
Costantino Rozzi