Editor’s Note: What a great idea! Disclosure News Italia, based out of Italy, is now featuring a daily “News Blast”! This will be a way for ALL to know about news emanating from any area of the globe.
Humanity needs to learn what’s goin’ on globally since truthful news is being so suppressed by the Dark. Please read this (hopefully) on-going commentary on truth, and BE…
Thursday August 22nd News BlastOverstock CEO Patrick Byrne resigns amid
‘deep state’ controversy In interviews he claims:- FBI heads acted
outside the FBI to…
by Disclosure News | Updated on 25 June, 2019 | Disclosure | The
Disclosure News Forum Is Born! The Disclosure News Forum Is Born! It
seemed to us that there was a need for a system of exchange of opinions
and comments that would surpass in practicality, immediacy and ease of
use the normal comment system of the site, so we…
by Disclosure News | Updated on 11 June, 2019 | Disclosure | The
Islands and Their ExpressionsMessage from The Pleiadians – Part 3
Islands and Their Expressions – Message from The Pleiadians. By Gabriel
RL. November 2017The Pleiadians report that there is a great movement
of the type “Galactic Blitz”,…
by Disclosure News | Updated on 10 June, 2019 | Disclosure | Yaldabaoth
and Advanced Technologies Yaldabaoth and Advanced Technologies.By
Gabriel RL. The Pleiadians are here with your Bulletin and I, Gabriel
RL/Neva, will ask you some more direct questions to them. Clicks on the
Ads Keep Us Alive
Editor’s Note: how are you feeling today? Last night, the Earth emitted intense Schumann Resonance energies in sort and sharp bursts from 11:00 PM until 3:00 AM EDT. While I slept like a baby, my mother experienced a sequence of negative dreams.
If you were “bothered” by these energies, my advice is to pull back and become an “observer” of what’s going on in your life. You may be surprised, and of course, BE…
Schumann Resonance Today. We will
try to keep you updated about the variations of the Resonance with this
page. The great variations that nobody can explain but that give us a
clear sign that the planet is changing. The Earth is vibration higher
and higher, just like us!
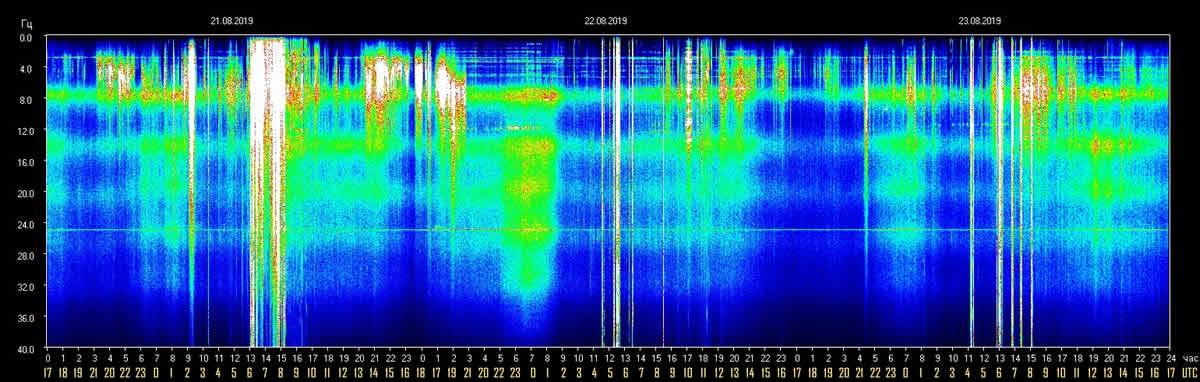
The Chart time is based on Tomsk – Russia – UTC +7Source
8/23 17:00 UTC – Today’s significant activity was concentrated in
about 5 hours, from 4 to 9 UTC, during this period there were 3 peaks
30, 27 and 25 Kek. After this phase of movement, some latency has
remained.
8/22 17:00 UTC – Even today a sort of continuous but scattered
activity, shortly after midnight on the chart, 17 UTC, there were
variations in amplitude dependencies of a SR frequency of 24 Hz (this
for purists who say that the amplitude does not expresses in Hz). A
further peak (… … … ….) 34 Hz occurred at 12:30 UTC and marked the
beginning of a minor activity that seems to have ended at 17 UTC.
8/21 17:00 UTC – After the peaks previously reported, the situation
gradually returned to normal, only a small flicker at 14 at 13:30 UTC.
8/20 17:00 UTC – The light activity we saw yesterday did not stop
and in this new chart we see that it began to intensify since 20 UTC
yesterday to then generate a significant first peak at 2 UTC which
reached 36 Hz. A few hours later, at 6 UTC, has begun what so far is the
strongest activity of the last few days which led immediately to a peak
of 46 Hz followed by 44 Hz at 7:45 UTC.
8/20 17:00 UTC – Today was characterized by a continuous light
background activity that had its isolated peaks at 37 and 26 Hz at 4:45
and 10:30 UTC respectively.
8/19 17:00 UTC – Another calm day, there were some variations on 10 Hz around 4 and 9 UTC.
8/18 17:00 UTC – Calm.
8/17 17:00 UTC – For the 17th of the month, as often happened, there
was a bit of entertainment with this representation created by this
series of peaks, each lasting about 30 minutes, of a series of bars …
Regarding the values , the 57 Hz previously reported remained the
highest.
8/17 12:00 UTC – Significant activity began this morning at 6 UTC.
The variations have been increasing with peaks at 22, 30, 35, 46 and 57
Hz. The latter occurred shortly after 11 UTC.
8/16 17:00 UTC – A further modest isolated peak occurred at 11:30
UTC with 15 Hz. This interrupted the calm condition that returned soon
after.
8/16 11:30 UTC – Today’s activity until now resulted in 3 isolated
peaks, all around 23 Hz, occurred at 5, 6 and 7:30 UTC. Apart from these
variations it was a condition of calm.
8/15 17:00 UTC – After the peak at 33 Hz the amplitude slowly began
to decrease with peaks always decreasing until reaching normal values at
13 UTC.
8/15 11:00 UTC – Today’s first peak was at 22 Hz at 5:30 UTC and
marked the beginning of today’s variations. A second isolated peak
reached 33 Hz at 8 UTC.
8/14 17:00 UTC – Today’s activity is similar to that of yesterday,
only that it was longer, from 2 to 12 UTC. The maximum peaks were 35 and
37 Hz at 6:30 am and 8:30 UTC.
8/13 17:00 UTC – After the peaks described previously, the variations in amplitude decreased until calm was reached at 13 UTC.
8/13 10:30 UTC – Today is presenting us a medium activity in
progress with variations in the amplitude of the Resonance that started
at 4 UTC. The first peaks were on 25 Hz while the one that is the
highest until now has reached 37 Hz at 7:30 UTC. A further intense peak
reached 32 Hz at 9:30 UTC.
8/12 17:00 UTC – Today there was a light and sparse activity, in the
morning UTC peaks occurred at 15 Hz while at 12 UTC there was a strong
isolated peak at 47 Hz.
8/11 17:00 UTC – Today’s significant movements began around 7 UTC
and soon led to the first of two today’s peaks, 32 Hz at 8 UTC. The
second and greatest peak today was 36 Hz at 9:20 UTC. In total this more
intense phase lasted about 3 hours.
8/10 17:00 UTC – The day continued with rising peaks that after
those reported previously continued until reaching today’s high of 35 Hz
at 10:45 UTC. From 12:30 UTC the situation is calm.
8/10 11:00 UTC – Also today we’re having medium activity, started at
5 UTC. The peaks occurred with amplitude increasing values, from 20 Hz
up to what is the highest until now, 30 Hz at 9:20 UTC.
8/9 17:00 UTC – Dopo il picco riportato in precedenza l’attività è andata calando fino alla calma.
8/9 15:30 UTC – Still light activity, from around 10 UTC very slight
variations have started but have led to a peak at 39 Hz at 14 UTC.
8/9 11:00 UTC – After the powerful peak yesterday the activity
remained calm until 4 UTC today when movements created two consecutive
peaks at 20 Hz. After this slight activity the situation became calm
again.
8/8 17:00 UTC – Today’s activity lasted for about 10 hours, from 6
to 16 UTC. The maximum peak is the one reported previously. Now the
situation is calm.
8/8 14:00 UTC – Today’s graph shows the sudden start of a strong
activity started at 8 UTC, within 30 minutes the maximum peak was
reached at 74 Hz. The movements are continuing with other peaks around
30 Hz.
8/7 17:00 UTC – Today there are only 3 isolated and moderate peaks,
the first at 6:45 UTC at 19 Hz, the second at 7:20 UTC at 15 Hz and the
third and last at 8 UTC at 10 Hz. Before and after these peaks was calm .
8/6 17:00 UTC – Not much to report today, the activity was
concentrated around midnight UTC with a maximum peak at 11 Hz at 00:30
UTC.
8/5 17:00 UTC – The resonance remained at a constant level of
background, from the amplitude graph we note that there is never really a
calm like yesterday. It probably has something to do with the moderate
Geomagnetic Storm (see Space Weather) currently underway with KPI 5.
8/4 17:00 UTC – Light activity from 9 to 12 UTC with two peaks at 19 and 16 Hz.
8/3 17:00 UTC – Calm from 13 UTC.
8/3 09:30 UTC – Yesterday’s light activity, which started just
before the 24 hours of the chart corresponding to 17 UTC, continued
until 19 UTC and the amplitude slightly exceeded 10 Hz. This was
followed by another activity from 00 UTC today and the highest peak at
41 Hz occurred soon after, at 00:20 UTC. Another spike at 40 Hz followed
at 9 UTC.
8/2 17:00 UTC – Today the activity was concentrated in 6 hours, from
2 to 8 UTC, the maximum peak was the one described above. In the last
part of the trip reported, from 14 UTC a constant started but for now
light activity.
8/2 08:30 UTC – Today we are witnessing what appears to be the
beginning of a significant phase of activity, it started at 2 UTC and is
continuing. After a first peak at 29 Hz at 3:30 UTC, a much higher
spike followed reaching 68 Hz at 4:15 UTC.
8/1 17:00 UTC – We returned to a light activity, the significant
part took place from 6 to 12 UTC with the maximum peak of 27 Hz at 7:40
UTC.
Frequency means how many wave cycle happen in a second, 1 Hz.
means 1 cycle per second, 40 Hz. means 40 cycles per second, Amplitude
is the size of the vibration, how big is the wave, the chart shows the
frequency variation in Hz and the amplitude using the white color.
Note
The Ancient Indian Rishis called 7.83 Hz the frequency of OM. It also happens to be Mother Earth’s natural heartbeat rhythm
Schumann resonances are named after professor
Schumann who was involved in early German secret space program and was
later paper-clipped into the United States. The frequencies of Schumann resonances are fairly stable and are mainly defined by the physical size of the ionospheric cavity.
The amplitude of Schumann resonances does
change and is bigger when ionospheric plasma gets excited. Ionospheric
plasma excitation happens because of solar activity, thunderstorms, use
of scalar plasma weapons and HAARP and lately also when the Light forces
are clearing the plasma anomaly.
Dependencies of Amplitudes Schumann Resonance August 23 2019
Dependencies of Quality Schumann Resonance August 23 2019
Dependencies of Frequency Schumann Resonance August 23 2019
All the SR daily images in one single pageSee the Images
Explanation of The Chart
The Schumann Resonance Spectrogram Chart
The Schumann Resonance Chart displays data from the magnetic field
detector to monitor the resonances occurring in the plasma waves
constantly circling the earth in the ionosphere. These three days
spectrograms show the activity occurring at the various resonant
frequencies from 1 to 40 Hz. Within the spectrogram, the power, or
intensity level of each frequency is displayed as a color, with white
being the most intense. The Schumann Resonances appear as the horizontal
lines at 0.0, 4.0, 8.0, 12.0, 16.0, 20.0, 24.0, 28.0, 32.0, 36.0 &
40.0 Hz. This chart is based on Tomsk, Russia, time UTC +7 (UTC =
Universal Time Coordinated).
What is a Spectrogram?
The Spectrogram Calendar is a visual representation of the range of
frequencies in the magnetic field at a given location. Similar to how an
equalizer displays the frequency content of music played on your
stereo, the spectrogram calendar displays the frequency content of a
magnetic field. Instead of showing a brief snapshot, it shows changes
over a period of time, in this case 3 days.
The local magnetic field is a dynamic field that changes constantly
because of variations in the ionosphere and sun and many other
influences not yet fully understood. The range of variation displayed in
the spectrogram chart is from 0 to 40 cycles per second. The vertical
axis is frequency and the horizontal axis is time. The amplitude of a
particular frequency at a specific time is represented by the intensity
of color (green, yellow, white) of each point in the image.
There
are only two days in the year that nothing can be done. One is called
Yesterday and the other is called Tomorrow. Today is the right day to
Love, Believe, Do and mostly Live.
Dalai Lama
Share this: Send the word out using these buttons!