Thirty thousand Boeing employees on Wednesday must start taking vacation or sick time, or apply for unemployment, after the region’s largest private employer decided Sunday to keep its Puget Sound plants closed indefinitely. The workers had been paid during the initial two-week work stoppage that began March 25 but told employees Sunday in an email it “is extending the temporary suspension of operations at all Puget Sound area and Moses Lake sites until further notice.” Boeing has roughly 70,000 employees in the state. The decision affects about 30,000 of them, mostly production workers.
After being admitted to the hospital over the weekend, UK Prime Minister Boris Johnson has been taken to intensive care as his condition has apparently worsened dramatically overnight.
The coronavirus pandemic has generated overwhelming support for the closure of markets selling illegal wildlife across Southeast Asia, an epicenter of the multi-billion-dollar trade, the World Wildlife Fund said in a public opinion poll on Monday Apr 6. About 93 per cent of about 5,000 people surveyed by WWF in March across three Southeast Asian nations as well as Hong Kong and Japan said unregulated markets selling wildlife should be shuttered to ward off future pandemics.
Hong Kong extended its airport closure to foreign arrivals indefinitely as the number of coronavirus infections surpassed 900 and a leading microbiologist called for an emergency law requiring all residents to wear masks in public.
Iranian Parliament’ Research Center has warned that the government’s delay in extending financial support to low-income people hit by the coronavirus outbreak may entail “painful consequences.” In an elaborate allusion to the possibility of dissent and protests in Iran, the report charged that what President Hassan Rouhani’s administration has done so far to support “the poor and vulnerable people” has been “belated, passive and non-proactive.” The report further warned that the continuation of this situation will end vulnerable people’s toleration and may lead to other painful events.
If you use Apple iPhone or MacBook, here we have a piece of alarming news for you. Turns out merely visiting a website — not just malicious but also legitimate sites unknowingly loading malicious ads as well — using Safari browser could have let remote attackers secretly access your device’s camera, microphone, or location, and in some cases, saved passwords as well. Apple recently paid a $75,000 bounty reward to an ethical hacker, Ryan Pickren, who practically demonstrated the hack and helped the company patch a total of seven new vulnerabilities before any real attacker could take advantage of them.
Google has released its mobile phone users’ location data for 131 countries, hoping that the trove will show whether people are obeying the world’s various lockdowns and social distancing measures. It may be the world’s largest such data dump available to the public and covers a span from mid-February to the end of March. The results are varied. Italy for example has seen a drop in traffic to places like shopping centers and recreational areas by 94% compared to the same time last year. California though, the first state in the U.S. to impose a lockdown, has only seen a drop by half. Arkansas is the lowest American state, with only a 29% drop. The data also shows surges in activity at parks and grocery stores in some countries, such as the UK. Google says the info is anonymous — without names, locations of individuals, or other personal info — hoping to allay privacy concerns. But it declined to say whether any authorities had requested more info. Facebook is also sharing some location data with researchers and governments, but has not made their findings public.
U.S. farmers have destroyed millions of pounds of perishable food like tomatoes, lettuce and green beans because growers lost a vast number of customers after the coronavirus pandemic struck. “It’s a catastrophe, it really is,” said Tony DiMare, a long-time tomato grower based in Palm Beach County, Fla. DiMare said he let 10 million pounds of tomatoes rot on the farm in a region south of Miami because no market existed for them.
The British Open has been cancelled for the first time since World War II due to the coronavirus. The 149th Open was scheduled to take place at Royal St George’s Golf Club in Kent in July.
Migrant workers living in vast Singapore dormitories cut off from the outside world due to the coronavirus outbreak fear their cramped and squalid quarters are fast becoming a hotbed for infection. Singapore on Sunday said it had quarantined nearly 20,000 workers in two dormitories, made up of mainly Bangladeshi and other South Asian manual workers, after they were linked to at least 90 infections. The government said the action was needed to prevent broader transmission in the city-state – which is closing schools and offices this week due to a spike in cases – and said it had taken measures to reduce worker interaction in the dormitories and ensure they received salary, meals and medical support.
Forest activists claimed they had observed more cases of deforestation in the Prey Lang area, in Cambodia, than before the Covid-19 outbreak. They alleged that three companies had sent workers to log and transport timber with no crackdown by the relevant authorities. An activist in Stung Treng province, told that the three firms – Think Biotech (Cambodia) Co Ltd, Angkor Plywood, and Thy Nga Co, Ltd Development – had sent workers to log and haul timber to a factory near the area before transporting the sawn wood to a major company. “Those who transport timber from the Prey Lang forest are not afraid of virus infection. I’ve seen between 10 and 20 vans hauling timber to Angkor Plywood per day.
Comet ATLAS is fading. New data from astronomers around the world show that the once-promising comet is beginning to fade. Is Comet ATLAS doomed? Not necessarily. “The frustrating thing about comets is we often don’t know exactly what they’re doing or why they’re doing it. There’s still a chance that Comet ATLAS is just ‘taking a breather’ before another outburst.”
Tonga’s Police have continued to massively target drug dealers and suppliers during the national lockdown, conducting eight drug-related arrests last week. All eight were for possession of methamphetamine and cannabis and were men aged between 26 and 49. Police seized 1.67 grams of meth, “nearly” 21 grams of cannabis as well as drug utensils and more than $US255 in cash.
A Hungarian tourist who died of Covid-19 in Thailand had earlier withheld details of his visits to entertainment areas, which resulted in 112 medical staff being suspended from work and placed in quarantine. Dr Chalermpong Sukhonthapol, director of Vachira Phuket Hospital, revealed the details at a meeting of provincial officials in charge of combating the disease on Monday. He said the Hungarian man was involved in a road accident on March 25. He was first treated at Chalong Hospital and then transferred to Vachira Phuket Hospital. The patient had numbness and weakness in all limbs. He could talk, but did not mention his activities had put him at risk of Covid-19 infection though being asked.
Solar Activity
Solar wind flowing from this minor coronal hole could reach Earth on April ~10th.
Active Weather
Severe Tropical Cyclone Harold (Category 4) w/v 120kts – 924hPa- East of Vanuatu moving SE.
Strongest EQ in Europe M3.3 Greece Strongest EQ in North America M3.4 Alaska Strongest EQ on the Planet M5.0 Sinabang, Indonesia Deepest EQ M4.3 222 km Molucca Sea News Burst 7 April 2020
Share this: Send the word out using these buttons!
Editor’s Note: Well…all quiet on the western front, all fronts of Earth actually. This is a distinct difference from the significant appearance of Schumann Resonance energies on April 4/5. (All times EST, USA).
Let’ use this energetic “down time” to Pause. Breath. Relax. Even though our world is mid-stroke in changing, practice holding higher and better thoughts (yes, really!) in order to practice BEing in…
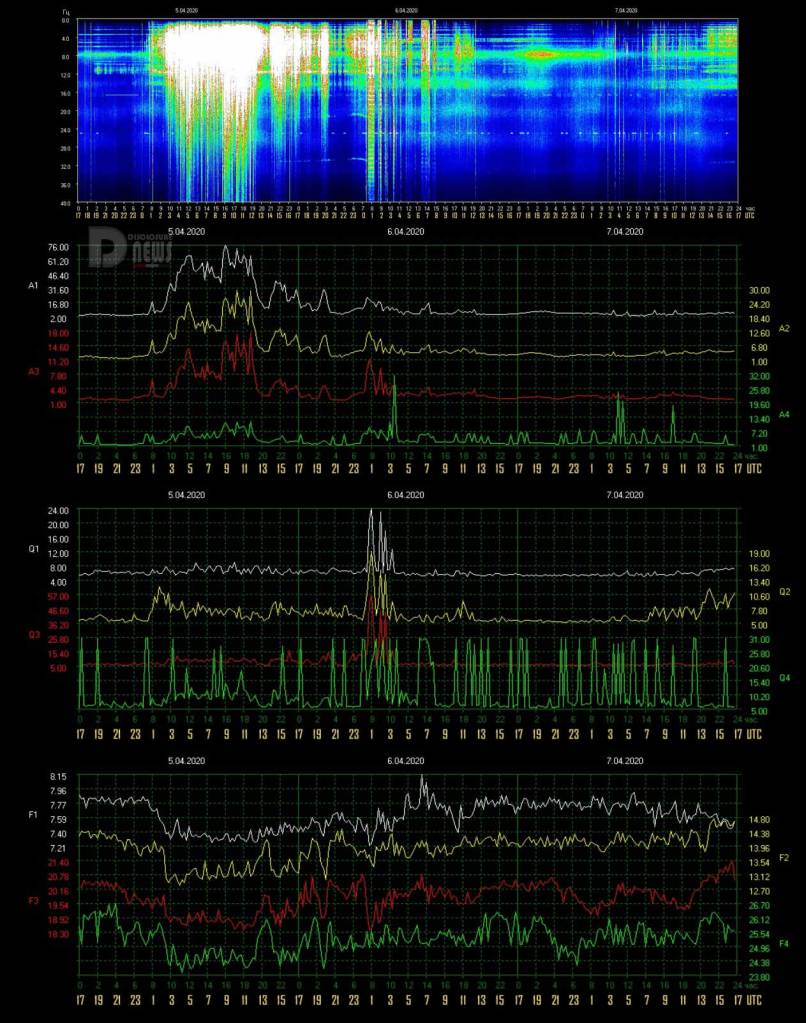
10 Schumann Resonance Today. We will try to keep you updated about the variations of the Resonance with this page. The great variations that nobody can explain but that give us a clear sign that the planet is changing. The Earth is vibration higher and higher, just like us!
The Chart time is based on Tomsk – Russia – UTC (Universal Time Coordinated) +7Source
RS Base Frequency 7.83 Hz.
Schumann Resonance Today Peaks:
“Every second, a multitude of pulses travel around the world in this unique, resonant chamber between Earth and the ionosphere, sending colluding signals to all microorganisms. These signals couple us to the Earth’s magnetic field. Named after their discoverer, these Schumann Resonances (SR) drive the harmonizing pulse for life in our world.” Eric Thompson
4/07 17:00 – The first part of today’s graphs show a calm condition with isolated slight movements around Power 10. From 13 UTC some movements of Quality and Frequency have started which have given a more intense coloring to the main graph and which would seem to suggest some incoming movement also in Amplitude.
4/07 08:00 – We are in a condition of almost calm, some isolated movements between 3 and 5 UTC have again reached Power 10
4/06 22:30 – The new charts show an almost calm situation, a slight promontory has brought amplitude to Power 10 at 20 UTC.
4/06 17:00 – Today was characterized by the tail of yesterday’s activity as well as new movements which, although they did not reach high Amplitude values, saw both the frequency and the Quality fluctuate significantly. Each of the 3 values, Quality, Amplitude and Frequency, have had variations at different times, first the Amplitude at Power 31, then the Quality with a strong oscillation from 1 to 3 UTC and then the increase in Frequency to 8.15 Hz between 6 and 7 UTC, in short, a very busy day.
4/06 08:30 – There has been no calm, just a decrease in the amplitude of the variations. The new graphs show a fluctuating situation with Power 31 which was reached at 19 UTC yesterday, followed by a sort of pause that ended at 24 with a movement at Power 22. This movement coincided with significant changes in Quality. and Frequency. At the time of this update, at 7 UTC, there has been a peak at Power 17.
4/05 23:30 – The movements slowed down for about 2 hours until 22 UTC when there is a slight increase towards Power 10. Interestingly, the Frequency is taking much longer to return to the usual values around 7.8 Hz. as shown in the above image. The drop has started a little after midnight UTC today so we are approaching the full 24 hours during which it has remained far below the normal 7.83 value.
4/05 19:30 – The activity decreased gradually in intensity and the new graphs show the descent down to values lower than Power 10. This is coupled with the slow increase in the frequency from just above 7 Hz to ‘normal’ values. It should be noted that in India at 15:30 UTC there was the switching off of the electric lights for 9 minutes with the lighting of candles or other sources of light and a sort of prayer, the Indians in total are more than a billion.
4/05 17:00 – To summarize today’s chart, the activity started at 1 UTC and 16 hours of strong activity that is still ongoing. At 16 UTC the amplitude returned below Power 30 going down to Power 17. The movements are continuing between Power 20 and 30. The frequency instead remains around 7.2 slightly rising.
4/05 15:30 – After a gradual series of peaks descending from Power 76 to Power 64, reached at around 12 UTC, a rapid decline began which at 14 UTC brought the amplitude to Power 10. This condition did not last long as shortly after the values started to increase to return around Power 40 at 14:30 UTC, remaining almost steady on this value until the time of this update.
4/05 11:30 – Starting from 8:30 UTC it seems that an even more intense phase has begun in which the amplitude of the variations has remained practically always above Power 60. The significant new peak at Power 74 occurred at 10:20 UTC and at the time of this update we are above Power 60. From the Frequency graph it can be seen that a sharp drop, bringing the frequency to around 7.2 Hz, started at 1 UTC and there remained for 10 consecutive hours.
4/05 10:00 – As mentioned earlier, from 3:30 am UTC the Amplitude has remained above Power 40 and we are still in this condition, so it is about 7 hours. An even more powerful phase began around 8:30 UTC and generated the maximum peak, so far, of Power 76. At the time of this update we are around Power 50 apparently rising. As can be seen from the ECC Table below, the maximum values recorded today exceed ECC 100, statistically speaking on February 27, 2020 we recorded an ECC of 378.
4/05 07:30 – We are in a powerful phase of activity that began with a first isolated peak at 1 UTC and shortly thereafter, around 2 o’clock, a constant growth began which brought the Amplitude above Power 40 a first time at 3:30 UTC. After a slight drop to Power 30 shortly thereafter, from 3:45 UTC until the time of this update we stayed above Power 40 reaching the maximum value so far of Power 65 at 5 UTC. From 4 UTC we are almost constantly above Power 50.
4/04 17:00 – The slight activity of today occurred from 6 to 13 UTC, the maximum peak was the one previously reported. From 1pm it was calm, apart from the usual dotted line of Q4 Quality.
4/04 13:00 – A day that has so far shown few and light movements, the variations began around 6 am UTC with amplitude around Power 10, at 8:40 UTC today’s peak reached Power 14. The slight movements of Quality and Frequency have given a colorful coloring to the main chart.
4/03 17:00 – Today’s strong activity lasted 6 hours, from 7 to 13 UTC. Now we are in a calm condition.
4/03 12:30 – The activity continued and even the increase in the maximum values, at 9 UTC we reached what has so far been the top at Power 49, it was not an isolated peak but embedded in a sequence, lasting about 2 hours from 9 to 11 UTC, in whose amplitude remained constantly above Power 30. A second peak at Power 48 was recorded an hour later, at 10 UTC. At the time of this update we are on Power 30 threshold.
4/03 08:30 – The data have returned and have also filled in the missing part, the graphic result is quite particular and also the detection of Frequency Amplitude and Quality shows a sort of broken line with the values that remain fixed for periods of an hour or more. It is difficult to say whether it is a technical fact and they are really the representation of the movements taking place. We have previously seen this series of dense vertical lines but what we see today is probably unique, like the times in which we find ourselves in. Even the usual 25 Hz line of the Quality Q4 has become more pronounced, almost continuous for a stretch of 4 hours. The amplitude instead records a movement taking place at the time of this update which reached Power 35 at 8 UTC.
4/02 17:00 – There appears to be an interruption in the flow of data that are stuck at 14 UTC, the TSU site works. When they will become available again we will immediately update the situation and the graphs.
4/02 13:30 – After a start to the day that mirrored the previous days with a series of isolated peaks between Power 10 and 15, at 10 UTC there was a powerful increase in activity that led to the maximum value so far of Power 46 at 11 UTC; this strong movement, which has maintained amplitude above Power 30 for about two consecutive hours, appears to have ended at 13 UTC.
4/01 17:00 – Today was characterized by moderate isolated peaks and by the ‘usual’ hatching on 25 Hz, the values were on average between Power 10 and 15, one last movement reached Power 17 at 12:30 UTC.
4/01 10:30 – Once again 10 hours of almost calm, this has been interrupted at 23 UTC yesterday by slight movements around Power 10. These are mostly isolated peaks in sequence and the strongest reached Power 23 just before 7 UTC.
3/31 17:00 – Calm.
3/31 12:00 – In the new graphs can be seen that the “almost calm” lasted 6 hours, from 19 yesterday to 1 am UTC today when new movements started which led to a spike that reached Power 15, this was followed by other variations between Power 10 and 15 until 11 UTC when a new peak has reached Power 28.
3/30 17:00 – The horizontal bands are back while the dotted line generated by Quality remains. The amplitude values, on the other hand, are almost calm.
3/30 14:00 – How long since the last totally calm day? Today the movements once again show moderate activity starting around 4 UTC and continuing with a steady slight increase up to the strongest peak so far at Power 19 at 11 UTC. The dotted line on 25 Hz also continues with what now seem to have become consuetudine, Quality Q4… all these Q should make you think.
3/29 17:00 – Almost calm.
3/29 14:30 – Today’s new activity began very gently after midnight UTC when the amplitude very slowly started a steady increase. The maximum values were of medium intensity, Power 20 was reached at 10 UTC and at 13 the situation returned to calm. The Quality Q4, which has graphically generated a sort of ‘Morse Code’, also appears to be in the subsidence phase.
3/28 23:00 – The new graphs show what apparently seems calm, in reality the dotted line continues on the 25 Hz line due to the dense and continuous variations of the Quality Q4. The intense green coloring on the 8 Hz line seems to be due to the A4 amplitude.
3/28 17:00 – A last isolated movement at Power 29 at 13:40 closes the today’s graph (local timeline) but not the slight movements of the Quality.
3/28 14:00 – What graphically seems to have been the period of the “bands”, from around 1 UTC on 26 March, is apparently closing with the latter peak at Power 45 at 12 UTC today, so just under 3 days when the activity, between ups and downs, it has been practically continuous.
3/28 11:00 – Another day of significant activity, given the situation on the planet, it seems obvious that this could be the case. The first movement, as previously reported, reached Power 30 between 18 and 19 UTC yesterday; the second occurred at midnight UTC, from 11 pm to 1 am, and was the maximum value reached so far, Power 47. The latter was followed by a period of relative calm until 10 UTC when a new leap brought the amplitude at Power 33. A purely personal interpretation of these movements could be the updating of the Etheric DNA, 9 strands are involved which have had one of the many “firmware updates”, this first group was completed at 12; the second group of 8 was completed at 18 and the filament 5, at 7.83 Hz, was done powerfully at midnight UTC. It appears that there are now 4 left.
3/27 21:00 – The activity has steadily and slowly increased since 13 UTC yesterday, with the new charts we see a strong peak that has brought amplitude to Power 30, the movement started at 18 UTC and lasted about 1 hour.
3/27 17:00 – There was a drop in the highs reached but the activity remained significant. A series of variations between 11 and 13 UTC, accompanied by a dive in the frequency, reached Power 20 once again but in this period of time we have been for about an hour and 30 minutes above Power 15. The horizontal bands continue even if with less intensity. Has anyone tried to decipher the Morse Code formed by lines and dots on the Frequency of 25 Hz in the main graph?
3/27 11:00 – No calm today, after the series of “stripes” which have remained at an amplitude around Power 10 some significant movements have interrupted this peculiar “graphic”. The first movements beyond the 10 threshold occurred at 5 UTC with what is the strongest peak so far, Power 26, correlated with a discreet leap in frequency, an increase. Between 7 and 8 UTC it reached Power 20 but even if the amplitude was smaller a strong oscillation of the frequency, a decrease this time, brought the ECC close to the value of the previous peak.
3/26 22:30 – In the new chart we see a rather particular graphic representation consisting of a series of horizontal lines, instead of the usual vertical ones, spaced by a few Hz in the lower part of the frequency band while the distance increases slightly as the frequency increases, the last line corresponds to 14. Difficult to give an explanation with the data shown in the graphs.
3/26 17:00 – Today we had two peaks at Power 17, at 1 am and 2 am UTC, these were followed by a very light activity that touched Power 10 on several occasions, always keeping the light movements constant. Note the strong Quality peak that occurred at 1 UTC when it reached 17×2, Power 34, which, together with a sudden drop in frequency to 7.27 Hz, brought the ECC to 78 as shown in the table below. From 14 UTC it seems that a more intense period has started. The dotted line in the main chart si continuing, generated by the values of Quality 4.
3/26 01:30 – After about 13 hours of calm we had this isolated peak at Power 17 at 1 am UTC.
3/25 17:00 – Today’s activity took place in a time span of 8 hours, from 2 to 10 UTC, the maximum value reached was Power 41 at 8:15 within a period of about 2 hours, from 7 to 9 UTC, with greater intensity. From 14 UTC, a calm situation seems to have returned.
3/25 08:30 – We had about 12 hours of almost calm until 2 UTC when new movements suddenly brought the amplitude around Power 35 with two peaks at 2:30 and 4 UTC. From 7 UTC it seems that the intensity is increasing towards Power 41 and beyond at 8 UTC.
3/24 17:00 – The last 24 hours have been characterized by an initial part of calm, from 17 to 2 am UTC. All the parameters in the graphs show minimum values, even the dotted line generated by the Quality has stopped. Just before 2 UTC, slight variations began with Amplitude between Power 10 and 15, also Quality and Frequency have resumed the movements. Around 9 UTC in the main graph we can see a more intense coloring due to the decreasing movements of Frequency and increase of Quality value. The highest peak in Amplitude was at 4:30 UTC at Power 17 while the combination of all parameters gave an ECC peak at 36 at 9 UTC, compared to 24 of the previous peak.
3/23 17:00 – The activity decreased gradually, the last peak in time order was at about 13 UTC and reached Power 15, however there are still variations especially in the Quality which with “rhythmic” movements is apparently “drawing” the dotted line on the 24 Hz in the main graph.
3/23 11:30 – Moar movements occurred with another series between 8 and 10 UTC, here the maximum reached was Power 30 at 8 am and Power 20 at 9:30 UTC.
3/23 04:30 – We are on the move again, after about 4 hours in which the variations have reduced, since after midnight UTC we see a gradual increase, Power 15 has been exceeded at 2:30 and for about 1 hour we have remained on that value until a strong peak has brought the SR back to Power 46.
3/22 17:00 – Let’s summarize the activity shown in today’s chart. The movements lasted 12 hours, from 5 to 17 UTC. The most important part started at 10 UTC and is still ongoing. The peaks were initially Power 50 and then moved to Power 60 around 13 UTC. At the time of this update there are strong isolated peaks but very close to each other that reach between Power 40 and 45.
3/22 15:00 – This wave of very strong activity has reduced fro now, started at 10 UTC went above Power 40 at 11 and has returned below the threshold of 40 at 14 UTC, 3 hours of very strong activity in which the average was Power 50.
3/22 12:30 – Big movements in progress, after the ‘opening’ at Power 50 a much more powerful activity started at 9 UTC and brought the maximum to Power 56. The changes have been significant in all parameters and at the time of this update Gaia is still telling us something.
3/22 08:30 – We’re back to a condition of strong activity, at 5 UTC we had a first movement and within 40 minutes we had a powerful peak at Power 50 for the duration of 20 minutes until 6 UTC. This initial spike has been followed by another, Power 23 at 7 UTC. The movements seem to continue.
3/21 17:00 – Today was a mild activity day, the slight variations that colored the main graph were of the Quality and Frequency. A line around 24 Hz can be seen in the primary graph, it started at 9 UTC yesterday and stopped almost exactly 24 hours later at 9 UTC today. The detector that generated this line seems to be that of the Frequency, the F4 detector has measured almost the same value for 24 hours.
3/20 17:00 – After the maximum peaks occurred during the UTC night, the movements continued with ups and downs but never stopped. At 9 UTC a surge in amplitude reached Power 34 and then lowered around Power 10, and so it remained practically until this update. In the last hours of the main graph a “colored” activity is shown, in this regard the cause of this “coloring” is due to the wide variations both in Quality and Frequency, the latter increasing. In this regard, although the variations in frequency may seem minor, these have a strong impact on the main graph and consequently on the Energy of the Collective Consciousness.
3/20 09:30 – Even today strong activity, for three days the movements have been almost continuous and at the time of this update we are above Power 30. The most massive part so far has started just after midnight UTC, the changes have brought the amplitude gradually to Power 44, this value was practically maintained for almost two consecutive hours, from about 2 am to 3:30 UTC. Thereafter there wasn’t a real pause, but only a decrease in the amplitude of these movements which once again reached a significant peak at 9 UTC with Power 34.
3/19 22:00 – As anticipated, after a series of slight movements straddling the change of graphs, from 21 UTC there has been about an hour of activity that brought the amplitude of the SR first to Power 22 and then to Power 32 just before 22 UTC.
3/19 17:00 – The activity has decreased in the period from 12 to 17 UTC but in the last two hours there are fluctuations in the Quality which, together with a slight increase in the Amplitude, suggest a restart of the movements.
3/19 11:00 – Even today we are having some activity, isolated peaks with increasing amplitude started from 1 UTC, the most significant movements were at 7:30 UTC with Power 28 and at 9:30 UTC with Power 32.
3/18 17:00 – The activity lasted about 20 hours, from 19 UTC yesterday to 15 UTC today. Now the movements have decreased significantly.
3/18 09:30 – A day of strong activity, Gaia is responding to the moment of strong impact. The strongest peaks so far have occurred in the UTC night when at midnight the amplitude reached Power 50, they were not isolated movements but a set of variations of all the values reported. From 7 UTC to now, even if the amplitude fluctuates around Power 40, both the Quality and Frequency are having very strong movements, bringing the ECC to 85.
3/18 00:00 – The new graphs started with a bang, after a first peak at Power 36 at 19:30 UTC the activity continued as predicted and continued to increase, from 21 UTC the movements increased in intensity to reach Power 45 at 22 UTC, from what we can see it seems that there will be be further activity.
3/17 21:00 – The new charts, of March 18 but technically still on 17 in UTC time, show a moderate activity that started shortly after 18 UTC and that in about 1 hour brought the amplitude to Power 36. The activity seems to continue.
3/17 17:00 – Calm.
3/17 10:30 – Another day of light activity, so far the maximum has been reached at 00 UTC today with Power 14.
3/16 17:00 – Today we saw quite significant movements started at 3 UTC and continued until 14. The maximum values did not reach high peaks but the variations of all three parameters gave a much more intense coloring than yesterday. Now it seems that we have entered a period of calm, we shall see if “Coincidence 17” will be repeated with the new graphs.
3/16 07:30 – Today’s activity has become more relevant but not so much for the variations in amplitude but rather for the movements that we can see in the line graph of the Quality and the drop in that of Frequency. This series of movements is highlighted in the main graph in the period from 3 to 7 UTC. The activity is continuing.
3/15 17:00 – No changes, slight background activity.
3/15 11:00 – The activity continued with slight movements as yesterday but with a slight increase, the strongest peak in the new charts occurred shortly after 19 UTC yesterday and reached Power 32. Subsequently, the background hum remained with variations of both Quality and Frequency, from these the lively coloring of the main graph.
3/14 17:00 – Today’s, shown in the graphs, is divided into two parts, the first characterized by calm, the second by slight movements around Power 10 that seem to continue.
3/14 11:30 – Today’s graphs show that from 2 UTC the light movements are almost continuous, the amplitude of these variations is moderate reaching several times the maximum of Power 13.
3/13 17:00 – After the peak previously reported at Power 42, which was the strongest of the day, light movements continued until 11 UTC with a final jump to Power 13 and since then it has been calm.
3/13 10:30 – In the new graphs we can see that from just after midnight UTC slight movements began which, up to 7 UTC, had oscillations of amplitude around Power 10. From 7 to 8 UTC there was a strong peak that led the amplitude at Power 42, after this movement we went back to a slight background activity.
3/12 17:00 – After the strong peak at Power 57 between 8 and 9 UTC, the activity completely and suddenly subsided returning to a calm state.
3/12 9:00 – March 12 is a special day, we would have liked to make a prediction… In any case, the activity had a small surge in yesterday’s UTC evening, between 19 and 22, with variations in amplitude that reached Power 20. These were followed by relative calm until 6 UTC when we had an isolated peak at Power 24. At 7 UTC the strongest activity so far began, and brought amplitude to Power 57 between 8 and 8:30 UTC. The ECC for this peak turns out to be 90, see table below.
3/11 22:00 – As anticipated, with the new charts we see that the activity has returned with a crescendo that, from 19 UTC, has led the amplitude to reach Power 20 at 21 UTC. The activity seems to continue.
3/11 17:00 – Slight movements continued after 7 UTC reaching a maximum of Power 8 at 14 UTC. Not much after, just at the time of this update seems like new movements are starting.
3/11 13:00 – The latest updated graphs show a period of calm that lasted from 10 UTC yesterday until 1 am when a series of very light movements around Power 10 started, these oscillations continued until 7 UTC, from that moment calm seems to have returned.
3/10 17:00 – Always and only 17, after the peaks at Power 17 the calm began at 17 local timeline, 10 UTC.
3/10 09:30 – The activity continued even if all along at moderate levels, the peaks continued around Power 17. We got it, 17… 5:5 🙂
3/9 17:00 – Power 17 remained the highest value on today’s chart but there is still a slight background activity.
3/9 13:00 – The new graphs show that a slight activity has always been present for almost 48 hours. The most significant movements, so far, have started around 1 UTC when the amplitude has exceeded Power 10. Around 6 UTC there was a further increase in Power 13 and at 10 UTC we had Power 16. The crescendo is continuing and at the time of this update we are at Power 17.
3/8 17:00 – From 13 UTC the activity started to subside.
3/8 15:00 – The last 24 hours have been characterized by an average activity with the most intense part in the hours preceding midnight UTC. For the remaining part, the movements were continuous but limited around Power 10, shortly after 17 of the local timeline (10:30 UTC) there was a movement that reached Power 17.
3/7 22:00 – We had anticipated that we could have a significant activity and so it is. The rise was constant until 21 UTC when a powerful peak reached Power 41.
3/7 17:00 – Around 15 UTC started what appears to be the beginning of an activity that could become significant, the amplitude exceeded Power 10 just before 17 UTC.
3/7 13:00 – Not much to report except that the very light background movements have continued, in today’s graph we can note two isolated peaks, one at 18 UTC yesterday that reached Power 13, and one at 11 UTC today that reached Power 14.
3/6 17:00 – After a calm night (UTC), very light movements began at 3 UTC which almost cyclically brought the amplitude to Power 13 around 7 am UTC, the maximum value of today, which was repeated at 9 UTC. After these last light isolated peaks, the very slight background movements continued.
3/5 17:00 – After the last isolated peak at Power 22 happened at 13 UTC, the movements quickly subsided and we are now in a calm condition.
3/5 13:00 – The activity in today’s chart occurred in three distinct periods: from 18 to 20 UTC (yesterday) when we had the strongest peak so far at Power 36; around 1 UTC with the maximum of 29 Power; from 9 to 11 UTC with various movements that had the maximum at Power 22. If we analyze the three line graphs we see that the strongest peak, in terms of ECC, was that at 8 where we see significant variations in quality and in frequency, the value is 59.
3/4 20:30 – The slight movements that we saw at the passage of the new chart were the preamble to a series of significant spikes that started around 18 and in a few minutes brought the amplitude to Power 26, which was followed, about an hour later at 19:30 UTC, by a further increase to Power 36.
3/4 17:00 – Minor movements around Power 10 continue.
3/4 09:00 – The calm period lasted about 20 hours, from little after midnight UTC some slight movements started and reached the maximum at Power 9, from 5 UTC the values slightly increased up to Power 11. Looking at the frequency graph we see that it is actually in a downward peak, possible indicator of more powerful activity.
3/4 00:00 – The total calm in which we are in has lasted for more than 12 hours.
3/3 17:00 – The last two isolated movements, before the calm, occurred at 9 and 11 UTC reaching Power 9.
3/3 10:00 – In the new main graph we see a series of very close vertical thin lines that begin shortly after midnight UTC and from 6 am start to fade out. The peaks have been of moderate values, so far the maximum has been Power 13 just before 4 UTC. It can be noted, once again, how the movements that have the most ‘chromatic’ impact on the graph are those that have seen changes also in the Quality.
3/2 17:00 – Other minor movements in the latter part of the day around Power 10 occurred between 9 and 12 UTC, after which it was calm.
3/2 09:00 – Today’s chart shows a calm condition until 1 UTC when few slight isolated movements started, they occurred over a 8 hours hours period, until 9 UTC. The maximum value reached was Power 21 at 5 UTC, this specific movement saw frequency and quality oscillations, in addition to the amplitude, and the ECC value was 43.
3/1 17:00 – Today’s graphs show two different types of activity, one given only by the Amplitude, identified by the isolated white lines, and one given by the other parameters, with various colors of green yellow and red. Today’s periods of greatest activity do not correspond to the maximum amplitude peaks, which reached Power 10 just before 1 UTC. The most intense, relatively speaking, part instead took place from 20 to 21 UTC yesterday.
Frequency means how many wave cycle happen in a second, 1 Hz. means 1 cycle per second, 40 Hz. means 40 cycles per second, Amplitude is the size of the vibration, how big is the wave, the chart shows the frequency variation in Hz and the amplitude using the white color.
Note
The Ancient Indian Rishis called 7.83 Hz the frequency of OM. It also happens to be Mother Earth’s natural heartbeat rhythm Schumann resonances are named after professor Schumann who was involved in early German secret space program and was later paper-clipped into the United States. The frequencies of Schumann resonances are fairly stable and are mainly defined by the physical size of the ionospheric cavity. The amplitude of Schumann resonances does change and is bigger when ionospheric plasma gets excited. Ionospheric plasma excitation happens because of solar activity, thunderstorms, use of scalar plasma weapons and HAARP and lately also when the Light forces are clearing the plasma anomaly. Show entriesSearch:
All the SR daily images in one single page See the Images
Explanation of The Chart
The Schumann Resonance Spectrogram Chart
The Schumann Resonance Chart displays data from the magnetic field detector to monitor the resonances occurring in the plasma waves constantly circling the earth in the ionosphere. These three days spectrograms show the activity occurring at the various resonant frequencies from 1 to 40 Hz. Within the spectrogram, the power, or intensity level of each frequency is displayed as a color, with white being the most intense. The Schumann Resonances appear as the horizontal lines at 0.0, 4.0, 8.0, 12.0, 16.0, 20.0, 24.0, 28.0, 32.0, 36.0 & 40.0 Hz. This chart is based on Tomsk, Russia, time UTC +7 (UTC = Universal Time Coordinated).
What is a Spectrogram?
The Spectrogram Calendar is a visual representation of the range of frequencies in the magnetic field at a given location. Similar to how an equalizer displays the frequency content of music played on your stereo, the spectrogram calendar displays the frequency content of a magnetic field. Instead of showing a brief snapshot, it shows changes over a period of time, in this case 3 days.
The local magnetic field is a dynamic field that changes constantly because of variations in the ionosphere and sun and many other influences not yet fully understood. The range of variation displayed in the spectrogram chart is from 0 to 40 cycles per second. The vertical axis is frequency and the horizontal axis is time. The amplitude of a particular frequency at a specific time is represented by the intensity of color (green, yellow, white) of each point in the image.
You have more than you know.
Steel.
Tech.
America for sale.
Systematic weakening of the US.
U1.
Cash flow funnel.
Inside job.
Traitors.
$
We are in control.
Those awake can see.
Q
Traitors in the prev Admins (yes, plural) sold us out by importing cheap steel to weaken our military equip, virus-prone technology w/back doors, selling our uranium, etc. all for a buck. Q says “we are in control”.
>>936346
Talking to you, anon.
We always see “It’s Happening” here.
The ‘Tone’.
WAR.
April showers.
Q
An anon noticed @realDonaldTrump said “It’s happening” at the end (min 3:16) of today’s weekly address. Q confirms it was for anons who say “It’s happening” all the time re: “The Storm”. We are at WAR w/the Cabal/Clowns whose days are numbered.
>>936517
Border states are VERY key.
Bigger than you can imagine.
The pipeline.
Not R vs D.
CA is special.
Public will learn.
Q
Sending the NG to the border & building the wall is key to cutting off the Clowns’ pipeline of drugs, sex trafficking, terrorists, MS-13, etc. = huge cash flow. Those protesting these measures have the most to lose. This is likely why CA declared “Sanctuary State” status.
@POTUS’ weekly address discusses CA’s nullification of fed law on immigration endangering security of citizens of CA & entire nation. Said their Sanctuary bill should be called “The Jail Break Bill”.
More fake news fm CNN. My guess is Dems know @POTUS has the missing emails & they are trying to get ahead of the story and tie it to their bogus claims that Russia hacked her emails.
>>938332
New tactic.
Buckle up.
MediaMatters 4ch.
Narrative + anything Q.
Clowns + Twitter push.
MSM overdrive.
All 4 a LARP?
Q
CNN mentioned “(dark web) equivalent of Reddit”. An anon wondered if they’re referring to 8chan. This appears to be their new tactic – discredit all things Q by tying to the “dark web” (8chan). MSM, Twitter, Clowns on overdrive to discredit “a LARP”.
>>938366
Patriots stand together.
Strength.
Power.
They want you divided.
Q
Someone posted a photo from today’s Operation Justice March for Transparency in DC organized in large part by @tracybeanz (kudos!). Someone has a sign that says: “I see Q people.” Q approves!