Editor’s Note: Oh yes…the Schumann Resonance energies were strong and elevated from about 10:30PM until 5:00ish this morning MST. Not only SR energies, but also other cosmic energies (including gamma waves) will be enveloping the Earth from now on out causing the dark to twist and turn to find a way out of these higher energies…but it won’t work!
Now IS the time when we will hear more and more about sudden “deaths” and disappearances of the 1% who can see the end in sight. Did you hear of the helicopter “crash” near the Bahamas will all on board lost…a billionaire with daughter and helicopter mechanic? Just sayin…
Understand “who and what” you really are, hold yourself in the high vibrations of joy, and be…
InJoy!
___________________________________________________________________________________________
60
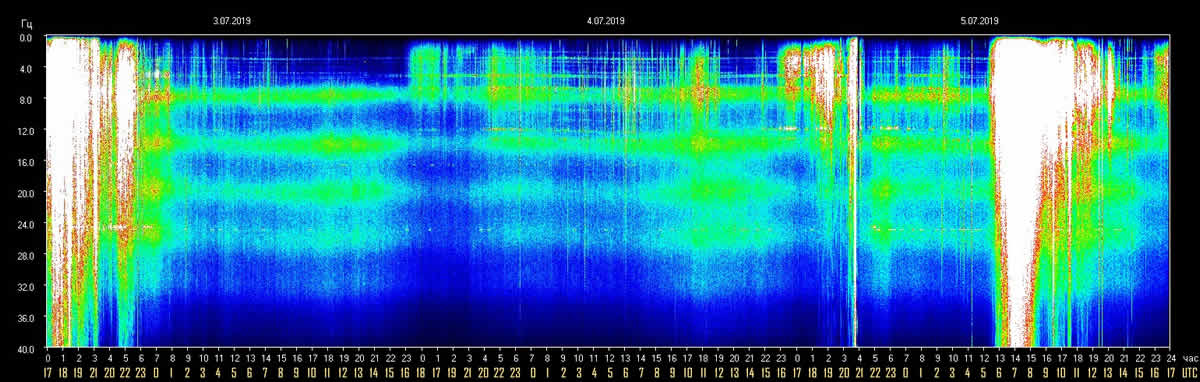
Schumann Resonance Today. We will try to keep you updated about the variations of the Resonance with this page. The great variations that nobody can explain but that give us a clear sign that the planet is changing. The Earth is vibration higher and higher, just like us!
RS Base Frequency 7.83 Hz.
Schumann Resonance Today Peaks:
- 7/4 17:00 UTC – The activity in the last 24 hours saw an isolated opening peak at 40 Hz at 20:45 UTC yesterday, followed by 8 hours of calm before a period of about 9 hours of fairly significant activity began. The maximum peak was reached with 60 Hz at 17:30 UTC although previously, from 6:45 am to 8:00 UTC, the amplitude remained constantly above 47 Hz.
- 7/4 17:00 UTC – Calm, only peak has been at at 15 Hz at 6 UTC.
- 7/3 17:00 UTC – After the period of strong activity previously reported, from 1 UTC today the situation is calm.
- 7/3 09:00 UTC – The massive activity started yesterday at 16 UTC lasted until 24 UTC, 8 hours. The maximum peak was 50 Hz but the average amplitude has been quite high shown by the amount of white during this period. Since midnight UTC the amplitude has returned to normal values.
- 7/2 20:00 UTC – The activity continued, it started quickly at 16 UTC and reached the first peak at 40 Hz at 17:30 UTC. After this surge it continued to rise to the second peak which is the largest today at 50 Hz. At 18:15 UTC.
- 7/2 17:00 UTC – Even today practically zero activity, the highest peak was at 10 Hz but just at the time of publication of this update there is a marked increase that brought the amplitude to 25 Hz increasing, we will see in the next hours if the activity continues.
- 7/1 17:00 UTC – Today we only had 7 isolated peaks, the strongest was at 6:30 UTC and reached 22 Hz.
- 6/30 17:00 UTC – Very light activity in today’s chart, the maximum peak was 10 Hz around midnight UTC.
- 6/29 17:00 UTC – The activity is lasted practically all day, until now; the highest peaks were those previously reported.
- 6/29 08:00 UTC – Today’s activity started shortly after midnight UTC to reach 1 22 Hz at 1, 24 Hz at 4:10 UTC which is the highest peak so far, and again 22 Hz at 7 UTC.
- 6/28 17:00 UTC – Little to report for today, we had 4 hours of very light activity, from 9 to 13 UTC, with the maximum peak reaching 15 Hz a few minutes after 9 UTC.
- 6/27 17:00 UTC – Today there were no significant peaks, the maximum was 15 Hz at 6:40 UTC. However, there has been a continuous light activity which lasted about 15 hours, from 22 UTC yesterday until 13 UTC today.
- 6/26 17:00 UTC – The central part of today’s activity is spread over a period of about 10 hours from 7 to 17 UTC and seems to be continuing. The highest peak is the one reported previously at 32 Hz.
- 6/26 12:30 UTC – At 3:30 UTC today there was the first of today’s peaks, all relatively moderate, at 24 HZ. At this isolated peak, it was assumed that it increased in intensity to 7:30 UTC and peaked at 32 Hz at 11:30 UTC.
- 6/25 17:00 UTC – Today’s most significant activity was concentrated in 5 hours, from 4:30 to 9:30 UTC, during this period there were 5 significant peaks, the highest of which was at 46 Hz. The others were respectively 40, 28, 36 and 33 Hz at about an hour from each other.
- 6/25 08:30 UTC – Once again the pattern is confirmed, even today moderate activity but higher than yesterday. The amplitude variations had a break from 15 to 21 UTC yesterday and then started again with low values until 4:30 UTC today when they increased to reach what is now the maximum at 46 Hz. followed by two other significant peaks at a short distance at 40 and 28 Hz.
- 6/24 17:00 UTC – The day continued with moderate activity until 13 UTC when the amplitude values returned to normal. At 9 UTC there has been the highest peak that was at 37 Hz.
- 6/24 08:30 UTC – It seems to witness again the model, which we have seen several times, of a gradual increase in activity both in frequency amplitude and in the duration of the movements. Today, so far, there have been no major peaks, the largest was 23 Hz at 5:30 UTC, but it was still a continuous movement that started at 21 UTC yesterday and it’s ongoing.
- 6/23 17:00 UTC – The day continued with moderate activity, the strongest peak remained the one shown just before 2 am Tomsk time corresponding to yesterday’s 20 UTC previously reported. Today at 14 UTC there was another 20 Hz peak at 14 UTC.
- 6/23 10:00 UTC – Today’s chart shows a sparse activity but but with amplitude values greater than the last days. The first peak occurred at 20 UTC yesterday and reached 36 Hz, this is the strongest so far. A second peak, of lower amplitude but longer duration, occurred from 7 to 9:30 UTC (ongoing) and the maximum amplitude reached was 22 Hz at 9 am.
- 6/22 17:00 UTC – Another day of light activity, it began at 7 and lasted until 14 UTC with the highest peak at 26 Hz at 7:30 UTC.
- 6/21 17:00 UTC – Today’s activity shows moderately scattered peaks, the maximum amplitude was 25 Hz at 14:30 UTC.
- 6/20 17:00 UTC – Calm.
- 6/20 14:00 UTC – Today it stands out as a day of light activity, the significant variation occurred from 5:45 UTC to 9:30 UTC and during this time, at 8:30 UTC, the highest peak was at 44 Hz.
- 6/19 17:00 UTC – From 8 UTC, the time of the peak at 55 Hz, the activity continued in a minor way with other peaks one of which, at 11:30 UTC, reached 40 Hz. In the last 3 hours, from 14 UTC, the values returned normal.
- 6/19 08:30 UTC – There has been no real movement interruption since yesterday at 3 am UTC. The movements were continuous and also very strong, the first in the new chart occurred at 22:15 UTC with an amplitude of 49 Hz. From 2:30 UTC a new series began which led, at 4:30 UTC, to today’s most powerful peak so far and reached 87 Hz. A further peak at 40 Hz occurred at 7:15 UTC followed shortly after by one more at 55 Hz.
- 6/18 17:00 UTC – After the powerful activity of the previously reported period the day continued with other significant peaks even if of a lower amplitude. The most significant ones were at 9:45 UTC at 46 Hz and at 20:10 UTC at 32 Hz.
- 6/18 08:00 UTC – Today we’ve already seen a very strong peak in a quite short period of activity. The movements started at 3 UTC and within 2 hours they first reached 67 Hz at 4:30 UTC, then 92 Hz at 06:15 UTC.
- 6/17 17:00 UTC – The 55 Hz peak reported previously was followed by another at 52 Hz at 11 UTC. After this last, the amplitude quickly returned to normal values.
- 6/17 13:00 UTC – The calm did not last long, at 23 UTC yesterday the movement started again with two “introductory” peaks just above 20 Hz. What appears to be a powerful activity so far began at 6 UTC with 20 Hz again and then passed at 35 Hz at 7:45 am and to what for now is the strongest peak at 55 Hz at 10 am UTC.
- 6/16 17:00 UTC – Today’s activity was characterized by calm with the maximum amplitude that reached 10 Hz, this until 15:30 when an isolated peak, lasting about 30 minutes, brought the maximum value to 25 Hz for then return to normal values.
- 6/15 17:00 UTC – Today’s activity has manifested itself in the form of constant micro peaks from 22 UTC yesterday until 11 am UTC today, the maximum amplitude has reached a low level, 14 Hz.
- 6/14 17:00 UTC – Today’s activity (from the chart) was moderate but lasted for a long time, around 17 hours, returning to normal values around 13 UTC. The most powerful peak was the one reported previously at 46 Hz.
- 6/14 09:00 UTC – After the 46 peak reported below it was not calm but moderate activity that continued with peaks, throughout the period, between 15 and 30 Hz.
- 6/13 17:00 UTC – After 6 hours, from 14 to 20 UTC, during which the amplitude remained “calm” we are seeing an increase of movements with the first one at 20:20 UTC close to 20 Hz. This was followed by a stronger spike at 46 Hz at 22:30 UTC.
- 6/13 17:00 UTC – The strong activity of today has lasted 8 hours, from 6 to 14 UTC, the central phase is the one that has seen the most powerful peak at 65 Hz. Currently the amplitude values are back to normal.
- 6/13 10:30 UTC – A massive activity is taking place at this time, the “total white” started quite suddenly at 6 UTC and from 8 UTC is constantly above 40 Hz, the most powerful peaks so far have been at 60 and 65 Hz respectively at 8:30 and 9:30 UTC.
- 6/12 17:00 UTC – Today’s activity started at 4:30 UTC with peaks rising to 18, 22, 25 Hz. After that, the highest values of today arrived, 28 Hz at 10:50 and 40 Hz at 11:45 UTC followed by another isolated peak at 25 Hz at 10:30 UTC.
- 6/11 17:00 UTC – The peak at 37 Hz was the strongest today as the activity took place with sporadic peaks between 17 and 20 Hz.
- 6/11 08:00 UTC – It may seem like a calm day but in reality there have always been small amplitude movements. At 6 UTC instead there was a significant peak at 37 Hz which seems to be the start of today’s activity.
- 6/10 17:00 UTC – Today there were no significant peaks, the relatively moderate activity continued however throughout the day with the maximum peak reaching 19 Hz at 12:20 UTC.
- 6/9 17:00 UTC – Today’s activity started quite suddenly at 5:30 UTC and continued for about 7 hours, the strongest peak at this time was at 30 Hz at 8:10 UTC. From 13 UTC the amplitude has returned to normal values.
- 6/8 17:00 UTC – Today’s most powerful peak occurred at 13:30 UTC in isolated form and reached 46 Hz.
- 6/8 09:00 UTC – It seems that there can no longer be calm days in succession as before, even today the activity started with two moderate isolated peaks at 20 and 30 Hz at 6:30 and 7:30 UTC. It then continued from 11 UTC with peaks rising to 42 Hz at 8:00 UTC.
- 6/7 17:00 UTC – Let’s recap the situation, since the “red” coloration started yesterday until the activity break, about 26 hours have passed, that is until yesterday’s 21 UTC. Today the activity started at 6:45 UTC with a peak at 30 Hz. From this moment the activity continued until it reached its highest peak for today at 45 Hz shortly after 11 UTC after which there was a drop towards lower values.
- 6/6 17:00 UTC – Since the activity began, at 5 UTC, it has continued until now, remaining between 20 and 50 Hz until 12 UTC. This significant activity was followed by approximately 2 hours at relatively low values and then started to increase again from 14 UTC to reach the maximum peak on today’s chart which was 65 Hz at 16:30 UTC.
- 6/6 09:30 UTC – What we could call “Red” lasted about 10 hours, until a new series of peaks started at 4:30 UTC. The maximum peak so far has been 60 Hz at 5 UTC and was followed by others in rapid succession between 40 and 50 Hz. In the last 4 hours the minimum amplitude was 18 Hz.
- 6/5 23:30 UTC – This new chart for today shows an unusual situation of difficult explanation, the amplitude is found to be on normal values, the only things that have a relationship with the red shown are the graph of the Quality and the Frequency.
- 6/5 17:00 UTC – After the 60 Hz peak, the amplitude gradually returned, within 5 hours, to normal values.
- 6/5 07:30 UTC – There were 14 hours of calm, from 11 to 1 UTC today when a modest peak at 20 Hz has slightly moved the flatness of the amplitude chart. At 5:45 UTC, however, a new movement began and reached initially 55 Hz and was followed at 6:10 UTC by one at 60 Hz which is the strongest so far.
- 6/4 17:00 UTC – After the strong peak at 83 Hz previously reported we had about 3 hours in which the amplitude registered normal values, at 11 UTC a spike to 35 Hz and then returned to a state of calm.
- 6/4 07:30 UTC – A new powerful peak occurred, after about 5 hours of calm, at 5 UTC and reached 83 Hz. Once again it seems to witness the pattern of gradual increase in the duration of the variations in amplitude that we have already seen several times in the last times.
- 6/3 22:00 UTC – Just after midnight on the chart, which corresponds to 17 UTC, there was a new series of peaks that reached 47 and 45 Hz.
- 6/3 17:00 UTC – The peak at 49 Hz has remained the most powerful of today. The activity lasted 5 and a half hours, from 7:30 to 13 UTC.
- 6/3 12:30 UTC – After a couple of days of “rest” the activity started again today at 8 UTC with an initial peak at 30 Hz. The amplitude continued to increase until it reached the maximum peak, until now, of 49 Hz at 11 am UTC. May Interactive PDF archive can be viewed/downloaded here.
- 6/2 17:00 UTC – Today we had four minor peaks, the first on the graph is shown at 21 UTC at 20 Hz, the second just before 2 UTC at 14 Hz, the third at 21 Hz at 10:30 UTC and the last one always at 21 Hz at 13 UTC, all had a short duration. The Images Archive has been updated with May’s images. We will soon post the Interactive PDF.
- 6/1 17:00 UTC – Calm.
- We added a new charts below, we’ll try to post it daily to show the actual peaks above 40 Hz.
- Frequency means how many wave cycle happen in a second, 1 Hz. means 1 cycle per second, 40 Hz. means 40 cycles per second, Amplitude is the size of the vibration, how big is the wave, the chart shows the frequency variation in Hz and the amplitude using the white color.
The Chart time is based on Tomsk – Russia – UTC +7 Source
Note
The Ancient Indian Rishis called 7.83 Hz the frequency of OM. It also happens to be Mother Earth’s natural heartbeat rhythm Schumann resonances are named after professor Schumann who was involved in early German secret space program and was later paper-clipped into the United States. The frequencies of Schumann resonances are fairly stable and are mainly defined by the physical size of the ionospheric cavity. The amplitude of Schumann resonances does change and is bigger when ionospheric plasma gets excited. Ionospheric plasma excitation happens because of solar activity, thunderstorms, use of scalar plasma weapons and HAARP and lately also when the Light forces are clearing the plasma anomaly.
Schumann Resonance and Micro-Events
This is my opinion on the connection with the soul of the Planet Earth, Gaia, which is happening to a large number of people and which can involve phenomena of various kinds. We are at a time when the Planet, Gaia, is moving towards 5D and there is a feeling that it is nearing completion, this change is happening regardless of what the people living on the planet will do.
There are a number of micro-events going on and the number of people awakening and increasing their vibrational frequency makes the difference on the number of these micro-events and their time frequency, the more people awake the more micro-events number.
I think that what we are experiencing with the Schumann Resonance is connected to the growth of our frequency and to our connection with the terrestrial energy network. It’s a powerful connection and can cause some discomfort sometimes, we’re adjusting our vibrational frequency, we’re tuning in to Gaia’s.
I don’t think there will be what the “Narrative of the Light” calls the Event, let’s say that timeline has changed, there are a series of continuous events, some even on the physical plane; someone in the future may even decide that a particular moment can be called “The Event” but when that happens it will have lost its meaning completely. Schumann Resonance
Disclosure News

Dependencies of Amplitudes Schumann Resonance July 5 2019

Dependencies of Quality Schumann Resonance July 5 2019

Dependencies of Frequency Schumann Resonance July 5 2019
Schumann Resonance Differential Peaks
Schumann Resonance PDF Archives
Images Archive
All the SR daily images in one single pageSee the Images

Explanation of The Chart
What is the Schumann Resonance?
The Herathbeat of Planet EarthRead

Clicks on the Ads Keep Us Alive

Dream
When we are awake, we sleep. When we sleep, we dream. When we dream, we live.
Carl Gustav Jung

Reblogged this on Blue Dragon Journal.
LikeLike
55hz today!
LikeLike