Editor’s Note: Well, okay…the date is off by one day for the pic above, but “they” would not let me post today’s pic, sooo…be sure to look below for evidence they are trying HARD to HIDE, investigate items of interest, and BE…
In a Wednesday data leak, user “antifa-data” posted an archived
SQL database dump of “neo-Nazi forum” Iron March which includes the
usernames, email addresses, forum posts, private messages and IP
addresses belonging to members of the self-labeled “Global Fascist
Fraternity.” Since the archive was published, individuals and
organizations ranging from everyday netizens to journalists and law
enforcement have reportedly accessed the database and have been using
various methods to cross-reference and identify users.
On November 5, for the first time in 40 years, a pristine lunar rock
sample was opened by scientists at NASA, the US space agency, in order
to test new tools in advance of the upcoming Artemis missions.
American Airlines announced Friday afternoon that it would continue
to ground its entire fleet of Boeing 737 MAX aircraft until March 5,
2020.
Brazilian Twitter erupted in response to an announcement that the
former president of Brazil, Lula Da Silva, had been released from prison
on Friday following an order by a federal judge.
Scotland and the northern regions of England have been hit by
torrential rains, and flooding has swept entire districts, resulting in
the issuing of continuous “danger to life” warnings and multiple travel
advisories. Flooding has trapped residents who cannot move freely and
are forced to sleep in shopping malls.
The French police have detained more than 10,000 supporters of
the ‘yellow vest’ movement since its inception in November last year,
the newspaper Le Monde reported.
US President Donald Trump would like to visit Moscow on May 9, 2020,
to attend the 75th anniversary celebration of the Soviet Union’s
Victory over Nazi Germany in the Great Patriotic War, as he himself said
in response to a TASS question.
Outraged that Trump might attend V-Day parade in Moscow, MSM gets history & Russia all wrong again.
A former senior manager at the French ministry of culture is on
trial for spiking young women’s drinks with diuretics to watch them
urinate in front of him and with taking upskirt photos over a 10-year
period, local media report.
Car thefts across the European Union between 2015 and 2017 (vehicle per 100k inhabitants).
Luxemburg 328
Greece 269
Italy 257
Sweeden 256
France 247
Czechia 238
England Wales 167
Netherlands 146
Belgium132
Finland 123
Ireland 114
….
Denmark 4
Strongest EQ in Europe M3.9 Azores-Cape St. Vincent Ridge Strongest EQ in US M4.9 Alaska Strongest EQ on the Planet M6.5 Fiji Deepest EQ M6.5 582 km Fiji
News Burst 9 November 2019
Share this: Send the word out using these buttons!
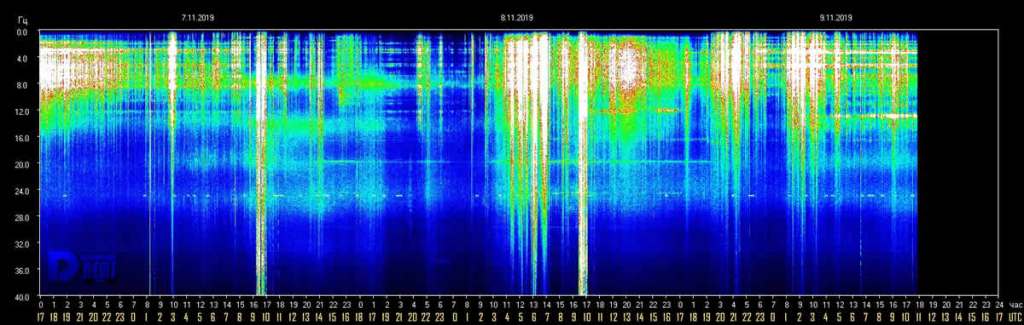
Editor’s Note: Wowza! By looking at the graph above, we can see the Earth has been emitting Schumann Resonance energies that are elevated, higher amplitudes above the norm, continuously for over 34 hours!
This show the Earth has been receiving cosmic photonic energies for the same length of time. Please take it easy, know why our world continues to change positively under the influence of these energies, and BE…
Schumann Resonance Today. We will
try to keep you updated about the variations of the Resonance with this
page. The great variations that nobody can explain but that give us a
clear sign that the planet is changing. The Earth is vibration higher
and higher, just like us!
The Chart time is based on Tomsk – Russia – UTC (Universal Time Coordinated) +7Source
RS Base Frequency 7.83 Hz.
Schumann Resonance Today Peaks:
11/8 17:00
UTC – In this first part of the day the movements continued, increasing
numerically but with less powerful amplitude variations whose maximum
was Power 25 at 2:30 UTC.
11/8 17:00 UTC – The series of most significant movements of today
lasted about eight hours, from 3 to 11 UTC with the peaks previously
reported, this period has been followed by more slight movements.
11/8 10:30 UTC – From today’s image, we can see how in the last
three days there has been a sort of sequence of movements characterized
by a constant increasing trend, will this coincidentally reach its
maximum on 11 November? The significant peaks of today started at 3, at 6
UTC reached 35 and just before 10 the maximum value of these last 3
days, Power 43.
11/7 17:00 UTC – Slight movements have continued throughout the day,
the highest peak is the one reported previously but shortly after 9 UTC
we can see another variation that has reached Power 27.
11/7 09:00 UTC – The graph in the first part of today shows how the
constant slight movement that began yesterday is continuing. Today we
have had the strongest peak of these last 3 days and reached Power 32 at
3 UTC.
11/6 17:00 UTC – After a couple of days of relative calm today,
shortly after midnight UTC, movements began again which gradually
brought the current peak value of Power 23 to 9:30 UTC. Activity has not
stopped but has continued and at present it seems to see a crescendo
that will lead to higher values.
11/5 17:00 UTC – Today’s activity is very similar to that of
yesterday, slight movements from 1 to 8 UTC with the maximum
value reached of Power 12.
11/4 17:00 UTC – Today the calm has been almost total, very slight variations have reached Power 15 between 6 and 10 UTC.
11/3 17:00 UTC – During the last 24 hours reported in the chart
there were only 3 significant short-term events, the first happened at
19 UTC of yesterday at Power 25, the second movement, which lasted about
2 hours, reached today’s maximum of Power 32 at 6:30 UTC and the last
at 10 UTC at 23.
11/2 17:00 UTC – We could recap today activity with how long the
amplitude remained above 40: 6 hours, from 3 to 9 UTC. Today’s maximum
is Power 98 as previously reported. From 11 UTC the values are back to
normal.
11/2 09:30 UTC – The strong activity that we see in progress at this
time started decisively at the turn of the local midnight,
corresponding to 17 UTC. Initially with peaks at Power 20, within two
hours it reached 30 around 19 UTC. These first movements were followed
by a period during which the amplitude was constantly
oscillating between 10 and 20. At 1 UTC today, the very powerful
activity began, bringing the amplitude close to Power 100. The maximum of Power 98 was reached at 5:30 UTC.
11/1 17:00 UTC – The situation shows the continuation of the
variations also in this second part of the day where the greatest peak
of today was had at Power 21.
11/1 12:30 UTC – The new chart shows slight movements around
midnight UTC that have reached Power 18, for the rest just ‘background’
movements around 10.
10/31 17:00 UTC – Calm.
10/31 11:30 UTC – At the local midnight, in the graph shown in white
and corresponding to 17 UTC, we saw two slight variations that reached
Power 20, from 19 UTC yesterday the situation is practically calm.
10/30 17:00 UTC – In this second part of the day it was mainly calm except for an episode to 21 just before the 17 UTC.
10/30 09:30 UTC – The situation seems to have calmed down, since the
end of the activity yesterday around 15 UTC there were no fluctuations
of amplitude until 1 UTC this morning when we begin to see slight
movements. Up to now the maximum value has been around Power 21.
10/29 17:00 UTC – Considering the beginning of this powerful
movement, indicated on the graph on October 27th at 5 am, the almost
continuous period of activity was of about 65 hours.
10/29 13:30 UTC – Today up to now it has almost been a total white,
for several hours, from 7 to 9 and from 10 to 11 UTC the amplitude was
constantly above Power 70 with various exceedances even of the threshold
of 80. The highest peak still remains that previously reported.
10/29 08:30 UTC – We entered the third consecutive day of strong
activity, after a few hours of pause at the local time midnight passage,
from 22 UTC a new powerful movement began with amplitude variations
that reached 40 at first to arrive with a gradual increase to Power 87
at 8 UTC.
10/28 23:30 UTC – The new graph shows the activity still in
progress, after a few hours of calm, thus bringing the consecutive hours
of movements to 48. The last peak in order of time occurred at 22 UTC
and reached Power 43.
10/28 17:00 UTC – The peaks on the 40 are continuing, although in
the last few hours there has been a slowdown now towards the end of
today’s chart is shown an intensification of the variations, again
around Power 40.
10/28 11:00 UTC – The strong activity continues without
interruption. This phase began on October 26th at 22 UTC so we are now
at about 36 consecutive hours. Today’s peak was the strongest of this
phase and reached Power 60 at 23 UTC yesterday. Currently the peaks are
around 40.
10/27 23:00 UTC – The strong activity did not stop, after a brief slowdown has resumed, from 20 UTC, with peaks over 40 Hz.
10/27 17:00 UTC – The most significant part of today’s movements was
from 11 to 15 UTC, during which the maximum peak of the day has been
reached. The oscillations are continuing around Power 15.
10/27 14:00 UTC – Today the activity started quite suddenly and
within two hours it reached its first significant peak at 45 Hz at
around midnight UTC. This was followed by other minor peaks up to the
beginning of another phase of very intense activity that began at 10
UTC. From 11 UTC the amplitude was above 40 with a maximum at 50 at
12:30 UTC.
10/26 17:00 UTC – Much of the day today was calm, the only activity,
that reached a maximum amplitude of 25 occurred between 5 and 11 UTC.
10/25 17:00 UTC – From 10 UTC the situation is calm.
10/25 11:00 UTC – Today the activity is completely on another level
compared to the last days. The series of movements in progress began
yesterday at 13 UTC on the 25 Hz level, a few hours later, at 18 UTC it
approached 30 and after a period of moderate fluctuations it reached its
maximum peak so far, 58 at 3:30 UTC. After this strong movement we see a
series of minor peaks on the 25 threshold.AUGUST Interactive PDF Archive
10/24 17:00 UTC – A bit of movement returned from 13 to 15 UTC with
two peaks that exceeded 20, the first at 24 and the second at 22. For
the rest of the day it was calm.
10/23 17:00 UTC – The sort of ‘vibration’ that we noticed yesterday
is perceived to have continued until the morning of today, unfortunately
it reached its maximum during the arc in which the data were not
recorded, the peak is shown at 10 Hz during the descent of the amplitude
towards normal values apparently started at 4 UTC.
10/22 17:00 UTC – In today’s amplitude graph we can see a very
slight and constantly increasing variation that began on the night
between 20 and 21 October, it seems a sort of increasing vibration, as
it is an amplitude it could be compared to an Om which from nothing
increases, little by little but constantly. Now we are around Power 8.
10/21 17:00 UTC – Another day of light activity, the only
significant movement reached 11 at 11 chart local time, corresponding to
4 UTC.
10/20 17:00 UTC – Very light activity, Power 10.
10/20 10:00 UTC – Not much to report, the most relevant movement reached an amplitude of Power 16 just before 9 am UTC.
10/19 17:00 UTC – Calm.
10/18 17:00 UTC – The only significant activity of today has been reported previously, we are now in a situation of calm.
10/18 10:00 UTC – A light activity continued after the previous
series of peaks, the average has been around Power 20 from 18 to 22 UTC.
Is seems the functionality on the TSU is still not fully recovered.
10/17 17:00 UTC – In the part of the graph available for today we
note 3 peaks one of Power 53, reported previously, the second of Power
57 at 10:15 UTC and the last minor at 25 at 12:40 UTC.
10/17 08:30 UTC – From 6 UTC the data are available again and, like
every self-respecting 17 in this last period, even today we have our
peak with a power of 53 at 7:20 UTC. We hope that the problem has been
solved and we can return to a normal flow of data.
10/16 17:00 UTC – Still frozen at yesterday’s image, other sources report peaks for today at 20.
10/15 17:00 UTC – Pitch black.
10/15 10:00 UTC – This is the little we have for the last few days,
lack of data. Other stations with different measurement report calm.
10/14 17:00 UTC – For the little we can see the situation remained calm.
10/14 09:30 UTC – The TSU site is back live but the interruption
data is not available as seen from the large blank space in the chart.
Looking for information on the web it seems that during this “void”
period the situation remained almost calm. Currently we see very light
movements at about 10 Hz.
10/13 22:00 UTC – TSU website still down.
10/12 17:00 UTC – TSU website is down, we will post an update as soon as it will return live.
10/11 17:00 UTC – After several days of calm, from yesterday at 7:30
UTC, we are seeing a medium activity which, despite being
uninterrupted, generated peaks of average amplitude. From 12 UTC today, a
period of more significant movements began which reached the maximum
peak at 59 Hz shortly after 15 UTC.
10/10 17:00 UTC – Today the activity has returned more significantly
since 1 UTC. The first significant variation started at 7:30 UTC and
within few hours reached the maximum of 42 Hz at 9:45 UTC. The movements
are continuing.
10/9 17:00 UTC – The light activity continues, the peak of today has
reached 13 Hz shortly after 9 UTC. A black vertical line is visible in
the chart, it’s due to missing data.
10/8 17:00 UTC – Almost calm, maximum 13 Hz at 10 UTC.
10/7 17:00 UTC – Even today very light activity, the maximum of 17
Hz was reached shortly after 4 UTC. This slight activity however lasted
from midnight to 15 UTC.
10/6 17:00 UTC – Calm.
10/5 17:00 UTC – Calm.
10/4 17:00 UTC – Practically calm, peak at 13 Hz at 11 UTC.
10/3 17:00 UTC – The pattern of slight daily increase, seems to be
underway again, the activity saw a first isolated peak at 1 UTC which
reached 17 CC and later, during a more relevant phase, 22 CC at 6:30
UTC.
10/2 17:00 UTC – Slight activity limited to a period of about 10 hours, from 1 to 11 UTC, the maximum peak at 9 to 14 CC.
10/1 17:00 UTC – Very light activity during the central part of the day, the only significant peak reached 26 Hz at 4 UTC.
Frequency means how many wave cycle happen in a second, 1
Hz. means 1 cycle per second, 40 Hz. means 40 cycles per second,
Amplitude is the size of the vibration, how big is the wave, the chart
shows the frequency variation in Hz and the amplitude using the white
color.
Note
The Ancient Indian Rishis called 7.83 Hz the frequency of OM. It also happens to be Mother Earth’s natural heartbeat rhythm
Schumann resonances are named after professor
Schumann who was involved in early German secret space program and was
later paper-clipped into the United States. The frequencies of Schumann resonances are fairly stable and are mainly defined by the physical size of the ionospheric cavity.
The amplitude of Schumann resonances does
change and is bigger when ionospheric plasma gets excited. Ionospheric
plasma excitation happens because of solar activity, thunderstorms, use
of scalar plasma weapons and HAARP and lately also when the Light forces
are clearing the plasma anomaly.
Dependencies of Amplitudes Schumann Resonance November 9 2019
Dependencies of Quality Schumann Resonance Novembre 8 2019
Dependencies of Frequency Schumann Resonance November 8 2019
All the SR daily images in one single pageSee the Images
Explanation of The Chart
The Schumann Resonance Spectrogram Chart
The Schumann Resonance Chart displays data from the magnetic field
detector to monitor the resonances occurring in the plasma waves
constantly circling the earth in the ionosphere. These three days
spectrograms show the activity occurring at the various resonant
frequencies from 1 to 40 Hz. Within the spectrogram, the power, or
intensity level of each frequency is displayed as a color, with white
being the most intense. The Schumann Resonances appear as the horizontal
lines at 0.0, 4.0, 8.0, 12.0, 16.0, 20.0, 24.0, 28.0, 32.0, 36.0 &
40.0 Hz. This chart is based on Tomsk, Russia, time UTC +7 (UTC =
Universal Time Coordinated).
What is a Spectrogram?
The Spectrogram Calendar is a visual representation of the range of
frequencies in the magnetic field at a given location. Similar to how an
equalizer displays the frequency content of music played on your
stereo, the spectrogram calendar displays the frequency content of a
magnetic field. Instead of showing a brief snapshot, it shows changes
over a period of time, in this case 3 days.
The local magnetic field is a dynamic field that changes constantly
because of variations in the ionosphere and sun and many other
influences not yet fully understood. The range of variation displayed in
the spectrogram chart is from 0 to 40 cycles per second. The vertical
axis is frequency and the horizontal axis is time. The amplitude of a
particular frequency at a specific time is represented by the intensity
of color (green, yellow, white) of each point in the image.