Q !!mG7VJxZNCI ID: 000000 No.7362034 Nov 23 2019 20:24:25 (UTC)
[16:00] “Are we going to be sending massive amounts of money that simply goes into other people’s [personal] bank account(s) [theft].” – POTUS Who audits where foreign aid actually goes? Nobody. Foreign aid > Country [X] > Personal Bank Accts [+US person(s) involved]. Think Iran. Think Paris Accord [attempt]. Think All. Corrupt system. Do you think [GS] is spending his own money re: push of radical viewpoint adoption? US TAXPAYER payments [aid] > directly/indirectly [GS] organizations? Re-read drops re: ‘Foreign Aid’
[Listen carefully] RETURNING POWER TO THE PEOPLE. DRAINING THE SWAMP. POTUS IS FIGHTING FOR YOU. It’s been a long time since we’ve had a non_corrupt POTUS who cares for the people, and not himself. Q
Remember this? Cash pallets hidden in Red Cross boxes? Red Cross
was used as a piggy bank for deep state. What else was Red Cross used
for? Human trafficking.
QAnon 23 November 2019 – The Great Awakening
Editor’s Note: Be sure to watch both video’s listed in the brief “news you can use” bit from Disclosure News Italia. Both are mighty interesting and clear proof our world is readying to change in ways once never imagined, and BE…
The Hal Turner Radio Show from the US has reported, citing
unnamed military sources, that a 10-20-kiloton undersea explosion took
place in the South China Sea on 20 November. No government agencies have
commented on this information so far.
The iconic pink suit Jackie Kennedy wore that fateful day in 1963
when her husband John F. Kennedy was assassinated will remain hidden
from the public until at least 2103 at the request of family members,
the outfit has never been cleaned.
House Permanent Select Committee on Intelligence ranking member Rep.
Devin Nunes (R-CA) intends to file lawsuits against both CNN and the
Daily Beast over fake hit pieces the outlets have published about him in
recent days.
A liberal “dark money” group that received millions of dollars from
George Soros’s advocacy network, records show, is behind a seven-figure
ad blitz urging vulnerable Republicans in swing districts to support the
impeachment inquiry into President Donald Trump.
Prince Andrew has been ordered to leave Buckingham Palace, and told
he can no longer do business inside the Palace, over Jeffrey Epstein
scandal.
A former CIA case agent was sentenced to 19 years in prison
Friday for espionage conspiracy. Prosecutors say he received hundreds
of thousands of dollars from China to divulge names of human sources and
spycraft intelligence.
Climate Activists stormed the field during the halftime break at
Saturday’s annual football game between Harvard and Yale over ‘Fossil
Fuel Divestment’.
Here’s more footage of this ‘Exploration Craft’ near the ISS. We’re
Seeing more because we’re Ready for more, now they do not shut down the
feed as they were used to do. Video
The Supreme Court says Justice Ruth Bader Ginsburg has been
hospitalized after experiencing chills and fever. The court said she has
improved and could be released Sunday.
Before 1913 there was no income tax in the United States
and was a much freer country. Initially, the government sold the federal
income tax to the American people as something only the rich would have
to pay.
“I can understand people who immediately, whose minds went to sort
of the worst-case scenario because it was a perfect storm of screw-ups,”
US Attorney General William Barr told AP on Thursday.
Active Weather
Tropical Storm Fung-wong 22 kts ↓ – SW of Okinawa Japan
Strongest EQ in Europe M4.0 Geece Strongest EQ in US M3.6 Alaska Strongest EQ on the Planet M6.1 Indonesia Deepest EQ M4.3 582 km Fiji
News Burst 24 November 2019
Share this: Send the word out using these buttons!
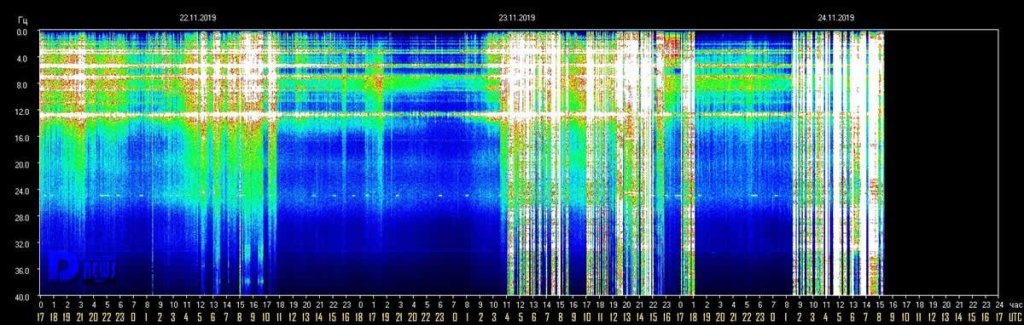
Editor’s Note: Are you feeling the high density, high amplitude Schumann Resonance energies that have been released by the Earth from ;;30pm continuously through 3:15am (which is the end of the graph?)
Schumann Resonance energies are released by the Earth itself in response to receiving cosmic energies of just the correct frequency (currently unknown) which causes the Earth to “ring like a bell”.
Please view the graph above from Tomsk, Russia, know why your world is changing, and BE…
Schumann Resonance Today. We will
try to keep you updated about the variations of the Resonance with this
page. The great variations that nobody can explain but that give us a
clear sign that the planet is changing. The Earth is vibration higher
and higher, just like us!
The Chart time is based on Tomsk – Russia – UTC (Universal Time Coordinated) +7Source
RS Base Frequency 7.83 Hz.
Schumann Resonance Today Peaks:
11/24 09:00 UTC – As you
can see in the graph of the of the last 3 days the increase in the power
of the variations has always been constant, one day after another. On
the 22nd, during the activity phase, we got to Power 30, on the 23rd it
was P57 and today, for now, we are at Power 68. Today’s activity started
at 1 UTC, after about 6 hours of calm, the first maximum reached
briefly time P35 to reach P50, around 4 UTC, and the maximum Power 68
just before 7 UTC.
11/23 17:00 UTC – What started at 3 am UTC this morning is a period
of intense activity that is still in progress and that for a period of
12 hours maintained the amplitude values on the Power 25 average.
Today’s peak reached Power 57 at 14:30 UTC.
11/23 11:00 UTC – The period of calm lasted about 14 hours, it was
interrupted today at 3 UTC when quite significant variations began
which, within two hours, brought the amplitude values between Power 25
and 30. Remaining constantly on those values, at 8 am UTC, we had what
so far has been the maximum peak at Power 41. The activity is
continuing.
11/22 17:00 UTC – In the early part of today we had the most
significant activity, from 4 to 10 UTC a series of peaks on the 20 with
the maximum at P25 just after 10 UTC.
11/22 11:00 UTC – The activity started yesterday is continuing but
at lower values, today the significant part began at 4 UTC and remained
on Power 20 threshold since than with a peak Power 25 at 10 UTC.
11/21 17:00 UTC – From this morning to 5 UTC since this period of
activity began, there has been a constant increase in the maximum values
reached, Power 33 was reached at 14 UTC. Right now we are around Power
15.
11/21 11:00 UTC – After 3 days of calm today we are seeing new
activity, from 5 UTC there have been some variations initially at Power
20 and at 10 UTC at the peak until now at Power 23.
11/20 17:00 UTC – Third day of total calm.
11/19 17:00 UTC – Calm.
11/18 17:00 UTC – Today we returned to a condition of very light
activity, there were only two movements that exceeded Power 10, 16 at 6
UTC and 11 at 11 UTC.
11/17 17:00 UTC – The strong activity, that seems to have ended at 9
UTC today, lasted 20 hours. The highest peaks occurred in its initial
part which took place yesterday, today the highest value was Power 30 as
previously reported.
11/17 09:00 UTC – Today is the 17th, lately a day of recurring SR
activity, and the movements started yesterday continued uninterrupted,
the peaks are not at very high values, Power 37 was reached at 00 UTC
today, but the values remained constantly around Power 30.
11/16 23:00 UTC – The strong activity continued but with slightly
less intensity, this period of strong variations started at 6 UTC and
has been above Power 40 for 2 hours, from 15 to 17 UTC. At this time the
maximum values are around Power 30.
11/16 17:00 UTC – Today’s chart shows an initial long period of flat
calm until 1 UTC when very light movements have brought the variations
to reach Power 10 at 9 UTC. From here the movements started to become
more consistent up to starting a strong activity period from 13 UTC
during which the today’s maximum value of Power 46 was reached. It seems
that the movements should also continue in the new chart of Nov. 17th.
11/15 17:00 UTC – The movements continued and grew steadily until 10
UTC when it reached today’s high at Power 22 to returned to normal
values just after.
11/15 09:00 UTC – Shortly after midnight local time from the graph,
corresponding to 17 UTC, we saw a slow and gradual increase in amplitude
values that reached Power 17 at 8 UTC. It seems that the activity
should continue.
11/14 17:00 UTC – Virtually calm, only a few slight movements between 3 and 5 UTC with a maximum of Power 13.
11/13 17:00 UTC – Calm.
11/13 15:00 UTC – The first part of today’s chart day shows absolute
calm, from 1 UTC there are very light movements that have given way to
the light activity of today that lasted for the central part of today’s
chart. During this phase there were 3 peaks that exceeded 20 and others
that touched it, Power 24 was reached at around 6 UTC.
11/12 17:00 UTC – Today’s activity took place over a period of 9
hours, from 3 to 12 UTC, the most intense part with the maximum value of
today as reported previously was from 5 to 8 UTC. The situation is now
shown to be calm.
11/12 08:00 UTC – After several days of intense calm we come to a
new series of movements characterized by rather significant peaks. The
changes started suddenly at 3 UTC and in the span of four hours, at 7
UTC, there was the strongest peak so far at Power 48.
11/11 17:00 UTC – Today was mostly calm, the only variations with a maximum of Power 14 occurred from 7:30 to 9:30 UTC.
11/10 17:00 UTC – Calm.
11/10 11:00 UTC – Not much to say, compared to the calm we see only the “streaks” on the Power 10.
11/9 17:00 UTC – The series of light movements continued without
interruption, a slight drop to values close to calm took place in the
last hours.
11/9 11:30 UTC – In this first part of the day the movements
continued, increasing numerically but with less powerful amplitude
variations whose maximum was Power 25 at 2:30 UTC.
11/8 17:00 UTC – The series of most significant movements of today
lasted about eight hours, from 3 to 11 UTC with the peaks previously
reported, this period has been followed by more slight movements.
11/8 10:30 UTC – From today’s image, we can see how in the last
three days there has been a sort of sequence of movements characterized
by a constant increasing trend, will this coincidentally reach its
maximum on 11 November? The significant peaks of today started at 3, at 6
UTC reached 35 and just before 10 the maximum value of these last 3
days, Power 43.
11/7 17:00 UTC – Slight movements have continued throughout the day,
the highest peak is the one reported previously but shortly after 9 UTC
we can see another variation that has reached Power 27.
11/7 09:00 UTC – The graph in the first part of today shows how the
constant slight movement that began yesterday is continuing. Today we
have had the strongest peak of these last 3 days and reached Power 32 at
3 UTC.
11/6 17:00 UTC – After a couple of days of relative calm today,
shortly after midnight UTC, movements began again which gradually
brought the current peak value of Power 23 to 9:30 UTC. Activity has not
stopped but has continued and at present it seems to see a crescendo
that will lead to higher values.
11/5 17:00 UTC – Today’s activity is very similar to that of
yesterday, slight movements from 1 to 8 UTC with the maximum
value reached of Power 12.
11/4 17:00 UTC – Today the calm has been almost total, very slight variations have reached Power 15 between 6 and 10 UTC.
11/3 17:00 UTC – During the last 24 hours reported in the chart
there were only 3 significant short-term events, the first happened at
19 UTC of yesterday at Power 25, the second movement, which lasted about
2 hours, reached today’s maximum of Power 32 at 6:30 UTC and the last
at 10 UTC at 23.
11/2 17:00 UTC – We could recap today activity with how long the
amplitude remained above 40: 6 hours, from 3 to 9 UTC. Today’s maximum
is Power 98 as previously reported. From 11 UTC the values are back to
normal.
11/2 09:30 UTC – The strong activity that we see in progress at this
time started decisively at the turn of the local midnight,
corresponding to 17 UTC. Initially with peaks at Power 20, within two
hours it reached 30 around 19 UTC. These first movements were followed
by a period during which the amplitude was constantly
oscillating between 10 and 20. At 1 UTC today, the very powerful
activity began, bringing the amplitude close to Power 100. The maximum of Power 98 was reached at 5:30 UTC.
11/1 17:00 UTC – The situation shows the continuation of the
variations also in this second part of the day where the greatest peak
of today was had at Power 21.
11/1 12:30 UTC – The new chart shows slight movements around
midnight UTC that have reached Power 18, for the rest just ‘background’
movements around 10.
Frequency means how many wave cycle happen in a second, 1
Hz. means 1 cycle per second, 40 Hz. means 40 cycles per second,
Amplitude is the size of the vibration, how big is the wave, the chart
shows the frequency variation in Hz and the amplitude using the white
color.
Note
The Ancient Indian Rishis called 7.83 Hz the frequency of OM. It also happens to be Mother Earth’s natural heartbeat rhythm
Schumann resonances are named after professor
Schumann who was involved in early German secret space program and was
later paper-clipped into the United States. The frequencies of Schumann resonances are fairly stable and are mainly defined by the physical size of the ionospheric cavity.
The amplitude of Schumann resonances does
change and is bigger when ionospheric plasma gets excited. Ionospheric
plasma excitation happens because of solar activity, thunderstorms, use
of scalar plasma weapons and HAARP and lately also when the Light forces
are clearing the plasma anomaly.
Dependencies of Amplitudes Schumann Resonance November 24 2019
Dependencies of Quality Schumann Resonance Novembre 23 2019
Dependencies of Frequency Schumann Resonance November 23 2019
All the SR daily images in one single pageSee the Images
Explanation of The Chart
The Schumann Resonance Spectrogram Chart
The Schumann Resonance Chart displays data from the magnetic field
detector to monitor the resonances occurring in the plasma waves
constantly circling the earth in the ionosphere. These three days
spectrograms show the activity occurring at the various resonant
frequencies from 1 to 40 Hz. Within the spectrogram, the power, or
intensity level of each frequency is displayed as a color, with white
being the most intense. The Schumann Resonances appear as the horizontal
lines at 0.0, 4.0, 8.0, 12.0, 16.0, 20.0, 24.0, 28.0, 32.0, 36.0 &
40.0 Hz. This chart is based on Tomsk, Russia, time UTC +7 (UTC =
Universal Time Coordinated).
What is a Spectrogram?
The Spectrogram Calendar is a visual representation of the range of
frequencies in the magnetic field at a given location. Similar to how an
equalizer displays the frequency content of music played on your
stereo, the spectrogram calendar displays the frequency content of a
magnetic field. Instead of showing a brief snapshot, it shows changes
over a period of time, in this case 3 days.
The local magnetic field is a dynamic field that changes constantly
because of variations in the ionosphere and sun and many other
influences not yet fully understood. The range of variation displayed in
the spectrogram chart is from 0 to 40 cycles per second. The vertical
axis is frequency and the horizontal axis is time. The amplitude of a
particular frequency at a specific time is represented by the intensity
of color (green, yellow, white) of each point in the image.