Facebook Next? Google will bar political advertisers from
targeting voters on political affiliation to promote increased
visibility of election ads and trust.
Finland launches first gender neutral fire station with individual
dressing rooms and showers, which allows all firefighters to wash at the
same time in private.
Solar explosions create Aurora Borealis in parts of US and Canada,
the unique astral display will be visible in the parts that are located
quite far from the polar regions.
Russian Orthodox Christians believe that taking a dip in the
freezing water on 19 January is an important part of celebrating
Epiphany, or Baptism Day, to wash away one’s sins.
Survey “White Helmets: terrorist abettors and sources of
disinformation” reveals that the non-governmental organization has also
been involved in forcible removal of organs from Syrians living in
militant-controlled zones, according to Russian experts who interviewed
locals.
Bolivia’s ex-president Evo Morales compared the interim government’s crackdown on protests with genocide.
The Swedish retailer IKEA is going to open several thousand pickup points in Russia.
Tech titans Google and Facebook employ “surveillance-based business
models” that threaten human rights and erode privacy worldwide,
Amnesty International said, calling for an end to the data-grabs.
NATO wants the general public to believe is that it had no choice
but to intervene in 1999, because “Kosovo Albanian forces” were fighting
the “policy of ethnic cleansing” of Yugoslav President Slobodan
Milosevic, who was “not interested” in a peaceful solution.
Fewer than 100 protesters remained holed up in a Hong Kong university on Thursday as riot police encircled the campus.
Lebanon lost $10bn in bank deposits since august; bond yields soar past 100% into “Venezuela territory”.
Knife crime in London, UK, jumped by 43% over the last year, 320 ‘bleed control kits’ are to be given to bars.
A story with the wrong “official narrative” was scrubbed by
mainstream media outlets. After reporting on detained migrant children,
AFP and Reuters scrubbed the story when the United Nations revealed it
happened on Barack Obama’s watch.
Goldman Banker on trial had $24,000 hidden in his sunglasses case.
Illinois path toward insolvency just got steeper.
It appears as though someone figured out that red light cameras
could rack up tons more in fines if the number of times a light changes
to red increases. This has led to nefariously shorter green lights in
certain areas of Chicago.
65% of Americans said they could not imagine any circumstances or
information coming out of the inquiry that could still change their
minds about whether President Donald Trump should be impeached or not.
Active Weather on the Planet
Tropical Depression Kalmaegi 26kt – Philippines
Tropical Storm Sebastien 52kt, 999hPa – Caribe
Tropical Storm Fung-wong 61kt – Taiwan
The World’s Shark Attack Hotspots
USA 1441
Australia 642
South Africa 225
Brazil 107
New Zealand 57
PNG 48
Réunion 46
Mexico 40
Bahamas 29
Iran 23
Strongest EQ in Europe M3.5 Azores Strongest EQ in US M4.6 Alaska Strongest EQ on the Planet M6.3 Mexico Deepest EQ M6.3 486 km Russia
News Burst 21 November 2019
Share this: Send the word out using these buttons!
Editor’s Note: Today (11/21) we see a largely quiet Schumann Resonance graph until 6am when a fairly dense high amplitude stream of energy is emitted by the Earth. This opens the door for a continual release of dense mid amplitude energies lasting from 3am through the graphs end at 6am (EST USA).
Please note the release of Schumann Resonance energies are the Earth’s response to receiving cosmic energies of just the right wavelength (unknown wavelength at this time) which cause the Earth to “ring like a bell”. The energies received by any means are having the effect of changing our world for the better, so…please watch this graph, watch our world change, and BE…
Schumann Resonance Today. We will
try to keep you updated about the variations of the Resonance with this
page. The great variations that nobody can explain but that give us a
clear sign that the planet is changing. The Earth is vibration higher
and higher, just like us!
The Chart time is based on Tomsk – Russia – UTC (Universal Time Coordinated) +7Source
RS Base Frequency 7.83 Hz.
Schumann Resonance Today Peaks:
11/21 11:00 UTC – After 3
days of calm today we are seeing new activity, from 5 UTC there have
been some variations initially at Power 20 and at 10 UTC at the peak
until now at Power 23.
11/20 17:00 UTC – Third day of total calm.
11/19 17:00 UTC – Calm.
11/18 17:00 UTC – Today we returned to a condition of very light
activity, there were only two movements that exceeded Power 10, 16 at 6
UTC and 11 at 11 UTC.
11/17 17:00 UTC – The strong activity, that seems to have ended at 9
UTC today, lasted 20 hours. The highest peaks occurred in its initial
part which took place yesterday, today the highest value was Power 30 as
previously reported.
11/17 09:00 UTC – Today is the 17th, lately a day of recurring SR
activity, and the movements started yesterday continued uninterrupted,
the peaks are not at very high values, Power 37 was reached at 00 UTC
today, but the values remained constantly around Power 30.
11/16 23:00 UTC – The strong activity continued but with slightly
less intensity, this period of strong variations started at 6 UTC and
has been above Power 40 for 2 hours, from 15 to 17 UTC. At this time the
maximum values are around Power 30.
11/16 17:00 UTC – Today’s chart shows an initial long period of flat
calm until 1 UTC when very light movements have brought the variations
to reach Power 10 at 9 UTC. From here the movements started to become
more consistent up to starting a strong activity period from 13 UTC
during which the today’s maximum value of Power 46 was reached. It seems
that the movements should also continue in the new chart of Nov. 17th.
11/15 17:00 UTC – The movements continued and grew steadily until 10
UTC when it reached today’s high at Power 22 to returned to normal
values just after.
11/15 09:00 UTC – Shortly after midnight local time from the graph,
corresponding to 17 UTC, we saw a slow and gradual increase in amplitude
values that reached Power 17 at 8 UTC. It seems that the activity
should continue.
11/14 17:00 UTC – Virtually calm, only a few slight movements between 3 and 5 UTC with a maximum of Power 13.
11/13 17:00 UTC – Calm.
11/13 15:00 UTC – The first part of today’s chart day shows absolute
calm, from 1 UTC there are very light movements that have given way to
the light activity of today that lasted for the central part of today’s
chart. During this phase there were 3 peaks that exceeded 20 and others
that touched it, Power 24 was reached at around 6 UTC.
11/12 17:00 UTC – Today’s activity took place over a period of 9
hours, from 3 to 12 UTC, the most intense part with the maximum value of
today as reported previously was from 5 to 8 UTC. The situation is now
shown to be calm.
11/12 08:00 UTC – After several days of intense calm we come to a
new series of movements characterized by rather significant peaks. The
changes started suddenly at 3 UTC and in the span of four hours, at 7
UTC, there was the strongest peak so far at Power 48.
11/11 17:00 UTC – Today was mostly calm, the only variations with a maximum of Power 14 occurred from 7:30 to 9:30 UTC.
11/10 17:00 UTC – Calm.
11/10 11:00 UTC – Not much to say, compared to the calm we see only the “streaks” on the Power 10.
11/9 17:00 UTC – The series of light movements continued without
interruption, a slight drop to values close to calm took place in the
last hours.
11/9 11:30 UTC – In this first part of the day the movements
continued, increasing numerically but with less powerful amplitude
variations whose maximum was Power 25 at 2:30 UTC.
11/8 17:00 UTC – The series of most significant movements of today
lasted about eight hours, from 3 to 11 UTC with the peaks previously
reported, this period has been followed by more slight movements.
11/8 10:30 UTC – From today’s image, we can see how in the last
three days there has been a sort of sequence of movements characterized
by a constant increasing trend, will this coincidentally reach its
maximum on 11 November? The significant peaks of today started at 3, at 6
UTC reached 35 and just before 10 the maximum value of these last 3
days, Power 43.
11/7 17:00 UTC – Slight movements have continued throughout the day,
the highest peak is the one reported previously but shortly after 9 UTC
we can see another variation that has reached Power 27.
11/7 09:00 UTC – The graph in the first part of today shows how the
constant slight movement that began yesterday is continuing. Today we
have had the strongest peak of these last 3 days and reached Power 32 at
3 UTC.
11/6 17:00 UTC – After a couple of days of relative calm today,
shortly after midnight UTC, movements began again which gradually
brought the current peak value of Power 23 to 9:30 UTC. Activity has not
stopped but has continued and at present it seems to see a crescendo
that will lead to higher values.
11/5 17:00 UTC – Today’s activity is very similar to that of
yesterday, slight movements from 1 to 8 UTC with the maximum
value reached of Power 12.
11/4 17:00 UTC – Today the calm has been almost total, very slight variations have reached Power 15 between 6 and 10 UTC.
11/3 17:00 UTC – During the last 24 hours reported in the chart
there were only 3 significant short-term events, the first happened at
19 UTC of yesterday at Power 25, the second movement, which lasted about
2 hours, reached today’s maximum of Power 32 at 6:30 UTC and the last
at 10 UTC at 23.
11/2 17:00 UTC – We could recap today activity with how long the
amplitude remained above 40: 6 hours, from 3 to 9 UTC. Today’s maximum
is Power 98 as previously reported. From 11 UTC the values are back to
normal.
11/2 09:30 UTC – The strong activity that we see in progress at this
time started decisively at the turn of the local midnight,
corresponding to 17 UTC. Initially with peaks at Power 20, within two
hours it reached 30 around 19 UTC. These first movements were followed
by a period during which the amplitude was constantly
oscillating between 10 and 20. At 1 UTC today, the very powerful
activity began, bringing the amplitude close to Power 100. The maximum of Power 98 was reached at 5:30 UTC.
11/1 17:00 UTC – The situation shows the continuation of the
variations also in this second part of the day where the greatest peak
of today was had at Power 21.
11/1 12:30 UTC – The new chart shows slight movements around
midnight UTC that have reached Power 18, for the rest just ‘background’
movements around 10.
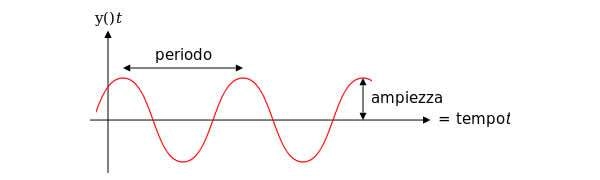
Frequency means how many wave cycle happen in a second, 1
Hz. means 1 cycle per second, 40 Hz. means 40 cycles per second,
Amplitude is the size of the vibration, how big is the wave, the chart
shows the frequency variation in Hz and the amplitude using the white
color.
Note
The Ancient Indian Rishis called 7.83 Hz the frequency of OM. It also happens to be Mother Earth’s natural heartbeat rhythm
Schumann resonances are named after professor
Schumann who was involved in early German secret space program and was
later paper-clipped into the United States. The frequencies of Schumann resonances are fairly stable and are mainly defined by the physical size of the ionospheric cavity.
The amplitude of Schumann resonances does
change and is bigger when ionospheric plasma gets excited. Ionospheric
plasma excitation happens because of solar activity, thunderstorms, use
of scalar plasma weapons and HAARP and lately also when the Light forces
are clearing the plasma anomaly.
Dependencies of Amplitudes Schumann Resonance November 21 2019
Dependencies of Quality Schumann Resonance Novembre 20 2019
Dependencies of Frequency Schumann Resonance November 20 2019
All the SR daily images in one single pageSee the Images
Explanation of The Chart
The Schumann Resonance Spectrogram Chart
The Schumann Resonance Chart displays data from the magnetic field
detector to monitor the resonances occurring in the plasma waves
constantly circling the earth in the ionosphere. These three days
spectrograms show the activity occurring at the various resonant
frequencies from 1 to 40 Hz. Within the spectrogram, the power, or
intensity level of each frequency is displayed as a color, with white
being the most intense. The Schumann Resonances appear as the horizontal
lines at 0.0, 4.0, 8.0, 12.0, 16.0, 20.0, 24.0, 28.0, 32.0, 36.0 &
40.0 Hz. This chart is based on Tomsk, Russia, time UTC +7 (UTC =
Universal Time Coordinated).
What is a Spectrogram?
The Spectrogram Calendar is a visual representation of the range of
frequencies in the magnetic field at a given location. Similar to how an
equalizer displays the frequency content of music played on your
stereo, the spectrogram calendar displays the frequency content of a
magnetic field. Instead of showing a brief snapshot, it shows changes
over a period of time, in this case 3 days.
The local magnetic field is a dynamic field that changes constantly
because of variations in the ionosphere and sun and many other
influences not yet fully understood. The range of variation displayed in
the spectrogram chart is from 0 to 40 cycles per second. The vertical
axis is frequency and the horizontal axis is time. The amplitude of a
particular frequency at a specific time is represented by the intensity
of color (green, yellow, white) of each point in the image.
I
hope that in this year to come, you make mistakes. Because if you are
making mistakes, then you are making new things, trying new things,
learning, living, pushing yourself, changing yourself, changing your
world. You’re doing things you’ve never done before, and more
importantly, you’re Doing Something. So that’s my wish for you, and all
of us, and my wish for myself. Make New Mistakes. Make glorious, amazing
mistakes. Make mistakes nobody’s ever made before. Don’t freeze, don’t
stop, don’t worry that it isn’t good enough, or it isn’t perfect,
whatever it is: art, or love, or work or family or life. Whatever it is
you’re scared of doing, Do it. Make your mistakes, next year and
forever.
Neil Gaiman
Share this: Send the word out using these buttons!
Editor’s Note: Please read this message from our spiritual friends at Eireport (Gaia portal) who use their feminine energy to gauge the vibrational readiness of humanity. This particular message is reassuring, welcoming us into a state of Being…
Editor’s Note: Love or Fear, which do you hold in your heart? Holding Fear in either your mental, emotional, or spiritual self keeps you in a state of lower vibration which, of course, is exactly what the Dark is striving for!
What is the remedy holding you down in a state of inner Fear/Panic? Finding and holding LOVE within your heart will allow you to become a magnetic Light allowing you soothing comfort while broadcasting your positive influence (hope) for the benefit of others.
Learn more about your destiny of Love by listening to this message, pull yourself up (into Love) by your own bootstraps by learning the message Love brings, “let go” of your painful past, and BE…
InJoy!
Share this: Send the word out using these buttons!
Editor’s Note: Love IS the essence of all creation! therefore, the inner is of more value than the outer. As a co-creator, you have built your world with your thought forms. so tap into your inner power and creativity to cross boundaries of limitation with compassion.
Please listen to this message, learn your truths, and BE…
InJoy!
Share this: Send the word out using these buttons!