The backlash comes after the president called COVID-19 a “minor flu” and visited public places, shaking hands with people and encouraging them to keep living normally, despite the pandemic. Brazilian Supreme Federal Court Justice Marco Aurélio Mello forwarded a request for the removal of Brazilian President Jair Bolsonaro to the Attorney General’s Office (Prosecutor General of the Republic, or PGR) on Monday. The request, filed by opposition federal deputy Reginaldo Lopes, accuses the head of state of neglecting the coronavirus threat to the country and creating extreme danger for Brazilians. If the PGR accepts the charges, the case will proceed to the Chamber of Deputies, who will then have to vote on the issue.
Customs and Border Protection (CBP) officers working in Laredo, Texas, discovered nearly $37 million worth of meth in a commercial shipment of tomatoes from Mexico. CBP officers assigned to the Colombia-Solidarity Bridge — an international bridge that crosses over the Rio Grande river and connects Laredo, Texas to the Mexican town of Colombia, Nuevo León — on Wednesday encountered a 2007 Freightliner tractor. Upon a canine and imaging system inspection, a massive discovery was made. Included in the shipment of tomatoes was 654 packages containing about 1,847 pounds of methamphetamine — a load that carries a street value of $36,957,914, according to CBP.
The captain of the US aircraft carrier Theodore Roosevelt has called on Navy leadership for stronger measures to save the lives of his sailors and stop the spread of the coronavirus aboard the ship. The four-page letter, the contents of which were confirmed by US officials to Reuters, described a bleak situation on board the nuclear-powered, 5,000-person carrier as more and more sailors test positive for the virus. Captain Brett Crozier, the ship’s commanding officer, wrote that the carrier lacked enough quarantine and isolation facilities and warned the current strategy would slow but fail to eradicate the virus. In the Mar 30 letter, he called for “decisive action” and removing over 4,000 sailors from the ship and isolating them. “We are not at war. Sailors do not need to die. If we do not act now, we are failing to properly take care of our most trusted asset – our sailors,” Crozier wrote.
The tallest waterfall in Ecuador, the San Rafael Waterfall, has now “disappeared.” In satellite images, one can see how the cascade that used to bring in tens of thousands of visitors each year is no longer flowing. the waterfall stopped flowing on Feb. 2 due to a massive sinkhole that appeared in the Coca River just a few meters before the falls. Because of it, instead of flowing through the San Rafael Waterfall, the water now flows in three separate, less steep courses a few meters behind it. A possibility is that sinkhole may have something to do with the Coca Codo Sinclair hydroelectric plant, which is one of the largest in the country and is just 20 kilometers upstream from the San Rafael waterfall. Although the Coca Codo Sinclair plant is not exactly located in the river, its diversion reservoir system has sand traps that remove river sediment. According to experts, losing river sediments could increase its “erosive capacity.” As it happens, the Coca Codo Sinclair plant was only inaugurated in 2016. VIDEO
Chinese manufacturers of coronavirus test kits and related medical supplies have been told they can no longer export their products unless they also have the relevant licences to sell their products in the domestic market. The move comes after China was hit with a number of complaints from buyers in Europe about the quality and accuracy of tests kits and other products. The new rule applies to all companies seeking to export test kits, face masks, protective clothing, ventilators and infrared thermometers, according to a joint statement issued on Tuesday by the Ministry of Commerce, General Administration of Customs and the National Medical Products Administration. Previously, Chinese exporters were required only to have CE “certification” [printout] to indicate their goods conformed to the health and safety standards required for sale within the European Economic Area.
An exclusive report by Radio Farda puts the number of those who have been hospitalized with coronavirus (COVID-19) symptoms in Iran at over 70,000 people, will over the official figure of positive cases. The report which sums up the figures released by local officials and the Health Ministry in Tehran as well as media reports says 70,108 patients with clinical symptoms of COVID-19 have been hospitalized in Iran’s 31 provinces.
Venus will glide right through the Pleiades star cluster, an amazing conjunction that happens only once every 8 years. At closest approach on April 3rd, Venus will be inside the star cluster. Viewed through binoculars, it will look as if a supernova (Venus) has gone off among the Seven Sisters. To find the conjunction, all you have to do is step outside after sunset and look west. Enjoy the show!IMG LINK
Henan province in central China has taken the drastic measure of putting a mid-sized county in total lockdown as authorities try to fend off a second coronavirus wave in the midst of a push to revive the economy. Curfew-like measures came into effect on Tuesday in Jia county, near the city of Pingdingshan, with the area’s roughly 600,000 residents told to stay home, according to a notice on the country’s official microblog account. Special approval was required for all movement outside the home, it said.
[Reminder 2016] The Clinton Foundation has confirmed it accepted a $1 million gift from Qatar while Hillary Clinton was U.S. secretary of state without informing the State Department, even though she had promised to let the agency review new or significantly increased support from foreign governments. Qatari officials pledged the money in 2011 to mark the 65th birthday of Bill Clinton, Hillary Clinton’s husband, and sought to meet the former U.S. president in person the following year to present him the check, according to an email from a foundation official to Hillary Clinton’s presidential campaign chairman, John Podesta. The email, among thousands hacked from Podesta’s account, was published in 2016 by WikiLeaks. Clinton signed an ethics agreement governing her family’s globe-straddling foundation in order to become secretary of state in 2009. The agreement was designed to increase transparency to avoid appearances that U.S. foreign policy could be swayed by wealthy donors.
Far-left billionaire George Soros is putting millions of dollars into an attack ad campaign against President Trump over his handling of the coronavirus outbreak, as reported by the Washington Free Beacon. The ads come from Priorities USA Action, the largest pro-Democrat super PAC in America, which will spend $6 million this week alone on such ads, targeting the key swing states of Florida, Michigan, Pennsylvania, and Wisconsin. Priorities USA had previously received over $3 million from Soros’s Democracy PAC as recently as February 21st. Priorities USA said that its overall plan is to spend at least $150 million in the general election campaign against President Trump in Rust Belt states, which are the states that will ultimately decide the election. Another group that will engage in such attacks is the American Bridge PAC, founded by far-left operative David Brock. American Bridge has vowed to spend at least $50 million attacking Trump in the Midwest. Brock is affiliated with the Democracy Alliance, another organization that is funded and cofounded by Soros. Lastly, Soros has also most recently funded a project called the Heartland Fund, which intends to target Midwestern and Rust Belt voters in the election. For this effort, Soros teamed up with failed congressional candidate Scott Wallace, who lost his bid for Pennsylvania’s 1st congressional district in 2018.
Malaysian authorities seized about six tons of pangolin scales and smashed a smuggling syndicate, officials said Wednesday, as the country clamps down on rampant wildlife trafficking. Its body parts fetch a high price on the black market as they are commonly used in traditional Chinese medicine, although scientists say they have no therapeutic value. The haul was found Tuesday at a port outside the capital Kuala Lumpur, hidden inside a container along with a shipment of cashew nuts.
A senior official in Serbia’s government died from the coronavirus on Wednesday, a health official said, the second death of a public figure from the disease in the Balkan country. Branislav Blazic, 63, a state secretary with the Ministry for Environmental Protection, died only days after being hospitalized with symptoms of the coronavirus infection, said Daria Kisic Tepavcevic, the deputy director of the Institute for Public Health.
Sun Activity
Earth is exiting a stream of solar wind that sparked bright auroras around the Arctic Circle on March 30th and 31st. Some of the lights even dipped into the USA as far south as Michigan. The next stream of solar wind is due on April 4th.
Strongest EQ in Europe M3.5 Iceland Strongest EQ in North America M4.1 Idaho Strongest EQ on the Planet M5.2 Qumong, China Deepest EQ M4.3 436 km Araban Sea West Indian Coast News Burst 1 April 2020
Share this: Send the word out using these buttons!
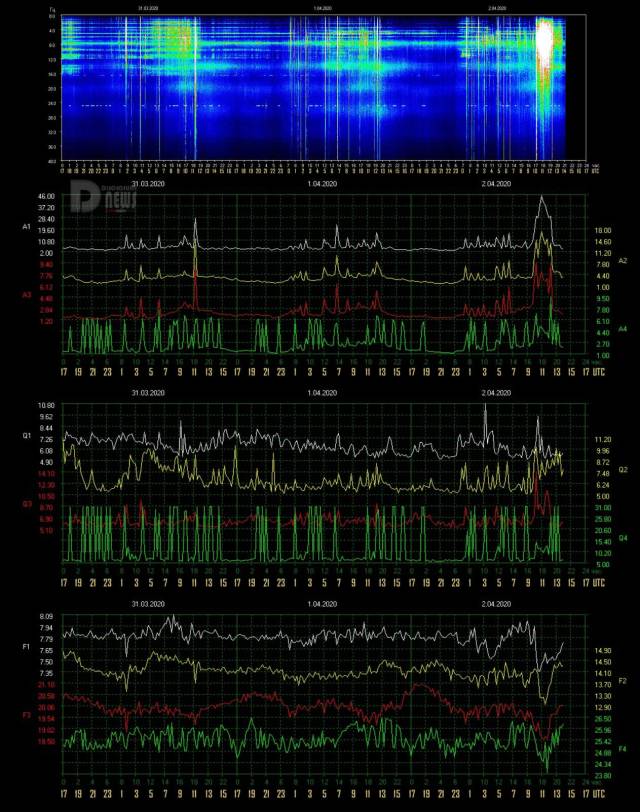
Editor’s Note: Today on April 2, we see right on schedule, a slight proliferation of moderate Schumann Resonance energies are seen in the graph above. Keep in mind the cosmic energies which stimulate the Earth to produce Schumann Resonance energies, which are leading us to holding and BEing in…
Schumann Resonance Today. We will try to keep you updated about the variations of the Resonance with this page. The great variations that nobody can explain but that give us a clear sign that the planet is changing. The Earth is vibration higher and higher, just like us!
The Chart time is based on Tomsk – Russia – UTC (Universal Time Coordinated) +7Source
RS Base Frequency 7.83 Hz.
Schumann Resonance Today Peaks:
“Every second, a multitude of pulses travel around the world in this unique, resonant chamber between Earth and the ionosphere, sending colluding signals to all microorganisms. These signals couple us to the Earth’s magnetic field. Named after their discoverer, these Schumann Resonances (SR) drive the harmonizing pulse for life in our world.” Eric Thompson
4/02 17:00 – There appears to be an interruption in the flow of data that are stuck at 14 UTC, the TSU site works. When they will become available again we will immediately update the situation and the graphs.
4/02 13:30 – After a start to the day that mirrored the previous days with a series of isolated peaks between Power 10 and 15, at 10 UTC there was a powerful increase in activity that led to the maximum value so far of Power 46 at 11 UTC; this strong movement, which has maintained amplitude above Power 30 for about two consecutive hours, appears to have ended at 13 UTC.
4/01 17:00 – Today was characterized by moderate isolated peaks and by the ‘usual’ hatching on 25 Hz, the values were on average between Power 10 and 15, one last movement reached Power 17 at 12:30 UTC.
4/01 10:30 – Once again 10 hours of almost calm, this has been interrupted at 23 UTC yesterday by slight movements around Power 10. These are mostly isolated peaks in sequence and the strongest reached Power 23 just before 7 UTC.
3/31 17:00 – Calm.
3/31 12:00 – In the new graphs can be seen that the “almost calm” lasted 6 hours, from 19 yesterday to 1 am UTC today when new movements started which led to a spike that reached Power 15, this was followed by other variations between Power 10 and 15 until 11 UTC when a new peak has reached Power 28.
3/30 17:00 – The horizontal bands are back while the dotted line generated by Quality remains. The amplitude values, on the other hand, are almost calm.
3/30 14:00 – How long since the last totally calm day? Today the movements once again show moderate activity starting around 4 UTC and continuing with a steady slight increase up to the strongest peak so far at Power 19 at 11 UTC. The dotted line on 25 Hz also continues with what now seem to have become consuetudine, Quality Q4… all these Q should make you think.
3/29 17:00 – Almost calm.
3/29 14:30 – Today’s new activity began very gently after midnight UTC when the amplitude very slowly started a steady increase. The maximum values were of medium intensity, Power 20 was reached at 10 UTC and at 13 the situation returned to calm. The Quality Q4, which has graphically generated a sort of ‘Morse Code’, also appears to be in the subsidence phase.
3/28 23:00 – The new graphs show what apparently seems calm, in reality the dotted line continues on the 25 Hz line due to the dense and continuous variations of the Quality Q4. The intense green coloring on the 8 Hz line seems to be due to the A4 amplitude.
3/28 17:00 – A last isolated movement at Power 29 at 13:40 closes the today’s graph (local timeline) but not the slight movements of the Quality.
3/28 14:00 – What graphically seems to have been the period of the “bands”, from around 1 UTC on 26 March, is apparently closing with the latter peak at Power 45 at 12 UTC today, so just under 3 days when the activity, between ups and downs, it has been practically continuous.
3/28 11:00 – Another day of significant activity, given the situation on the planet, it seems obvious that this could be the case. The first movement, as previously reported, reached Power 30 between 18 and 19 UTC yesterday; the second occurred at midnight UTC, from 11 pm to 1 am, and was the maximum value reached so far, Power 47. The latter was followed by a period of relative calm until 10 UTC when a new leap brought the amplitude at Power 33. A purely personal interpretation of these movements could be the updating of the Etheric DNA, 9 strands are involved which have had one of the many “firmware updates”, this first group was completed at 12; the second group of 8 was completed at 18 and the filament 5, at 7.83 Hz, was done powerfully at midnight UTC. It appears that there are now 4 left.
3/27 21:00 – The activity has steadily and slowly increased since 13 UTC yesterday, with the new charts we see a strong peak that has brought amplitude to Power 30, the movement started at 18 UTC and lasted about 1 hour.
3/27 17:00 – There was a drop in the highs reached but the activity remained significant. A series of variations between 11 and 13 UTC, accompanied by a dive in the frequency, reached Power 20 once again but in this period of time we have been for about an hour and 30 minutes above Power 15. The horizontal bands continue even if with less intensity. Has anyone tried to decipher the Morse Code formed by lines and dots on the Frequency of 25 Hz in the main graph?
3/27 11:00 – No calm today, after the series of “stripes” which have remained at an amplitude around Power 10 some significant movements have interrupted this peculiar “graphic”. The first movements beyond the 10 threshold occurred at 5 UTC with what is the strongest peak so far, Power 26, correlated with a discreet leap in frequency, an increase. Between 7 and 8 UTC it reached Power 20 but even if the amplitude was smaller a strong oscillation of the frequency, a decrease this time, brought the ECC close to the value of the previous peak.
3/26 22:30 – In the new chart we see a rather particular graphic representation consisting of a series of horizontal lines, instead of the usual vertical ones, spaced by a few Hz in the lower part of the frequency band while the distance increases slightly as the frequency increases, the last line corresponds to 14. Difficult to give an explanation with the data shown in the graphs.
3/26 17:00 – Today we had two peaks at Power 17, at 1 am and 2 am UTC, these were followed by a very light activity that touched Power 10 on several occasions, always keeping the light movements constant. Note the strong Quality peak that occurred at 1 UTC when it reached 17×2, Power 34, which, together with a sudden drop in frequency to 7.27 Hz, brought the ECC to 78 as shown in the table below. From 14 UTC it seems that a more intense period has started. The dotted line in the main chart si continuing, generated by the values of Quality 4.
3/26 01:30 – After about 13 hours of calm we had this isolated peak at Power 17 at 1 am UTC.
3/25 17:00 – Today’s activity took place in a time span of 8 hours, from 2 to 10 UTC, the maximum value reached was Power 41 at 8:15 within a period of about 2 hours, from 7 to 9 UTC, with greater intensity. From 14 UTC, a calm situation seems to have returned.
3/25 08:30 – We had about 12 hours of almost calm until 2 UTC when new movements suddenly brought the amplitude around Power 35 with two peaks at 2:30 and 4 UTC. From 7 UTC it seems that the intensity is increasing towards Power 41 and beyond at 8 UTC.
3/24 17:00 – The last 24 hours have been characterized by an initial part of calm, from 17 to 2 am UTC. All the parameters in the graphs show minimum values, even the dotted line generated by the Quality has stopped. Just before 2 UTC, slight variations began with Amplitude between Power 10 and 15, also Quality and Frequency have resumed the movements. Around 9 UTC in the main graph we can see a more intense coloring due to the decreasing movements of Frequency and increase of Quality value. The highest peak in Amplitude was at 4:30 UTC at Power 17 while the combination of all parameters gave an ECC peak at 36 at 9 UTC, compared to 24 of the previous peak.
3/23 17:00 – The activity decreased gradually, the last peak in time order was at about 13 UTC and reached Power 15, however there are still variations especially in the Quality which with “rhythmic” movements is apparently “drawing” the dotted line on the 24 Hz in the main graph.
3/23 11:30 – Moar movements occurred with another series between 8 and 10 UTC, here the maximum reached was Power 30 at 8 am and Power 20 at 9:30 UTC.
3/23 04:30 – We are on the move again, after about 4 hours in which the variations have reduced, since after midnight UTC we see a gradual increase, Power 15 has been exceeded at 2:30 and for about 1 hour we have remained on that value until a strong peak has brought the SR back to Power 46.
3/22 17:00 – Let’s summarize the activity shown in today’s chart. The movements lasted 12 hours, from 5 to 17 UTC. The most important part started at 10 UTC and is still ongoing. The peaks were initially Power 50 and then moved to Power 60 around 13 UTC. At the time of this update there are strong isolated peaks but very close to each other that reach between Power 40 and 45.
3/22 15:00 – This wave of very strong activity has reduced fro now, started at 10 UTC went above Power 40 at 11 and has returned below the threshold of 40 at 14 UTC, 3 hours of very strong activity in which the average was Power 50.
3/22 12:30 – Big movements in progress, after the ‘opening’ at Power 50 a much more powerful activity started at 9 UTC and brought the maximum to Power 56. The changes have been significant in all parameters and at the time of this update Gaia is still telling us something.
3/22 08:30 – We’re back to a condition of strong activity, at 5 UTC we had a first movement and within 40 minutes we had a powerful peak at Power 50 for the duration of 20 minutes until 6 UTC. This initial spike has been followed by another, Power 23 at 7 UTC. The movements seem to continue.
3/21 17:00 – Today was a mild activity day, the slight variations that colored the main graph were of the Quality and Frequency. A line around 24 Hz can be seen in the primary graph, it started at 9 UTC yesterday and stopped almost exactly 24 hours later at 9 UTC today. The detector that generated this line seems to be that of the Frequency, the F4 detector has measured almost the same value for 24 hours.
3/20 17:00 – After the maximum peaks occurred during the UTC night, the movements continued with ups and downs but never stopped. At 9 UTC a surge in amplitude reached Power 34 and then lowered around Power 10, and so it remained practically until this update. In the last hours of the main graph a “colored” activity is shown, in this regard the cause of this “coloring” is due to the wide variations both in Quality and Frequency, the latter increasing. In this regard, although the variations in frequency may seem minor, these have a strong impact on the main graph and consequently on the Energy of the Collective Consciousness.
3/20 09:30 – Even today strong activity, for three days the movements have been almost continuous and at the time of this update we are above Power 30. The most massive part so far has started just after midnight UTC, the changes have brought the amplitude gradually to Power 44, this value was practically maintained for almost two consecutive hours, from about 2 am to 3:30 UTC. Thereafter there wasn’t a real pause, but only a decrease in the amplitude of these movements which once again reached a significant peak at 9 UTC with Power 34.
3/19 22:00 – As anticipated, after a series of slight movements straddling the change of graphs, from 21 UTC there has been about an hour of activity that brought the amplitude of the SR first to Power 22 and then to Power 32 just before 22 UTC.
3/19 17:00 – The activity has decreased in the period from 12 to 17 UTC but in the last two hours there are fluctuations in the Quality which, together with a slight increase in the Amplitude, suggest a restart of the movements.
3/19 11:00 – Even today we are having some activity, isolated peaks with increasing amplitude started from 1 UTC, the most significant movements were at 7:30 UTC with Power 28 and at 9:30 UTC with Power 32.
3/18 17:00 – The activity lasted about 20 hours, from 19 UTC yesterday to 15 UTC today. Now the movements have decreased significantly.
3/18 09:30 – A day of strong activity, Gaia is responding to the moment of strong impact. The strongest peaks so far have occurred in the UTC night when at midnight the amplitude reached Power 50, they were not isolated movements but a set of variations of all the values reported. From 7 UTC to now, even if the amplitude fluctuates around Power 40, both the Quality and Frequency are having very strong movements, bringing the ECC to 85.
3/18 00:00 – The new graphs started with a bang, after a first peak at Power 36 at 19:30 UTC the activity continued as predicted and continued to increase, from 21 UTC the movements increased in intensity to reach Power 45 at 22 UTC, from what we can see it seems that there will be be further activity.
3/17 21:00 – The new charts, of March 18 but technically still on 17 in UTC time, show a moderate activity that started shortly after 18 UTC and that in about 1 hour brought the amplitude to Power 36. The activity seems to continue.
3/17 17:00 – Calm.
3/17 10:30 – Another day of light activity, so far the maximum has been reached at 00 UTC today with Power 14.
3/16 17:00 – Today we saw quite significant movements started at 3 UTC and continued until 14. The maximum values did not reach high peaks but the variations of all three parameters gave a much more intense coloring than yesterday. Now it seems that we have entered a period of calm, we shall see if “Coincidence 17” will be repeated with the new graphs.
3/16 07:30 – Today’s activity has become more relevant but not so much for the variations in amplitude but rather for the movements that we can see in the line graph of the Quality and the drop in that of Frequency. This series of movements is highlighted in the main graph in the period from 3 to 7 UTC. The activity is continuing.
3/15 17:00 – No changes, slight background activity.
3/15 11:00 – The activity continued with slight movements as yesterday but with a slight increase, the strongest peak in the new charts occurred shortly after 19 UTC yesterday and reached Power 32. Subsequently, the background hum remained with variations of both Quality and Frequency, from these the lively coloring of the main graph.
3/14 17:00 – Today’s, shown in the graphs, is divided into two parts, the first characterized by calm, the second by slight movements around Power 10 that seem to continue.
3/14 11:30 – Today’s graphs show that from 2 UTC the light movements are almost continuous, the amplitude of these variations is moderate reaching several times the maximum of Power 13.
3/13 17:00 – After the peak previously reported at Power 42, which was the strongest of the day, light movements continued until 11 UTC with a final jump to Power 13 and since then it has been calm.
3/13 10:30 – In the new graphs we can see that from just after midnight UTC slight movements began which, up to 7 UTC, had oscillations of amplitude around Power 10. From 7 to 8 UTC there was a strong peak that led the amplitude at Power 42, after this movement we went back to a slight background activity.
3/12 17:00 – After the strong peak at Power 57 between 8 and 9 UTC, the activity completely and suddenly subsided returning to a calm state.
3/12 9:00 – March 12 is a special day, we would have liked to make a prediction… In any case, the activity had a small surge in yesterday’s UTC evening, between 19 and 22, with variations in amplitude that reached Power 20. These were followed by relative calm until 6 UTC when we had an isolated peak at Power 24. At 7 UTC the strongest activity so far began, and brought amplitude to Power 57 between 8 and 8:30 UTC. The ECC for this peak turns out to be 90, see table below.
3/11 22:00 – As anticipated, with the new charts we see that the activity has returned with a crescendo that, from 19 UTC, has led the amplitude to reach Power 20 at 21 UTC. The activity seems to continue.
3/11 17:00 – Slight movements continued after 7 UTC reaching a maximum of Power 8 at 14 UTC. Not much after, just at the time of this update seems like new movements are starting.
3/11 13:00 – The latest updated graphs show a period of calm that lasted from 10 UTC yesterday until 1 am when a series of very light movements around Power 10 started, these oscillations continued until 7 UTC, from that moment calm seems to have returned.
3/10 17:00 – Always and only 17, after the peaks at Power 17 the calm began at 17 local timeline, 10 UTC.
3/10 09:30 – The activity continued even if all along at moderate levels, the peaks continued around Power 17. We got it, 17… 5:5 🙂
3/9 17:00 – Power 17 remained the highest value on today’s chart but there is still a slight background activity.
3/9 13:00 – The new graphs show that a slight activity has always been present for almost 48 hours. The most significant movements, so far, have started around 1 UTC when the amplitude has exceeded Power 10. Around 6 UTC there was a further increase in Power 13 and at 10 UTC we had Power 16. The crescendo is continuing and at the time of this update we are at Power 17.
3/8 17:00 – From 13 UTC the activity started to subside.
3/8 15:00 – The last 24 hours have been characterized by an average activity with the most intense part in the hours preceding midnight UTC. For the remaining part, the movements were continuous but limited around Power 10, shortly after 17 of the local timeline (10:30 UTC) there was a movement that reached Power 17.
3/7 22:00 – We had anticipated that we could have a significant activity and so it is. The rise was constant until 21 UTC when a powerful peak reached Power 41.
3/7 17:00 – Around 15 UTC started what appears to be the beginning of an activity that could become significant, the amplitude exceeded Power 10 just before 17 UTC.
3/7 13:00 – Not much to report except that the very light background movements have continued, in today’s graph we can note two isolated peaks, one at 18 UTC yesterday that reached Power 13, and one at 11 UTC today that reached Power 14.
3/6 17:00 – After a calm night (UTC), very light movements began at 3 UTC which almost cyclically brought the amplitude to Power 13 around 7 am UTC, the maximum value of today, which was repeated at 9 UTC. After these last light isolated peaks, the very slight background movements continued.
3/5 17:00 – After the last isolated peak at Power 22 happened at 13 UTC, the movements quickly subsided and we are now in a calm condition.
3/5 13:00 – The activity in today’s chart occurred in three distinct periods: from 18 to 20 UTC (yesterday) when we had the strongest peak so far at Power 36; around 1 UTC with the maximum of 29 Power; from 9 to 11 UTC with various movements that had the maximum at Power 22. If we analyze the three line graphs we see that the strongest peak, in terms of ECC, was that at 8 where we see significant variations in quality and in frequency, the value is 59.
3/4 20:30 – The slight movements that we saw at the passage of the new chart were the preamble to a series of significant spikes that started around 18 and in a few minutes brought the amplitude to Power 26, which was followed, about an hour later at 19:30 UTC, by a further increase to Power 36.
3/4 17:00 – Minor movements around Power 10 continue.
3/4 09:00 – The calm period lasted about 20 hours, from little after midnight UTC some slight movements started and reached the maximum at Power 9, from 5 UTC the values slightly increased up to Power 11. Looking at the frequency graph we see that it is actually in a downward peak, possible indicator of more powerful activity.
3/4 00:00 – The total calm in which we are in has lasted for more than 12 hours.
3/3 17:00 – The last two isolated movements, before the calm, occurred at 9 and 11 UTC reaching Power 9.
3/3 10:00 – In the new main graph we see a series of very close vertical thin lines that begin shortly after midnight UTC and from 6 am start to fade out. The peaks have been of moderate values, so far the maximum has been Power 13 just before 4 UTC. It can be noted, once again, how the movements that have the most ‘chromatic’ impact on the graph are those that have seen changes also in the Quality.
3/2 17:00 – Other minor movements in the latter part of the day around Power 10 occurred between 9 and 12 UTC, after which it was calm.
3/2 09:00 – Today’s chart shows a calm condition until 1 UTC when few slight isolated movements started, they occurred over a 8 hours hours period, until 9 UTC. The maximum value reached was Power 21 at 5 UTC, this specific movement saw frequency and quality oscillations, in addition to the amplitude, and the ECC value was 43.
3/1 17:00 – Today’s graphs show two different types of activity, one given only by the Amplitude, identified by the isolated white lines, and one given by the other parameters, with various colors of green yellow and red. Today’s periods of greatest activity do not correspond to the maximum amplitude peaks, which reached Power 10 just before 1 UTC. The most intense, relatively speaking, part instead took place from 20 to 21 UTC yesterday.
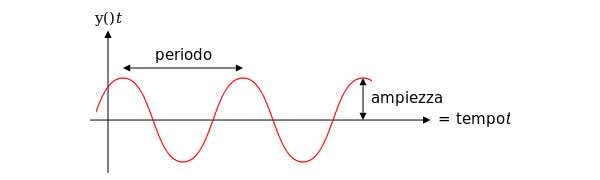
Frequency means how many wave cycle happen in a second, 1 Hz. means 1 cycle per second, 40 Hz. means 40 cycles per second, Amplitude is the size of the vibration, how big is the wave, the chart shows the frequency variation in Hz and the amplitude using the white color.
Note
The Ancient Indian Rishis called 7.83 Hz the frequency of OM. It also happens to be Mother Earth’s natural heartbeat rhythm Schumann resonances are named after professor Schumann who was involved in early German secret space program and was later paper-clipped into the United States. The frequencies of Schumann resonances are fairly stable and are mainly defined by the physical size of the ionospheric cavity. The amplitude of Schumann resonances does change and is bigger when ionospheric plasma gets excited. Ionospheric plasma excitation happens because of solar activity, thunderstorms, use of scalar plasma weapons and HAARP and lately also when the Light forces are clearing the plasma anomaly. Show entriesSearch:
All the SR daily images in one single page See the Images
Explanation of The Chart
The Schumann Resonance Spectrogram Chart
The Schumann Resonance Chart displays data from the magnetic field detector to monitor the resonances occurring in the plasma waves constantly circling the earth in the ionosphere. These three days spectrograms show the activity occurring at the various resonant frequencies from 1 to 40 Hz. Within the spectrogram, the power, or intensity level of each frequency is displayed as a color, with white being the most intense. The Schumann Resonances appear as the horizontal lines at 0.0, 4.0, 8.0, 12.0, 16.0, 20.0, 24.0, 28.0, 32.0, 36.0 & 40.0 Hz. This chart is based on Tomsk, Russia, time UTC +7 (UTC = Universal Time Coordinated).
What is a Spectrogram?
The Spectrogram Calendar is a visual representation of the range of frequencies in the magnetic field at a given location. Similar to how an equalizer displays the frequency content of music played on your stereo, the spectrogram calendar displays the frequency content of a magnetic field. Instead of showing a brief snapshot, it shows changes over a period of time, in this case 3 days.
The local magnetic field is a dynamic field that changes constantly because of variations in the ionosphere and sun and many other influences not yet fully understood. The range of variation displayed in the spectrogram chart is from 0 to 40 cycles per second. The vertical axis is frequency and the horizontal axis is time. The amplitude of a particular frequency at a specific time is represented by the intensity of color (green, yellow, white) of each point in the image.
Greetings My Beloved Masters of the Universe! As many of you are already aware on April 4th we are in for a spectacular and very important gateway in which we can join together and send out nurturing love frequencies to the entire planet in order to neutralize and transmute all the negativity that is being released and experienced by many on this planet right now. This is also a fantastic day to tune into that which we truly wish to experience. On this day two titans are doing their dance in the sky and we are invited to not only watch the show, but fully participate in it.
Last night I had a very interesting dream. It went like this: I see a meteorite flying through the nightly sky, it’s flying very fast and with incredible intent. I see it coming closer and closer and crashing into my back yard. It lands right next to the house and begins to burn and explode, after the fire dies down I see that it created a perfectly rectangular deep hole. All of a sudden, I see water rising and moving into the house. Everywhere there’s water. I am distressed as to the amount of work that we will need to do in order to fix this damage and that the house is going to be destroyed. Then all of a sudden my mom appears and says why are you so distressed, the water will eventually subside, the house will dry, but look outside, look on the bright side, now you have a perfect place for a swimming pool! You don’t need to put as much effort into building one. I look again and realize that she is right, the house will be much more interesting now that it has a swimming pool. Then I wake up. I don’t have a house that needs a pool. But the message from this dream was clear!
Everything that we are all going through right now is perfectly showcased in this dream. A catastrophe… Fear…Destruction of the old…Discomfort… and then… Realization that NEW has arrived and that this NEW even though at first it looks like destruction, is really CREATION and IMPROVEMENT, seeing OPPORTUNITY and POSITIVITY in a rather complex and at a first glance dire situation.
On April 4th we have a beautiful conjunction of Jupiter and Pluto, planets of destruction and creation, which is giving us an opportunity to rise from the ashes of the past and rebirth anew! This is a perfect time to once again let go of that which is clearly no longer working for us, both on a personal and collective levels.
I am sure that in your life there are many things right now that are asking and demanding to be released. All areas of our lives are affected right now as the whole world is going through a major cleanse. Some are still not comprehending that this is so, and are confused and are grieving the old system, which is absolutely okay and is important to do. It is important to say goodbye to all the experiences of the past, to evaluate everything that has been, weight everything on scale of “do I really need this?” and let go of anything that is no longer working for you. As we have all seen, the time has come to let go, whether we want to on a conscious level or not, because on a subconscious level we have all made this decision together to change, to let go and to build a new world together.
On April 4th, we are given an opportunity to tune into these destructive and creative energies. An opportunity to bathe in crystalline energies and release, finally release by realizing and understanding what is no longer needed in our lives, while at the same time clearly seeing what is needed and what we truly want! But because we are entering a completely new territory the time of taking and taking is over. This is a time of both GIVING and RECEIVING. I talk a lot about this concept in my Abundance Online Course. (https://annamerkaba.mykajabi.com/offers/qhCKYqjW/checkout).
It is important to learn how to GIVE in order to RECEIVE and vice versa. We are entering a time of balanced exchange of energies, no longer one sided and it is important for us to realize this as we connect with the divine on April 4th and map out our abundance plan for the coming of times. As we tune into abundance we must remember to not just ASK TO RECEIVE, but also ASK TO GIVE.
Therefore, as you sit down and think of all the things that you want to let go of on April 4th, and all the things that you want to attract to you, please remember to also ask the following question “How can I be of service to others? What can I GIVE so that I can RECEIVE?” And if you are having issues receiving ask for guidance on how to learn how to RECEIVE so that you can continue to GIVE.
It is important to learn how to give, after all if you pay attention to nature you will see that in nature this concept of giving to receive is absolutely integral to thriving. I learned this by observing trees, bushes etc. A tree is stationary, it cannot move, but it needs to proliferate, it needs to have offsprings, it needs to have nutrients, etc to thrive. So what does a tree do? It doesn’t stand there expecting that someone will take care of its needs, it begins to GIVE. It gives through the blooming flowers which attract bees and other insects that need the nectar from flowers, when they collect the nectar it helps to pollinate the flowers on the tree, which then turn to fruit, which is then picked up by an animal that will eat it and carry the seed further out into the forest where it will burry it into the ground and then another tree will be born.
So what happened here? A tree needed to proliferate and so it GAVE to insects and animals who in turn helped it to achieve it’s intended goal. This is what we all need to learn in the new age, to start the process of RECEIVING by GIVING. So, start thinking of what you can GIVE to another and what you truly want to RECEIVE. Begin by analyzing your everyday actions, think about what you are doing and what your behavior attracts into your life. Release everything that no longer feels right to you, and tune into the changing energies that are coming our way.
Things are not going to be the same ever again and it is important that we learn how to work with the new, that is entering our lives, instead of holding onto the old that is clearly asking to be released. So please take this opportunity to say goodbye to everything that is waiting to leave, cleanse your space and open the door for new beautiful experiences and opportunities which are waiting for you. Again, on April 4th we have an opportunity to tune into new energies of abundance on all levels, evaluate what abundance truly means, and use the new energies to shift this world into positive gear. We are blessed with these supporting energies which are compelling us to truly look into what we have created, and restructure our lives. And, even if at this moment the changes feel a bit forced upon us, deep down inside we know that they are for the greater good of ALL involved. So, let us then join together on April 4th and make the best use of these energies!
Share this: Send the word out using these buttons!
I hope you and your family are safe and staying healthy.
I wanted to have a video for your April forecast, but I’m still recovering (and getting better every day!
Thank you so much for all the well wishes and health advice I’ve received. It warms my heart and is so helpful!
I wanted to give you some insight about the numerology for this month, because April certainly has its gifts and challenges.
In numerology, April 2020 is an 8 Universal Month. 8 is known as the number of expansion and abundance.
It is also the number of STRENGTH. You often learn strength through adversity.
If you look at the sacred geometry of the number 8, it is the vertical representation of the infinity symbol.
There is a sphere (representing wholeness and connectedness) at the top and another on the bottom.
The two spheres are connected with an unbroken line.
This is the holistic connection we have between Heaven and Earth.
There is a divine reason for everything we experience in life, regardless of what we see with our physical eyes.
We are all connected.
8 reminds us of the regenerative power of life. We can have great losses and great gains. Through adversity we are tempered. When we are tested in the material realm, we often gain spiritual strength and wisdom.
April is the 4th month of the year. When the 4 and 8 are together, it usually denotes fateful events.
This is a time to focus on your physical fortitude as well as your purpose.
Focus on strengthening your spirit as well as your body.
Bring light into your aura and send light from your heart into the world.
I’ll have more to say about April’s energy soon. (Hopefully, I’ll be back to filming videos next week after I regain some of my physical strength).
In the meantime, stay safe.
Love, ~ Kari
Share this: Send the word out using these buttons!
Editor’s Note: (Thanks H!) Ok, yep…things are surely c-r-a-z-y out there for sure and for real. Lightworkers know what’s happening and will get a kick from this humorous video.
The business at hand is serious…no doubt about that, yet having a good laugh in these times is just as important! Humor raises vibrations, allowing us ALL to hold and BE in…