Shibl al-Zaydi, secretary general of IRGC backed Kata’ib al-Imam Ali is among whom are targeted by the #USAF in this airstrike at Taji, North of Baghdad. But he’s alive on twitter… Mandela Effect.
The US has already identified all targets if Americans are threatened in response to Washington’s killing of Iranian Revolutionary Guards’ Quds Force commander Qasem Soleimani, US President Donald Trump said in a statement on Friday.
Hong Kong’s embattled police officers have been paid HK$1.2 billion in overtime and other allowances since anti-government protests began in June.
Landry’s, a popular restaurant chain in the United States, has announced a malware attack on its point of sale (POS) systems that allowed cybercriminals to steal customers’ payment card information. Landry’s owns and operates more than 600 bars, restaurants, hotels, casinos, food and beverage outlets with over 60 different brands.
The Brookings Institution, Nov. 2019: “53 million Americans between the ages of 18 to 64—accounting for 44% of all workers—qualify as ‘low-wage.’ Their median hourly wages are $10.22, and median annual earnings are about $18,000.” [How long can it last?]
In late December, Carlos Ghosn fled to his native Lebanon on a private jet from Japan, where he was awaiting trial on charges of financial misconduct stemming from his stint as chairman and CEO of the auto manufacturer Nissan.
Mysteries airstrikes targeted late on January 4 a camp of the Popular Mobilization Unit (PMU) near the Iraqi-Syrian border, the al-Hurra Iraq TV reported, citing security sources. The U.S.-based news channel didn’t provide any details on the matter. However, other sources claimed that airstrikes killed at least five personnel of the PMU. Al-Hurra’s report was confirmed by the al-Mayadeen TV, which said that the targeted camp is located within Syria’s territory. The airstrikes coincided with rocket attacks on the Iraqi capital and its outskirt. The attacks targeted the U.S. embassy in the Green Zone as well as the Balad Air Base, north of the capital.
Air India Chairman and Managing Director Ashwani Lohani debunked rumours regarding shutting down operations of the airline, calling them “baseless” while asserting that it still was India’s biggest carrier. “Rumours regarding Air India shutting down or closing operations are all baseless. Air India would continue to fly and also expand and there should be no cause for concern whatsoever to travellers, corporates or agents. Air India the national carrier is still the biggest airline of India,” Lohani tweeted.
President Putin said that he had in mind the “issues related to overcoming stagnation in areas of citizens’ incomes, reducing the number of people living at the minimum wage, and overcoming poverty.” “These decisions must take place,” he said.
Bushfires burned dangerously out of control on Australia’s east coast on Saturday, fanned by high temperatures and strong winds that had firefighters battling to save lives and property, as a change in wind conditions merged several large fire fronts.
Jo Rae Perkins is already counting on being called crazy for believing in the QAnon conspiracy theory, but it’s a risk she says she is willing to take while she campaigns for a third time to represent Oregon’s 4th Congressional District in the United States House of Representatives.
In Early November, Oren Levy had his shipment of legal hemp confiscated by the New York Police. They even bragged about the “drug bust” on social media. Too bad it was perfectly legal. Levy even had the documentation to prove it, included in every box of the shipment. After almost two months, and nearly destroying Levy’s perfectly legal CBD oil business, charges were dropped. Levy is now suing the NYPD, the City of New York, and possibly FedEx for alerting the authorities in the first place.
Despite their tender age, two brothers of 9 and 10 years of the populous Librino district of Catania, Italy, ran an abusive bar in which there was also a games room and a fireworks store. All illegally occupying public land and in part a property of the municipal administration.
Nancy Pelosi and the Iranian Boss of Twitter Inc. – Omid Kordestani – are mourning the loss of Their Dear Friend Qassem Soleimani. Omid Kordestani = Executive Chairman of Twitter Inc. This is the guy who is shadowbanning and censoring.
Strongest EQ in Europe M4.0 Italy Strongest EQ in US M3.4 California Strongest EQ on the Planet M5.5 Nicaragua Deepest EQ M5.1 230 km New ZealandNews Burst 5 January 2020
Share this: Send the word out using these buttons!
Editor’s Note: It appears transmission problems stemming from “whatever” have been cleared allowing us to see the Schumann Resonance graph for the last 48+ hours. In the last 24 hours,we see an intense spike of higher density and higher amplitude (but not off the charts) at 7pm (EST, USA). This was followed from 11:30 until midnight (EST, USA)by an even stronger amplitude, high density sequence.
Please note these energies, note your world changing to BE…
Schumann Resonance Today. We will try to keep you updated about the variations of the Resonance with this page. The great variations that nobody can explain but that give us a clear sign that the planet is changing. The Earth is vibration higher and higher, just like us!
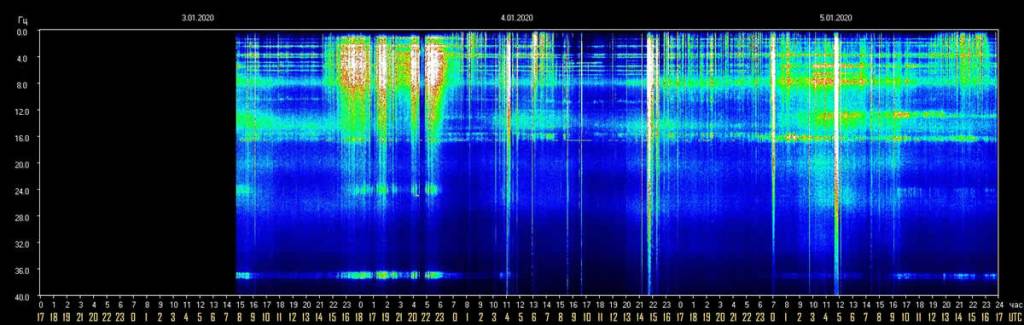
The Chart time is based on Tomsk – Russia – UTC (Universal Time Coordinated) +7Source
1/5 8:00 UTC – Today, together with the second part of yesterday, was characterized by fairly powerful but isolated peaks; two have occurred, the first at Power 21 took place at 00 UTC, the second, much more powerful, reached Power 48 at 4:45 UTC.
1/4 17:00 UTC – Today the activity has almost been continuous, in the first part of the day shown on the graph the amplitude peaked around 15 while in the second half the variations were more sporadic but reached the peak of Power 43 at 13:40 UTC. The situation is now calm.
1/4 8:00 UTC – After the not so uncommon data blackout, but peculiar for it’s duration, the restored flow shows a light activity that topped several times between Power 13 and 15, maximum for now was at 6 UTC.
1/3 17:00 UTC – Calm until the end of the chart when some variations seems about to start.
1/3 10:00 UTC – We are back to normal operations after the data blackout which lasted approximately 17 hours. The first available data show a calm situation.
1/2 18:00 UTC – The publication of the new data stopped at 16 local time in Tomsk, corresponding to 9 UTC. So far the darkening has lasted 9 hours.
1/2 15:30 UTC – The activity continued in a very moderate way throughout the day, the maximum at about power 14 has been temporarily reached at 1 and 6 UTC.
1/1 17:00 UTC – The second part of today’s graph shows a marked increase in activity even if the peaks have remained relatively low. The movements started at 12 UTC and lasted until 17, the highest peak was at Power 25.
1/1 11:00 UTC – Today, like yesterday, it seems a calm day, the maximum values once again reached Power 10 momentarily around 6 am UTC.
12/31 17:00 UTC – Calm.
12/31 11:30 UTC – Calm.
12/30 17:00 UTC – Calm.
12/30 10:00 UTC – After yesterday’s very strong activity, the situation remained calm for about 9 hours until about 21 UTC (yesterday), when new moderate movements began which lasted almost 4 hours until 1:30 UTC. During this period the maximum amplitude value reached has been Power 30.
12/29 17:00 UTC – Today’s activity lasted 13 hours, from 23 (yesterday) to 12 UTC (today), the average was about Power 70 and only once, briefly for about 15 minutes around 8 UTC, the amplitude went below Power 40. Graphically it looks like a column of light.
12/29 13:30 UTC – In the second part of the day shown in the graph it is highlighted how the intensity of the variations has remained substantially unchanged and has generated the strongest peak of the day at Power 93. It seems that, suddenly as they started, the movements have rapidly dropped to normal values at 12 UTC.
12/29 09:00 UTC – The situation changed suddenly at 23 UTC when a series of movements began and led the amplitude values to reach Power 72 at 7 UTC, from that moment onward the amplitude remained on values between Power 65 and Power 80 with the peak maximum at Power 82 at 1:30 and 2 UTC.
12/28 17:00 UTC – Calm.
12/27 17:00 UTC – Calm.
12/27 13:30 UTC – What appears to be all of today’s activity took place in four hours, from 4 to 8 UTC. During this period there were 4 peaks, each stronger than the previous one, and the last one at 7:30 UTC at Power 38 was the strongest.
12/26 17:00 UTC – Calm.
12/25 17:00 UTC – The activity seems to be in slight and constant decline, today two slight peaks, the first at Power 18 at 3 UTC, the second at Power 12 at 12: 30 UTC.
12/24 17:00 UTC – Today’s activity lasted for about eight hours, from 2 to 10 UTC, the highest values occurred between 6 and 7: 30 UTC and reached Power 27.
12/23 17:00 UTC – Power 34 isolated at 10:30 UTC was all the activity for today.
12/22 17:00 UTC – Today we could say that total calm lasted only 4 hours, from 5 to 9 UTC, the variations for the rest of time were not significant, apart from those previously reported.
12/22 09:30 UTC – After several days of almost absolute calm, yesterday’s evening UTC time we had about 4 hours of significant activity, from 15 to 19 UTC. During this period the amplitude values remained for most of the time above Power 30 with the maximum at Power 37 at 18:30 UTC.
12/21 17:00 UTC – A slight activity began today in the last hours shown in the graph, the first change in amplitude occurred just before 5 UTC at Power 18 followed by minor variations. Shortly after 15 UTC the movements became more intense with first Power 31 and then the maximum of today’s chart at Power 35 just before 17 UTC.
12/20 17:00 UTC – Today it was still calm, the little variations seen in the graph reached Power 11.
12/19 17:00 UTC – Calm.
12/18 17:00 UTC – Technically we had an event that stands out as often happens lately on the 17th of the month, a peak at Power 17 on December 17th at 19 UTC (corresponding to today’s 2 am on the chart). For the rest, still calm.
12/17 17:00 UTC – Calm, many consecutive days of complete cam are not common.
12/16 17:00 UTC – Calm.
12/15 17:00 UTC – Another calm day, just a wriggle at 3 UTC that reached Power 15.
12/14 17:00 UTC – Calm.
12/13 17:00 UTC – Calm.
12/13 11:00 UTC – Significant activity even today and as in the last few days consisted mainly in isolated peaks. Those of today were 2, very strong, the first at 6 UTC reached Power 60, the second shortly after at 6:40 UTC reached Power 51.
12/12 17:00 UTC – Calm.
12/12 14:00 UTC – There we have it, the Coincidence 17 again today, the Amplitude has reached Power 74 between 16 and 17 on the chart. corresponding to 9-10 UTC. In this case we could start thinking about how many times it must happen before it becomes impossible…
12/12 07:30 UTC – It is clearly a time of pillars, even today we had 30 very intense minutes; from 6 to 6:30 UTC there was the first movement with the amplitude values that reached Power 63 shortly after 6 UTC.
12/11 17:00 UTC – Calm continued.
12/10 17:00 UTC – After the umpteenth “Coincidence 17” it has been calm.
12/10 11:30 UTC – Powerful activity once more, even if limited in time. It was calm until just after 3 UTC when a first isolated peak reached Power 54. From 5:30 to 6:30 it was the most intense part with the maximum value at Power 67. The last peak so far is was reached near 17 h on the chart, 10 UTC, and was at P50.
12/9 17:00 UTC – The short but intense period of activity was all for today.
12/9 11:30 UTC – It is no surprise that today this strong peak occurred and reached Power 74, it would have been a surprise if it had been a calm day. This strong series of movements lasted about 50 minutes, from 8:40 to 9:40 UTC, at 9:15 the maximum value.
12/8 17:00 UTC – Calm.
12/8 11:30 UTC – The situation today shows total calm until around 10 UTC when very slight variations in Amplitude started.
12/7 17:00 UTC – Much of today’s activity has been concentrated in the first part of the UTC day, from midnight until 6, where maximum values have been reached. Other slight sporadic variations at P15 also occurred at 10: 30 UTC.
12/7 09:00 UTC – After the record high of yesterday the variations continued sporadically at lower levels, the maximums were around Power 15. From midnight UTC a very active phase started again which kept the Amplitude above Power 50 for about 4 hours, from 1 to 5 UTC; during this period the maximum value achieved was Power 64.
12/6 17:00 UTC – After the incredible Amplitude spike at Power 158 other strong movements continued, the period of activity in which the Amplitude has been above 100 lasted about 1 hour, from 7:45 am to 8:45 UTC. At 10:30 UTC there was a further flicker at Power 28, after which a slight background activity continues.
12/6 10:30 UTC – The today’s graph began in a condition of general calm until 3 am UTC when the variations started. Immediately they reached Power 32 at 4 UTC; the movements continued with less magnitude until 7:45 UTC when some impressive movements started and reached Power 100 in around 15 minutes, at 8 UTC. This, despite the already impressive value, is still not the maximum for today, at 8:30 am the amplitude has further increased and reached an incredible Power 158, the most powerful peak of the last 2 years! In addition to the main and the amplitude graphs, the massive variation can also be seen in the other two charts, the Quality, which shows a value of 25, and that of the frequency of the SR, which shows a value of 8.80.
12/5 17:00 UTC – Calm.
12/4 17:00 UTC – Yesterday we saw a single peak, today the activity was very similar, 2 peaks, one at Power 23 at 21:30 UTC yesterday and another today at Power 19 this morning at 1:30 UTC. For the rest of the day it was calm.
12/3 17:00 UTC – Total calm, the only wriggle at 7 UTC reached Power 13.
12/2 17:00 UTC – Today the activity was not long lasting but very intense, in addition to the previous peak, which marked the beginning of the active period at 8:30 UTC, after a while, at 9 UTC, there was the maximum of today at Power 55, this was followed shortly after by a further movement on the 30s after which, from 10 UTC, the calm returned. Still, another movement around 17 hours of the graph.
12/2 09:30 UTC – Today’s chart shows once again a stato of calm, the last significant peak at Power 20 was Nov. 30 at 19 UTC so it took about 36 hours before the amplitude values returned above P10. Today, however, it’s back, the peak was at Power 37 8:30 UTC.
12/1 17:00 UTC – A single peak isolated at Power 25 in the first part of today’s chart and then calm.
Frequency means how many wave cycle happen in a second, 1 Hz. means 1 cycle per second, 40 Hz. means 40 cycles per second, Amplitude is the size of the vibration, how big is the wave, the chart shows the frequency variation in Hz and the amplitude using the white color.
Note
The Ancient Indian Rishis called 7.83 Hz the frequency of OM. It also happens to be Mother Earth’s natural heartbeat rhythmSchumann resonances are named after professor Schumann who was involved in early German secret space program and was later paper-clipped into the United States. The frequencies of Schumann resonances are fairly stable and are mainly defined by the physical size of the ionospheric cavity. The amplitude of Schumann resonances does change and is bigger when ionospheric plasma gets excited. Ionospheric plasma excitation happens because of solar activity, thunderstorms, use of scalar plasma weapons and HAARP and lately also when the Light forces are clearing the plasma anomaly.
Dependencies of Amplitudes Schumann Resonance January 5 2020
Dependencies of Quality Schumann Resonance January 5 2019
Dependencies of Frequency Schumann Resonance January 5 2019
All the SR daily images in one single pageSee the Images
Explanation of The Chart
The Schumann Resonance Spectrogram Chart
The Schumann Resonance Chart displays data from the magnetic field detector to monitor the resonances occurring in the plasma waves constantly circling the earth in the ionosphere. These three days spectrograms show the activity occurring at the various resonant frequencies from 1 to 40 Hz. Within the spectrogram, the power, or intensity level of each frequency is displayed as a color, with white being the most intense. The Schumann Resonances appear as the horizontal lines at 0.0, 4.0, 8.0, 12.0, 16.0, 20.0, 24.0, 28.0, 32.0, 36.0 & 40.0 Hz. This chart is based on Tomsk, Russia, time UTC +7 (UTC = Universal Time Coordinated).
What is a Spectrogram?
The Spectrogram Calendar is a visual representation of the range of frequencies in the magnetic field at a given location. Similar to how an equalizer displays the frequency content of music played on your stereo, the spectrogram calendar displays the frequency content of a magnetic field. Instead of showing a brief snapshot, it shows changes over a period of time, in this case 3 days.
The local magnetic field is a dynamic field that changes constantly because of variations in the ionosphere and sun and many other influences not yet fully understood. The range of variation displayed in the spectrogram chart is from 0 to 40 cycles per second. The vertical axis is frequency and the horizontal axis is time. The amplitude of a particular frequency at a specific time is represented by the intensity of color (green, yellow, white) of each point in the image.