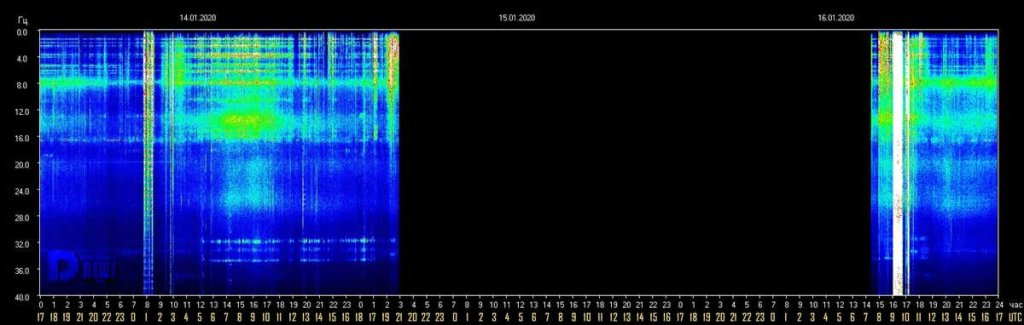
Editor’s Note: The Schumann Resonance graph was blank for over 35 hours before coming on-line and transmitting at 2:30am this morning. Almost immediate activity was shown with light activity beginning at 3:00am. from 4:00am through 5:00Am (EST, USA), a “whiteout” period of high-density, high amplitude energies were seen followed by a short 15 minute period for energies of the same structure.
Thanks for keeping your eyes tuned to these energies as the Earth begins her own vibratory and energetic ascent into a new dimension. Let ALL of humanity join her by BEing…
InJoy!
___________________________________________________________________________________________
“Schumann Update” 🤔
For over 35 straight hours the Schumann Resonance was void from showing any frequency coming in. THEN WHITEOUT BLAST! This is Mother Earth/GAIA changing time lines TO the New 5 D frequencies. A reset if you will. The reboot of the computer coming back on line. Now that the 5 D is taking a strong hold as it gets rid of the old 3 D Matrix she is physically changing as well. (Worldwide Earthquakes, Volcanoes, Sink holes, Floods, Fires Etc…) Like a snake shedding its old skin, like a caterpillar laying rest in a cocoon before it spreads its wings as a beautiful butterfly. This dormancy is a reset; a recalibration coming back online for the new Earth is giving birth. 💓 Be patient with yourself be patient with others because we are all going through a change and a transition as is GAIA/Mother Earth. We all will need to assist one another in this change that is taking place on Earth because this transition WILL NOT be easy for some as they don’t understand what and why this is taking place. COMPASSION, PATIENCE, UNDERSTANDING, GUIDANCE, LOVE….JUST KNOW “WE” ARE AT A DAWN OF A NEW AGE, NEW EARTH, HIGHER FREQUENCY WHERE WE ARE FINALLY COMING BACK ON LINE (DNA, Abilities will start to manifest slowly) WHERE “WE” HAVE BEEN DORMANT FOR WAY TOO LONG. “OUT WITH THE OLD IN WITH THE “NEW”! ☝💕💞💖 NOTHING BUT LOVE TO YOU ALL, ALWAYS ❣
Aluna Ash
Schumann Resonance Today – 68 hz
___________________________________________________________________________________________
68
Schumann Resonance Today. We will try to keep you updated about the variations of the Resonance with this page. The great variations that nobody can explain but that give us a clear sign that the planet is changing. The Earth is vibration higher and higher, just like us!
The Chart time is based on Tomsk – Russia – UTC (Universal Time Coordinated) +7 Source
RS Base Frequency 7.83 Hz.
Schumann Resonance Today Peaks:

- 1/16 17:00 UTC – To summarize, the blackout started on January 14th at 8 pm and ended on the 16th at 7:30 am, 35 hours and 30 minutes. As the data returned we had the significant peak at 67 followed by a minor move to Power 25, today’s movements occurred from 9 to 10:15 UTC.
- 1/16 10:00 UTC – It seems that the blackout is over, and we find that there is a strong activity ongoing. At 9 UTC, about 2 hours after the data came back live, immediately a ‘pillar’ that reaches Power 68.
- 1/16 08:00 UTC – Still no data, we are entering the second consecutive day of total black, coincidence?
- 1/15 17:00 UTC – No changes, we are now beyond 21 hours of ‘darkness’.
- 1/15 12:00 UTC – Pitch black.
- 1/15 07:00 UTC – We are still in blackout mode, it is now about 12 hours from the last update. The last massive outage was exactly on almost same days in October 2019, started on October 13 to end on the 18th.

- 1/15 00:00 UTC – The chart stopped updating at 19:30 when a slight activity apparently started again, it is not uncommon to have some ‘blank’ hours every now and than.
- 1/13 17:00 UTC – The first part of today’s chart shows complete calm, from just after midnight UTC some slight movements started which slightly exceeded Power 10. A ‘background buzz’ then continued for the rest of the day.
- 1/13 17:00 UTC – Calm.
- 1/13 09:00 UTC – Today began with a slight ‘background’ activity around Power 10, these slight variations continued until 8 am. During this period, an isolated peak at Power 33 occurred at 4:15 UTC.
- 1/12 17:00 UTC – Only movement today at 5 am UTC has reached Power 25.
- 1/11 23:00 UTC – The Power 40 lasted almost 1 hour across 17 UTC, most of the time above Power 30
- 1/11 17:00 UTC – 31 hours of total calm until shortly after 16 UTC when a new activity started, and which is currently underway; so far the maximum amplitude has reached Power 40.
- 1/11 11:00 UTC – Total Calm.
- 1/10 17:00 UTC – After the first three previous ‘pillars’ there was also the fourth, between 8 and 9 UTC and reached Power 47. Today’s activity took place in the period from 2 am to 9 am UTC. In the amplitude graph, over the last 3 days, can be noted a gradual increase in the amplitude values and duration.
- 1/10 08:30 UTC – Yesterday we had a short series of isolated ‘pillars’, today the same thing but of greater magnitude, both in the maximum amplitude value and in the duration of the peaks. The first ‘introductory’ movement took place at 1 UTC at Power 20; the second peak was at Power 46 from 4 to 5 UTC; the last peak so far has been at Power 65 and lasted about 30 minutes from 5:30 UTC.
- 1/9 17:00 UTC – Calm.
- 1/9 10:30 UTC – Today’s chart is characterized by two major ‘pillars’ accompanied by others of smaller size, all isolated. The most significant: from 5:30 to 6 UTC at Power 50; from 6:30 to 7 UTC at Power 58; from 9:15 to 9:30 UTC at Power 25.
- 1/8 17:00 UTC – Calm.
- 1/8 08:30 UTC – For this first part of today’s chart nothing significant except a Pillar that lasted about 40 minutes and reached Power 18 at 4:15 UTC. The below news report of ‘something’ on the 6th, we had 18 hours of flat calm while… January 6th, something unexpected happened in the soil of northern Norway. “Electrical currents started flowing… It seemed to be some kind of shockwave… My instruments detected a sudden, strong variation in both ground currents and our local magnetic field” reported Rob Stammes, who monitors ground currents at the Polar Light Center geophysical observatory in Lofoten archipelago in NW Norway. NASA’s ACE spacecraft detected something as well. Approximately 15 minutes before the disturbance in Norway, the interplanetary magnetic field (IMF) near Earth abruptly swung around 180 degrees, and the solar wind density jumped more than 5-fold. The sudden surge at around 19:30 UTC. electroverse.net
- 1/7 17:00 UTC – Today’s chart shows a period of around 18 hours of flat calm, very few swings, it started at 8 am UTC yesterday and ended at 2 am UTC this morning. After this ‘silence’ some light background movements started, Power 15 was today’s maximum at 7 UTC.
- 1/6 17:00 UTC – Total Calm.
- 1/5 17:00 UTC – Calm.
- 1/5 8:00 UTC – Today, together with the second part of yesterday, was characterized by fairly powerful but isolated peaks; two have occurred, the first at Power 21 took place at 00 UTC, the second, much more powerful, reached Power 48 at 4:45 UTC.
- 1/4 17:00 UTC – Today the activity has almost been continuous, in the first part of the day shown on the graph the amplitude peaked around 15 while in the second half the variations were more sporadic but reached the peak of Power 43 at 13:40 UTC. The situation is now calm.
- 1/4 8:00 UTC – After the not so uncommon data blackout, but peculiar for it’s duration, the restored flow shows a light activity that topped several times between Power 13 and 15, maximum for now was at 6 UTC.
- 1/3 17:00 UTC – Calm until the end of the chart when some variations seems about to start.
- 1/3 10:00 UTC – We are back to normal operations after the data blackout which lasted approximately 17 hours. The first available data show a calm situation.
- 1/2 18:00 UTC – The publication of the new data stopped at 16 local time in Tomsk, corresponding to 9 UTC. So far the darkening has lasted 9 hours.
- 1/2 15:30 UTC – The activity continued in a very moderate way throughout the day, the maximum at about power 14 has been temporarily reached at 1 and 6 UTC.
- 1/1 17:00 UTC – The second part of today’s graph shows a marked increase in activity even if the peaks have remained relatively low. The movements started at 12 UTC and lasted until 17, the highest peak was at Power 25.
- 1/1 11:00 UTC – Today, like yesterday, it seems a calm day, the maximum values once again reached Power 10 momentarily around 6 am UTC.
- 12/31 17:00 UTC – Calm.
- 12/31 11:30 UTC – Calm.
- 12/30 17:00 UTC – Calm.
- 12/30 10:00 UTC – After yesterday’s very strong activity, the situation remained calm for about 9 hours until about 21 UTC (yesterday), when new moderate movements began which lasted almost 4 hours until 1:30 UTC. During this period the maximum amplitude value reached has been Power 30.
- 12/29 17:00 UTC – Today’s activity lasted 13 hours, from 23 (yesterday) to 12 UTC (today), the average was about Power 70 and only once, briefly for about 15 minutes around 8 UTC, the amplitude went below Power 40. Graphically it looks like a column of light.
- 12/29 13:30 UTC – In the second part of the day shown in the graph it is highlighted how the intensity of the variations has remained substantially unchanged and has generated the strongest peak of the day at Power 93. It seems that, suddenly as they started, the movements have rapidly dropped to normal values at 12 UTC.
- 12/29 09:00 UTC – The situation changed suddenly at 23 UTC when a series of movements began and led the amplitude values to reach Power 72 at 7 UTC, from that moment onward the amplitude remained on values between Power 65 and Power 80 with the peak maximum at Power 82 at 1:30 and 2 UTC.
- 12/28 17:00 UTC – Calm.
- 12/27 17:00 UTC – Calm.
- 12/27 13:30 UTC – What appears to be all of today’s activity took place in four hours, from 4 to 8 UTC. During this period there were 4 peaks, each stronger than the previous one, and the last one at 7:30 UTC at Power 38 was the strongest.
- 12/26 17:00 UTC – Calm.
- 12/25 17:00 UTC – The activity seems to be in slight and constant decline, today two slight peaks, the first at Power 18 at 3 UTC, the second at Power 12 at 12: 30 UTC.
- 12/24 17:00 UTC – Today’s activity lasted for about eight hours, from 2 to 10 UTC, the highest values occurred between 6 and 7: 30 UTC and reached Power 27.
- 12/23 17:00 UTC – Power 34 isolated at 10:30 UTC was all the activity for today.
- 12/22 17:00 UTC – Today we could say that total calm lasted only 4 hours, from 5 to 9 UTC, the variations for the rest of time were not significant, apart from those previously reported.
- 12/22 09:30 UTC – After several days of almost absolute calm, yesterday’s evening UTC time we had about 4 hours of significant activity, from 15 to 19 UTC. During this period the amplitude values remained for most of the time above Power 30 with the maximum at Power 37 at 18:30 UTC.
- 12/21 17:00 UTC – A slight activity began today in the last hours shown in the graph, the first change in amplitude occurred just before 5 UTC at Power 18 followed by minor variations. Shortly after 15 UTC the movements became more intense with first Power 31 and then the maximum of today’s chart at Power 35 just before 17 UTC.
- 12/20 17:00 UTC – Today it was still calm, the little variations seen in the graph reached Power 11.
- 12/19 17:00 UTC – Calm.
- 12/18 17:00 UTC – Technically we had an event that stands out as often happens lately on the 17th of the month, a peak at Power 17 on December 17th at 19 UTC (corresponding to today’s 2 am on the chart). For the rest, still calm.
- 12/17 17:00 UTC – Calm, many consecutive days of complete cam are not common.
- 12/16 17:00 UTC – Calm.
- 12/15 17:00 UTC – Another calm day, just a wriggle at 3 UTC that reached Power 15.
- 12/14 17:00 UTC – Calm.
- 12/13 17:00 UTC – Calm.
- 12/13 11:00 UTC – Significant activity even today and as in the last few days consisted mainly in isolated peaks. Those of today were 2, very strong, the first at 6 UTC reached Power 60, the second shortly after at 6:40 UTC reached Power 51.
- 12/12 17:00 UTC – Calm.
- 12/12 14:00 UTC – There we have it, the Coincidence 17 again today, the Amplitude has reached Power 74 between 16 and 17 on the chart. corresponding to 9-10 UTC. In this case we could start thinking about how many times it must happen before it becomes impossible…
- 12/12 07:30 UTC – It is clearly a time of pillars, even today we had 30 very intense minutes; from 6 to 6:30 UTC there was the first movement with the amplitude values that reached Power 63 shortly after 6 UTC.
- 12/11 17:00 UTC – Calm continued.
- 12/10 17:00 UTC – After the umpteenth “Coincidence 17” it has been calm.
- 12/10 11:30 UTC – Powerful activity once more, even if limited in time. It was calm until just after 3 UTC when a first isolated peak reached Power 54. From 5:30 to 6:30 it was the most intense part with the maximum value at Power 67. The last peak so far is was reached near 17 h on the chart, 10 UTC, and was at P50.
- 12/9 17:00 UTC – The short but intense period of activity was all for today.
- 12/9 11:30 UTC – It is no surprise that today this strong peak occurred and reached Power 74, it would have been a surprise if it had been a calm day. This strong series of movements lasted about 50 minutes, from 8:40 to 9:40 UTC, at 9:15 the maximum value.
- 12/8 17:00 UTC – Calm.
- 12/8 11:30 UTC – The situation today shows total calm until around 10 UTC when very slight variations in Amplitude started.
- 12/7 17:00 UTC – Much of today’s activity has been concentrated in the first part of the UTC day, from midnight until 6, where maximum values have been reached. Other slight sporadic variations at P15 also occurred at 10: 30 UTC.
- 12/7 09:00 UTC – After the record high of yesterday the variations continued sporadically at lower levels, the maximums were around Power 15. From midnight UTC a very active phase started again which kept the Amplitude above Power 50 for about 4 hours, from 1 to 5 UTC; during this period the maximum value achieved was Power 64.
- 12/6 17:00 UTC – After the incredible Amplitude spike at Power 158 other strong movements continued, the period of activity in which the Amplitude has been above 100 lasted about 1 hour, from 7:45 am to 8:45 UTC. At 10:30 UTC there was a further flicker at Power 28, after which a slight background activity continues.
- 12/6 10:30 UTC – The today’s graph began in a condition of general calm until 3 am UTC when the variations started. Immediately they reached Power 32 at 4 UTC; the movements continued with less magnitude until 7:45 UTC when some impressive movements started and reached Power 100 in around 15 minutes, at 8 UTC. This, despite the already impressive value, is still not the maximum for today, at 8:30 am the amplitude has further increased and reached an incredible Power 158, the most powerful peak of the last 2 years! In addition to the main and the amplitude graphs, the massive variation can also be seen in the other two charts, the Quality, which shows a value of 25, and that of the frequency of the SR, which shows a value of 8.80.
- 12/5 17:00 UTC – Calm.
- 12/4 17:00 UTC – Yesterday we saw a single peak, today the activity was very similar, 2 peaks, one at Power 23 at 21:30 UTC yesterday and another today at Power 19 this morning at 1:30 UTC. For the rest of the day it was calm.
- 12/3 17:00 UTC – Total calm, the only wriggle at 7 UTC reached Power 13.
- 12/2 17:00 UTC – Today the activity was not long lasting but very intense, in addition to the previous peak, which marked the beginning of the active period at 8:30 UTC, after a while, at 9 UTC, there was the maximum of today at Power 55, this was followed shortly after by a further movement on the 30s after which, from 10 UTC, the calm returned. Still, another movement around 17 hours of the graph.
- 12/2 09:30 UTC – Today’s chart shows once again a stato of calm, the last significant peak at Power 20 was Nov. 30 at 19 UTC so it took about 36 hours before the amplitude values returned above P10. Today, however, it’s back, the peak was at Power 37 8:30 UTC.
- 12/1 17:00 UTC – A single peak isolated at Power 25 in the first part of today’s chart and then calm.
Frequency means how many wave cycle happen in a second, 1 Hz. means 1 cycle per second, 40 Hz. means 40 cycles per second, Amplitude is the size of the vibration, how big is the wave, the chart shows the frequency variation in Hz and the amplitude using the white color.
Note
The Ancient Indian Rishis called 7.83 Hz the frequency of OM. It also happens to be Mother Earth’s natural heartbeat rhythm Schumann resonances are named after professor Schumann who was involved in early German secret space program and was later paper-clipped into the United States. The frequencies of Schumann resonances are fairly stable and are mainly defined by the physical size of the ionospheric cavity. The amplitude of Schumann resonances does change and is bigger when ionospheric plasma gets excited. Ionospheric plasma excitation happens because of solar activity, thunderstorms, use of scalar plasma weapons and HAARP and lately also when the Light forces are clearing the plasma anomaly.

Dependencies of Amplitudes Schumann Resonance January 16 2020

Dependencies of Quality Schumann Resonance January 16 2019

Dependencies of Frequency Schumann Resonance January 16 2019
Schumann Resonance Differential Peaks
Schumann Resonance PDF Archives
Images Archive
All the SR daily images in one single pageSee the Images

Explanation of The Chart
The Schumann Resonance Spectrogram Chart
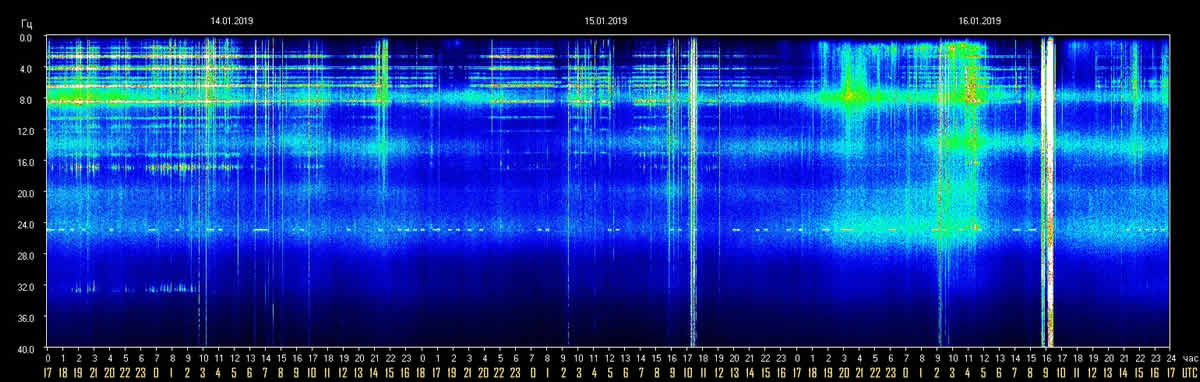
The Schumann Resonance Chart displays data from the magnetic field detector to monitor the resonances occurring in the plasma waves constantly circling the earth in the ionosphere. These three days spectrograms show the activity occurring at the various resonant frequencies from 1 to 40 Hz. Within the spectrogram, the power, or intensity level of each frequency is displayed as a color, with white being the most intense. The Schumann Resonances appear as the horizontal lines at 0.0, 4.0, 8.0, 12.0, 16.0, 20.0, 24.0, 28.0, 32.0, 36.0 & 40.0 Hz. This chart is based on Tomsk, Russia, time UTC +7 (UTC = Universal Time Coordinated).
What is a Spectrogram?
The Spectrogram Calendar is a visual representation of the range of frequencies in the magnetic field at a given location. Similar to how an equalizer displays the frequency content of music played on your stereo, the spectrogram calendar displays the frequency content of a magnetic field. Instead of showing a brief snapshot, it shows changes over a period of time, in this case 3 days.
The local magnetic field is a dynamic field that changes constantly because of variations in the ionosphere and sun and many other influences not yet fully understood. The range of variation displayed in the spectrogram chart is from 0 to 40 cycles per second. The vertical axis is frequency and the horizontal axis is time. The amplitude of a particular frequency at a specific time is represented by the intensity of color (green, yellow, white) of each point in the image.

What is the Schumann Resonance?
The Herathbeat of Planet EarthRead
🙂

Dreams
Dreams are today’s answers to tomorrow’s questions.
Edgar Cayce


I wish the bar graph would show more of the amplitude so we could get a picture of how high in frequency some of these spikes are….
If you’re interested in the resonance increase check out the Yugas. We go through ages of destruction followed by ages of creation. Dark ages followed by revivals. These are waves of cosmic energy and this wave was marked by the Mayan calendar in 2012. It is also spoken of by Jesus as the end of an age, or summer being near, like Narnia. We are currently in winter or Kali Yuga to the Hindu. The stories we have told about Osirs / Seth / Horus, Zeus / Hades / Hercules, Mufasa / Scar / Simba, Yin / Yang have always been stories of this great cycle. This cycle is also known in Greek philosophy as a Great or Platonic Year. Just look at it like cosmic seasons . . .
“All biological systems operate in the same frequency range. The human brain’s alpha waves function in this range and the electrical resonance of the Earth is between 6 and 8 hertz. Thus, our entire biological system—the brain and the Earth itself—work on the same frequencies. If we can control that resonate system electronically, we can directly control the entire mental system of humanity.”—Nikola Tesla
Ever notice the entities dwelling within the frequencies?
Namaste!
In terms of “grounding”, many people are suggesting that we walk upon the earth barefoot as much as possible in order to be acclimated to (” grounded with”) Mama Gaia. However, if indeed the Schumann Resonance is erratic or up and down in frequency on an almost regular basis now, would not being barefoot (weather permitting) cause a sense of “ungroundedness”? This could take the form of dizziness, anxiety, upset stomach, etc. It seems that “grounding” would better occur via the use of particular gemstones which have been scientifically proven to have such an effect such as Black Tourmaline or Smoky Quartz. There are several others. Also, connecting with our Higher Selves helps by meditation. In brief, merely walking on the earth barefoot would seem to have the effect of causing “ungroundedness” rather than “groundednes”. Does anyone else have feelings or thoughts about this? Thanks, and have a peaceful, healthy, prosperous day!
I live by the beach, and never wear footwear unless i am going to a mall or something, which is very rare… Even barefoot while walking around in Urban areas.
1. If you are barefoot, and NOT outside on the ground, it dosen’t count.
2. I am outside, barefoot, all the time, every day, almost all day.
You would feel “NORMAL” and that which you refer to as “groundedness” becomes as much a part of you as your heartbeat… and becomes unnoticeable in the midst of all the other things you feel and do every day.
Whether you might decide that you are “grounded”, due to that alone, is very questionable.
I do, however appreciate putting my feet back on the ground after they have been in shoes, or boots, and I do “feel” better when my feet are on the ground.
A person who is in shoes or on an artificial surface for a part of the day would feel that pleasure more succinctly.
It probably also has to do with the pressure points in the foot, that get to flex and groove on variable terrain, as Developed Nation inhabitants have been used to doing for all but the last 200 years…now to notice the differences…
Namaste!
People around the world seem to be becoming increasingly aware of how the “Schumann Resonance” is a part of a three-pronged phenomenon called an “Energy Wave” which is: 1.) Cosmic energetics such as solar winds affecting Earth’s magnetic field,etc. 2.) Human collective levels of consciousness, and 3.) “Schumann Resonance” vibrational frequencies. Thus, as time advances, we will experience continual “Energy Waves” as all three of these phenomena intertwine in what may seem to be a mystical manner but what is actually scientific observable fact. For example, when there is accelerated hatred on Earth along with warfare, oppression, famine,serious economic issues, disease, political chaos, etc., cosmic disturbances such as coronal mass ejections from the Sun and geomagnetic storms on Earth plus an erratic “Schumann Resonance” seems to occur. Therefore, as can be gleaned, human consciousness, cosmic happenings, and Earth’s vibrations have all created an “Energy Wave” as stated. The human mind is, therefore–just like the Earth–a receiver and transmitter of energy. Consequently, as I suggested in an earlier posting, it is a good idea to envision our planet in peaceful, loving LIGHT. However, I now add an extra suggestion: Let us envision this LIGHT soaring from the Great Central Sun, the Photon Belt,that the Earth and the entire Milky Way Galaxy has entered into within the first of twelve vortices that will supposedly take a total of 2000 years to cross. Yet, we can call forth and enjoy peace and love long before then. Let us at least try.
LIGHT and LOVE to All!
Any comments on what the proposed 5g communication transmission might do?
How to protect against that? I also thought it was interesting to note the mention of our earth’s heartbeat/resonance as being very similar to our normal healthy ph level.
You can use Orgonite/chembusters to protect yourself against 5G, WIFI. Just Google it.
I don’t plan on needing to PROTECT myself or all life on this planet.
The very fact you know it’s presence and choose to accept that,is consent to a crime against all life on this planet(prosecutable under Geneva Treaties, Nuremberg Doctrine Inter-Nation Law) by the extreme noise and damage it will do to DNA of all life.
What is changing our Resonance is the incoming Binary Star System, the Neutron Star.
She has 7 Planets and 10 Moons in tow.
Travels on Red Magellan Clouds that permeate her gaseous Neutron Emissions that vent out of her sides and resemble WINGS, making them RED.
Because of her enormous Mass, she has an extremely long tail.
You sang about it at Christmas~
Do you see what I see?
A Star high up in the night-
with a TAIL as big as a Kite.
Stars don’t have tails.
Except a Neutron Star.
It too, will become permeated with the Red from the Magellan Clouds.
RED WINGS.
RED TAIL.
DRAGON.
Typhon, Son of Tartarus Returns.
Peace~
LoveGod.LoveEachOther
My ENTIRE Life, I’ve heard that I am from the Divine Realm, and that I have SO MANY souls, Angels, Arch Angels, surrounding me, I look like I have my own Galaxy around me! It has been Validated SO MANY times! I have a 5-6 abilities, and they’ve taken a MASSIVE JUMP, since July, and 4 weeks ago, I saw “Death” for the 1st time! That one can go! LOL! Those, who are getting information before a Spike, you have a Special Role to play here and NOW! Consider yourself Blessed! That’s how I feel. This has EXPLAINED so much, and working back for the time difference, it shocks me to NO END, how DEAD on this has all been! Thank You Very Much!
amazing vibes
Hi All!
New to this site, super happy to read everyone’s comments and see all of the self-science being done and personal insights. I’m located in Quebec, Canada. I saw a couple of comments regarding no data coming from Canada… do we know why? Is the only monitoring station in Alberta?
I’ve been feeling the shift in my body and mind for quite some time now, especially since March when we experienced some massive spikes. Some say there was a “rainbow wave” or galactic pulse that hit Earth to activate the first wave of starseeds (or second if you count the pioneers as first wave). My experience was absolutely nuts! I had no previous knowledge of starseeds or any of this shift business, I just knew I was on a spirit quest and looking to do good things for humanity. I was in Nicaragua at the time and for a whole week I could not leave my hotel room, as my body became scorching hot, all of my joints and muscles ached, and I could barely move. I couldn’t eat anything other than fruit but I drank gallons of water each day. Despite these crazy physical symptoms my mind was clear and I felt called to do research into what was happening. At first I thought it was the moon or the astrological aspects. Soon though, I found this youtube channel by Aluna Ash, who claimed to be a 9D clairvoyant, and she described to a T what I was experiencing. Through her and other sources I learned about the shift and put the pieces of my own life and destiny together. I also started receiving downloads at night that brought massive realizations, all while I would “evaporate” density (it literally felt like that).
Interestingly I had also been following the Mayan calendar off and on for a little over two years by this time and my experience pushed me into deeper exploration with it. I started following the more modern adaptation, the Dreamspell, and reading the first volume of the Cosmic History Chronicles. In this, the author speaks of the NOOSPHERE, or the psychic/cognitive field of the Earth, that contains all of the projected thoughtforms of humanity. This is our collective consciousness that merges with the psychic aspect of Gaia herself. As we evolve into a 4D collective with a 5D consciousness, we will be synchronizing with each other telepathically through the Noosphere. The Noosphere has always existed, we just don’t consciously sync up with it at this time because of the control agenda of certain lower frequencies of fear keeping our minds in a state of separation. Anyway, the point of this is that some are wondering what the SR is, and I had a thought that maybe it is also recording the psychic shifts in the Noosphere. 🙂
If anyone would like to connect feel free to find me on Facebook or Instagram.
https://www.facebook.com/profile.php?id=100014369027465
https://www.instagram.com/meta.mel/
Good evening,
Thanks for all the information I read in the messages below. Can you explain for there are white bands up and down on the RS’s measurements?
Do not you believe in a counter measure of the RS activity related to the chemical spreading program on the world?
Why nobody stops this thing, because in the end we will be you and me not healthy.
Thank you for your opinion.
Thank you Gabriel, your blog is amazing, I am also from the Ashtar Command. I already made a great part of my mission and I’m a gatekeeper in Pisac -Cusco, Peru, powerful vortexes and have a pleiadian team of 3 that protects me to be safe during my missions regarding ascension of Gaia and humanity that is ready, very few still as yet. Multiple reptilian hybrids trying to stop my mission but I’m very well protected and covered in Jesus Christ golden solar powerful light AUM! Nevermind, this is to tell everyone that I noticed just as of today October 25th 2018 there’s music incoming in the air of Gaia and when I woke up today I heard sort of a melodic symphony of the first musical tones of “LA VIE EN ROSE”! I am clairaudient since many years now… Has anyone heard this yet? Divine Light and Love have won!
Yes! Congrat’s to you! You are like me, and receiving information, ahead of the Curve, for your Work must be EXTREMELY important, as mine is! I have Several Abilities, and 4 weeks ago, they ALL took a Massive Jump, and NOW I can see Death, which is something that I’ve never seen before! My work, is to help those going through Ascension, and to help them out of the 3-D, into the 4 & 5-D that soon will be upon us! I can spot “Dark”, or “Negative” Souls in People, and I stay away! I know that it isn’t good to be around them! I have had the HIGHEST Pitch in my Ears for 6 Months, at 185 Hz, and now it’s so Peaceful! Be SAFE as you continue your Work! Meditate, and Pray Daily, to keep yourself Grounded! Much Love & Light for you!
Namaste!
It seems as if the “Schumann Resonance” level can be somewhat detected by human physiology and emotion. In other words, when there is a spike in anxiety or in bodily aches and pains, this could also be “Mama Gaia’s” spike in anxiety and physical discomfort. “She” is endeavoring to cleanse and heal from all of the tampering that mankind has done to “Her” with toxicity of water,soil, and air. As “She” heals, we can heal too if we consciously envision LIGHT enveloping and surrounding “Her”. Meditation is powerful!
I reside in a 55 and older community. Many of whom are in the higher senior years. I have started to connect the overall temperament of the residents to the Schumann Resonance graff. Those that show great depression and anxiety I have shared my findings with. By there knowing how to monitor Gaia, and with the understanding of how this affects them, they can now predict it. Thus turning the anticipation of the next attack, which brings the depression faster, faces it with confidence that they can control it. This has lifted the vibration of the whole community. Knowledge is Power. I think I gave them the power to control the outcome. Just FYI
Oh thank you!! Yes I can feel her pain. I will start wrapping her in healing light. ♥️♥️♥️
yes i agree, i feel the shift once it returns to the norm… 7.83 and it is very difficult, painful in my high heart and wanting to go home…
it becomes more difficult to remain here to hold the vibration.
I read graphs all the time, however I’m unsure how to interpret this one? What do the x & y axis represent? What is the color representative of? Why are the graphs shown as lines that change colors? What do the color changes mean?
Axis are Freq. and time (UTC+7), lines = frequency, color = amplitude
Sorry, DNI, et al. I just re-read the Note, and it answered my question, more-or-less.
“Ionospheric plasma excitation happens because of solar activity….also when the Light forces are clearing the plasma anomaly.”
Yowza! Anyone have any thoughts on how the solstice ‘window’ might relate to this sustained Gaia spike? (21Jun18, 29hrs). Concurrently with all this, I received a Rescue check($) by post–quite out of the blue! [I’m fairly sure the inspiration for this didn’t originate with Commander Ashtar.] My mothers “dis-incarnation” is imminent, and she decided to thwart Arizona (USA) Probate shenanigans (many MiDs on the ground in that region)–by doing some early Gifting. Haleluja!
Thank you so much for these updates!!
Hope this isn’t a ridiculous question. Is anyone aware of the correspondence between (daily) seismic activity and the (daily) Schumann Resonance? If the answer should be self-evident from the various graphs, I’m afraid I can’t visually accomplish that any longer.
On 12 June, Dutchsinse was ranting about dubious data, and directly accused the USGS of deliberately keeping three (same day ) 4.0+ earthquakes at Mauna Loa, HI, undisclosed (to the public). On top of that, almost the entire globe was ‘silent’ on reporting any activity, which is really weird. Dutch said that if it’s ‘true’ reporting, serious pressure could be building along the fault lines, especially along the Pacific Ring of Fire.
It’s a legitimate question in my opinion but seems that there is no regular patterns between EQ and SR, sometimes they match but several others they don’t, I checked this in Italy on the vlf site where there are some charts referred to both but it doesn’t seem to be strictly related… USGS is surely hiding EQs! About the world situation someone says that there are groups of people that help the Galactics to keep under controls many volcanoes, one of them is the super volcano Marsili in southern Italy sea, quite surely there will be other groups around the world doing the same… of course if you believe there are ETs and they are acting on the Earth…
Thanks. Yes, I do believe it. Most assuredly…Gaia knows it. All the off-stage activity by elementals, or ETs, or Terran allies, is much appreciated. Too bad the general population hasn’t awakened (yet) to how much help we have…fear-mongering would fizzle out quick-time, and there’d be no point in deception at all. So far, the “bumbling sappers” are failing spectacularly!
I’ll check out Marsili supervolcano…Yellowstone, USA, is our resident sv, bulge growing. Since its fallout swept from W. Montana to the Carolinas at the Atlantic, it’s been a great fear-inducer in local geology. Never mind that Yellowstone blew 60 million years ago. We have long memories, it seems. 😉
Funny. You don’t understand that we’re all ET’s? People believe who don’t know.
Yes, Shanti, it is funny and it often takes people a while to realise the universe is filled with DNA..just like ours..the universal pattern for human beings..
RE: Schumann Resonance Today 6/10/2018
─ per the “isolated spike that topped 40 Hz”
This was caused by too much False stimulus (connected to survival and fear in the illusion) which showed up because of the unusual suicides happening (etc.) that is being pushed by TV into the minds of people. The Planet is fine and does not care about survival because that concept is meaningless and no such thing exists for it. Only the Delusional-Illusion cares about survival.
How can we trust the Russian chart when the Italian chart shows massive activity compared to none at all?
Well it does not mean the TSU chart is fake, as this is a frequency with the amplitude oscillation it’s not happening everywhere at same time, ideally we have to check several measuring stations, sometime we do it just for comparison… Italy is under massive intervention as for the dark forces housing here that might be why…
why is there an 8 hour chunk missing ? archive 25/11/18
a comet hit the sun that day
frankly a smell a rat
stanislov
Seems ok now, thanks.
There’re several measurement stations that measure Schumann Resonance (S.R) in a very specific area. The intensity of the various frequencies of this S.R varies from one place to another of the Earth, just as the vibratory frequency can vary from one place to another. Currently, it seems that Canada has one of the highest vibratory frequencies, but there are also specific sites that have very high frequency rates, thanks to vortexes or crossings of electromagnetic grid lines. of the earth.
We are in Canada and for some reason we can not see any graphic for the Shumann resonance in Canada. Everything is blocked for us as for Canada. I would love to see the graphics.
Because the energy is happening just north-east in the sea where it appears a crack in the earth is at on google earth. Js
MY BELOVED , NOW LEAVE YOUR THOUGHTS AND “FEEL” YOUR INNER VOICE. HAVE NO FEAR, YOU WILL ABSOLUTELY NOTHING HARMFUL IN THERE, BUT LOVE, IT’S US. ONLY HERE IS GUIDANCE TO FIND.CREATOR WANTS US AT HIS SIDE, AS A TRUE FRIEND.(ALIVE!) IN FACT THIS PLAN IS UNBELIEVABLE PERFECT.IT HAS MANIFESTED,IRREVERSIBLE. LOVE TO YOU , MY HEART.
#KNOWLEDGE At the risk of being accused of quackademics, may I suggest you look at all 6 reporting stations…they will be different but all correct. As the planet under your feet is rising from Earths crust the resources on each continent resonate differently. I speak for the Immortals. Thank you.
I know, they are all correct, but it is too much work to do on a daily basis to check the 6, make the description of each, eventually save some images and so no… we decided to show this one as this is what our resources allowed us to do…
Can you help me figure out which of the different station locations I would use for the Dominican Republic?
Hannah, I am not aware of stations in the Caribbean…
Unfortunately, it seems we can’t be sure in TSU data. They were absent for 2 days of magnetic storm (28-29 of april). Wrote about it here (translated to english from russian): https://goo.gl/cQmzqj
While it is precisely during this kind of event that the measurement of this resonance is important (in terms of the intensity of each frequency and not the change of frequency)…
Nice explanation! Much appreciated Nikolas…thank you for sharing!!
I knew it…alberta canada ottawa quebec no readings cant wait to see them
I noticed a vast difference between the alternate chart you posted for Saturday (4/28) and the TSU chart that they finally updated. TSU chart looked like default SR wallpaper. No real readings during blackout? Have you seen an explanation as to why the blackout? I haven’t. Thanks for all you do!
Hello,
Thank you for what you do, I really appreciate your involvement in this transition phase and all the energy you bring in your articles very interesting and often bright!
However, I just wanted to clarify the confusion that may surround this Schumann Resonance (S.R). There are many factors that prove that humanity is changing and that consciousness awakens, but Schumann’s Resonance isn’t one of them. Since scientists measured this S.R in 1950, all major frequencies have remained unchanged. Thus, there are 7 frequency peaks (7.83 Hz, 14 Hz, 21 Hz, 26 Hz, 33 Hz, 39 Hz and 45 Hz). We only retain 7.83 Hz because it’s the one with the highest amplitude and therefore, the one that acts the most on living beings :
http://spirit-science.fr/doc_terre/Schumann-imag/SPGRM_2017_03_03GCI2.jpg
The measurements that you show only concern the amplitude of these 7 peaks of frequencies (yellow = high intensity). The intensity of each frequency is always higher during the day because of the differences in temperature and the electricity circulating in the atmosphere. This intensity also varies according to storms, solar flares, the use of HAARP (directed energy weapons, scalar waves, etc.) or sometimes when powerful energies are in action on Earth.
That said, it can be interesting to monitor the S.R, because often during some events there will be an increase in intensity. That said, it is necessary to take into account the place where this RS has been measured, because there are 6 measuring stations in the world :
https://www.heartmath.org/research/global-coherence/gcms-live-data/
1 : California (USA)
2 : Hofuf (Saudi Arabia)
3 : Lithuania
4 : Alberta (Canada)
5 : Northland (New Zealand)
6 : Hluhluwe( South Africa)
Nikolas
Thank you Nikolas, what you say is the scientific explanation but as they know nothing about the SR, they can write books circling on the Schumann Resonance without going anywhere, those who explained the RS are the same that deny the existence of life in the universe or the same that try to explain how the Egyptians built the Pyramids… and that says it all. We know nothing as well on the RS, same as the quackademics, but at least we’re not trying to give explanations…
Is it possible for you to provide the actual web address for the new Schumann Resonance chart you have today, when I follow the source link it leads to the old chart image only:-( and I cant seem to find it doing a search.
Sure! http://www.vlf.it/cumiana/last-geomar.jpg
I am very interested to follow the activity of the SR, but would like to learn how to read the chart. Can someone point me to an article of some sort? Thank you
#KNOWLEDGE Earth is a crust over the planet inside. Heaven is the interior planet beneaths Earths crust. The Heavens are the rest of the Hereafter. Heaven is rising from under your feet as The Heavens come in from above. The spikes in the resonance are handled from inside.
Do you believe a polar-shift along with a consciousness-shift are imminent? If so, when would you suggest this might happen?
Hi Ethan, I do not like to “believe” in general but, apart from that term, there would be a Polar Shift quite surely, sooner or later. There have been already in the Planet history but I do not feel it as something that will make a big difference in the human consciousness. I think, and I might well be wrong, that the planet and consciousness shift are separate things. The latter is already happening in my opinion, it won’t happen overnight, it will take some time. For the Polar shift I can guess we’ll need to wait the Galactic Superwave that some are guessing would be any time from now to 2025…
Your Galictik Superwave (Photonenring) will bring big changes to our Earth!our 3 dim.Lifestile will mayby transfer to an 5th dim.Thinking. There will be tremendous changes as we go into this GalkT.
Wave(Manasische Vibration)you can see it already,it started and is only the Beginning of his comming…so be prepaired in Love to each other…
Agreed HK! Thanks for the energetic comment 🙂
Funny, I was just playing around with muscle testing and I come up with The SR as being Mother Earth’s Anxiety Level… would love it if others could also check that? Thanks! :))
Checked in on this too, and connecting with the frequency, this is GAIA’s upgrade time, and she’s doing what she has been working towards for aeons. The Electro Magnet Fields are shifting and this is allowing more vibration in from the galactic bodies around us while the Sun is on Quiet mode. Earth is out there connecting. It’s a little challenging for her inhabitants as we like to be in control of our Earth Ship, and that seemed to be what the anxiety/stress/tension is that is affecting the beings that live here. Of course, we want to go into Lock Down, control mode, it’s the way. We’re fear driven… we resonate their first.
I began using muscle testing/stress testing/kinesiology about 30 years ago for personal-holistic healing…since then, I’ve expanded it for “greater purposes.” I prefer to connect-the-dots to as many realms as possible. The SR norm is 7.__ and current SR is +40.__, nearing 50. Mathematical/Numerical dot-connecting 7X7 is 49. Historically, 49 has always indicated a tipping point…leading into 50, that is, “The Year of Jubilee.” Historically, The Year of Jubilee always brings about great change. It is said, “history repeats itself.” If we ignore historical, documentable significance, we are doomed. YES…we are at the brink of GREAT CHANGE!!!
Thank you Aldwin!
Excellent focus in using kinesiology. We are doing work on genetic transformations using frequencies now…so all connected.
Paul Fisher
Paul, thanks for your comment and info…more please! Who is “we”? Do “you” have a site to visit for updates and info? Aldwin
Dear Disclosure News,
I have been following the SR for quite awhile now. I know the chart reflects activity for 2 or 3 days at a time..but looking back at previous charts, I’ve noticed that there are often large date gaps in between – like Dec.17 and then skips to Dec.26, for example. I remember there being alot of activity on certain days, but those charts can no longer be viewed.
Could you please make ALL previous charts available to view in chronological order every day?? That would be truly awesome for those of us keeping track and making notes for comparision!… Thank you.
Thanks Moon for the feedback, we did as you suggested as you are absolutely right… hope that the result is satisfactory 🙂 here the page
AWESOME!!! That was a really fast response, Thanks so much!
(and today’s SR is truly mind-blowing..WOW)…
Thank you! You did a great job.
Is here of Schumann resonances shown on a graph only base frequency 7.83 or all the frequencies?
There should be on some websites, somewhere… you have to scout for it 🙂
Can someone explain me, why the Schuman resonances are so important for alot of people? I don’t know anything about the Schuman resonances… thank you. :)!
Quackademic science know nothing about SR, they clearly say it… we know Planet Earth is a living being so probably the SR in an indicator of something about her state… we do not know which one yet but we can speculate it might be the heart beat or something similar…
What seems to me to be interesting is that every time the satellite records these changes, I feel them in my whole being. I clearly have a strong connection with Gaea, but I still have not found the answer, why?
They are the parallel of our brainwaves at the planetary scale. They are entraining our own brainwaves and broadcasting cosmic music encoding to be received and processed by our DNA, therefore influencing EVERY function of our bioenergy field, from circadian rhythms to neurotransmitter production.
It’s kinda something like God’s will in other words.
Very interesting Green Yogi. I wonder how many people have had their circadian rhythms totally screwed up with the jump in SR
Being an a Empath and extremely energy sensitive, It really effects me❣️♀️
Are you still sending the alerts on the Schuman resonance? I haven’t received any for awhile.
Hi Billie, we do! We had some issues these past days…
How do I receive the alerts DN?
Can you please post a legend for the charts and instructions on how to read the charts, how can we tell what has changed between one chart and another day by day?
It’s already there Chantel, above the volcanoes and the live meteor buttons and the SR Gallery you can see Explanation of the Chart, you can click it and it will open a toggle with some indications about the meaning of the SR spectrogram.
I see, Thank you!!
Thank you this has also answered my previous question
Thank you for asking. I was just thinking the same thing.
I have been thinking this for awhile. Doesn’t it seem like the source of your Schumann Resonance might be altering the image. I feel the frequency of Gaia is much different than what I see in the posts.
tahts because it is not Gaias frequency.. it is the frequency of the Son of man the holy grail.. who goes to sleep every night thats why there is no frequency for 8 hours every day
shouldn’t we be talking about the “Amplitude” instead of the word ‘Frequency” ??!?
Probably yes, but not instead, both, frequency and amplitude… the color, white, is the amplitude, how loud it is on that frequency peak.
That’s what i already suggested Leia Vermillion. As a matter of fact, only the amplitude graph effectively shows the entire peaks no matter how high they reach. That only is important in our study.
The frequency graph is actually useless for us, since frequencies always remained fairly stable and that graph never really shows any big event.
The ‘blue’ graph which is published up here daily is in fact useless to us as well, it is NOT in any way reflecting the frequencies and also fails to show amplitude peaks reaching above 40Hz. It only looks attractive but was not conceived to monitor any activity above 40Hz, simply because those who designed this scheme at that time never thought such peaks would be a possibility in the future. lol
In order to properly relate with the spikes in SR, we are to look at the amplitude graph and match the time and value of the spikes (for all 4 colors/amplitudes, not only the white line) with our own energy fluctuations (mood, stamina, blood pressure, heart-rate, sleep-patterns, etc…).
I have monitored this amplitude graph for over a year and have always found relevant synchronicity with my own energy levels and brainwave activity.
I have published the graph and shared my own results with the public on a facebook group, and many folks – all around the world – have corroborated my own findings, proving that the amplitudes are greatly affecting our own brainwaves with the multitude of side effects that this implies.
Furthermore, the spikes in amplitudes recorded in Tomsk-Russia, do affect people anywhere in the world, in real time, as proved by my observations and the testimonies of my peers. It’s not a localized event as it was suggested here in the previous comments.
I do not claim to understand fully the mechanism and modus operandi of the SR monitoring plots but i have been highly affected by the rise in amplitudes since January 2017, in a way that simply can not be denied. And so have been a number of people i am in touch with, who live in various continents and yet are all feeling affected by the spikes at the times shown by the Tomsk station.
If this was understood, may more people would be able to use the amplitude graph to monitor their own synchronicity. Cheers.
A big earthquake in Mexico City 7.1Richter scale, any relation?
nopeee zero
very good !