And
all together, all the voices, all the goals, all the wishes, all the
pains, all the joy, all the good and the evil, all together was the
world.
All together was the river of the becoming, it was the music of life.
Hermann Hesse
Share this: Send the word out using these buttons!
The Q military intelligence program is a pillar of a global political and financial reset process. Here is why it is necessary.
We are coming to the end of summer, with the Labor Day holiday
weekend now in the past. The evenings will grow darker and cooler,
people will return indoors, and the TV screen will regain their
attention.
The Collective Consciousness will turn back to the business of government — and criminal justice.
Clicks on the Ads Keep Us Alive
Senator Graham has made a formal
request to Attorney General Barr for him to declassify the material
related to the illegal spying on the Trump administration.
This Spygate scandal is finally going to hit the public realm,
exposing the corrupt alliance between the DNC, a compromised justice
system, and the crooked mass media.
This sets up a cascade of revelations of high-level criminality — together with further media complicity to cover it up.
This collusion includes both the mass published media, as well as social media platforms.
Corporate News
Four Functions Of QAnon
YouTube, Facebook and Twitter masquerade as neutral communications services, but are really illegal gatekeepers of information.
This denouement to the scandal was long anticipated: a collapse of
credibility of the media institutions that are meant to support the free
flow of information and hold power to account. It is a crisis of trust
the like of which has never been encountered before.
This is where the Q operation comes in: we have had nearly two years of preparation for this moment.
Citizen journalists and alternative media are already taking up the
mantle of reliable and truthful sources, overtaking the discredited
corporate mass media in both audience size and engagement.
I was recently asked to summarize “what is Q?”, and came up with four
core functions that this military intelligence program implements for
these extraordinary times.
Four Functions Of QAnon
1. Q Is A Multi-Year Process To Disclose Secret Illegal Government Activity
There are over 3500 “drops” by Q to
date, but the core tale of corruption is told in the first 100. Anybody
can go read them in an hour or so.
The very uncomfortable truth is that the US Government has long been
beholden to an institutionalized system of transnational crime, that has
also hijacked many other countries.
Q gave open source researchers a framework in which to “dig” for data
on this system of criminality. The belief that Hillary Clinton —
essentially a puppet of that system — could not lose the 2016 election
had made them careless, and left an extensive public evidence trail.
The result is a vast trove of vetted data collated by anonymous citizens working in collaboration worldwide.
To say that what has been uncovered is disturbing is to miss the
point: not only are many “conspiracy theories” true, they are
interlinked as part of a single plan to destroy freedom and bring on
global totalitarian rule.
Your worst nightmares of betrayal and genocide were being actively implemented — by those who had sworn to serve you.
Specifically, Obama was not a legitimate President, and every part of his legacy will be dismantled.
He is the greatest political fraud ever perpetrated, and that is against some stuff competition from his predecessors.
Hillary Clinton was meant to be a continuation of that fraud to its
destructive conclusion. The corporate media have known this all along,
and exposure of the plot will destroy them.
At the heart of this psychopathic system of criminal power is the
multi-generational abuse of children, tied to an ancient sex and death
cult.
Government by occult forces seems like science fiction, but it turns
out to be the world we live in. Understanding this ugly reality is the
key to ending the evil that it perpetuates.
Four Functions Of QAnon
2. Q Is A Prophylactic Against Civil War And Vigilante Activity
The last two years have seen a nonstop battle between the mainstream and alternative media for “narrative supremacy”.
It has involved the mass media pushing the Russiagate hoax, which now lies broken and exposed as a fabricated and paid-for lie.
The mass media had to attempt to unseat President Trump in order to
preserve themselves. Whilst the attempted coup it represents is very
serious, in many ways this has proven to be a distraction.
The public has been kept engaged — and dare I say even entertained —
with this drama, whilst the painstaking process of cleaning up the
justice system has quietly taken place in the background.
Q has given activists for justice a focus that they otherwise would
have lacked. Q has offered an angry public hope — grounded in practical
progress — of a peaceful outcome using the lawful system of civilian and
military justice.
For the real challenge is not arraigning the traitors, but doing so in a way that doesn’t cause society to collapse.
As the treason of many trusted politicians, business leaders, and
military personnel is now revealed, there is an established Q movement
with a track record of peaceful investigation of the truth, rather than
vigilante activity seeking revenge.
The collapse of trust in the mass media — who covered for these crimes — will not leave a vacuum for troublemakers to occupy.
The Q drops demonstrate that what is unfolding is all part of a
managed process of justice that has been thought through with military
precision.
It gives ordinary people awakening to the nightmare confidence in the
plan for resolution, and a good reason to reject those who would wish
to cause harm by inciting violence or insurrection.
Four Functions Of QAnon
3. Q Is A Training Program In Discernment And Logical Thinking
Decades of media brainwashing and
social conditioning have led much of the public to mistrust their own
judgement, and to disbelieve the evidence of their own eyes and ears.
The weaponisation of mass media against the very citizens it was
meant to protect creates deep social division and mutual distrust.
Propaganda has been packaged as journalism, and the skill of
distinguishing these is not offered in schools. Quite the opposite is
true: public education has become indoctrination.
Criminals have taught people to shut down rational inquiry on hearing
the term “conspiracy theory”, and hence ignore their crimes, based on
the threat of being ridiculed and socially ostracised.
Q is like a grand bootcamp for digital soldiers, who have to learn to
deal with this complex and contentious information landscape.
The Q drops frequently use the Socratic method, encouraging learning
via asking questions, rather than providing packaged answers.
Q incites people to think for themselves — rather than telling people what to think — and to use logic rather than emotion.
Q has helped us to understand what kinds of data we can rely on in a
data environment filled with disinformation, and what we should be wary
of.
We have had to become more judicious in our selection of valid
sources, and more discerning about future dates and events that may or
may not transpire.
Q has validated our trust in evidence and reason over purported authority.
Two years of the building of this “Q Army” has created a mass
movement of people who question everything they are told, taking nothing
at face value.
We have learned to expand our thinking, and are open to new
possibilities that would previously have been dismissed as too “out
there”.
For the truth really is stranger than fiction — by far.
Four Functions Of QAnon
4. Q Is An Information Weapon Against Institutionalised Crime And Corrupted Media
The corporate media is the most powerful weapon of the criminal “deep state” that is right now being removed from power.
The media’s deceit has captured the souls of many of our compatriots into a web of lies and hatred.
To counter this, Q has created a formidable foe to take on the “fake
news”, as digital soldiers dissect every falsehood in real time, 24×7.
In the coming battle, the corrupt mass media will attempt to spin everything to their advantage — no matter how indefensible.
They have already been working hard to get ahead of the story,
setting up doubts about video evidence as being “deep fakes”; suggesting
that paedophilia is a sexual preference rather than a serious crime;
and even attempting to normalise cannibalism. (The word “pedovore” is
one I wish I hadn’t had reason to encounter.)
Ultimately the public are going to have to decide who is telling the truth: is the mass media offering journalism or propaganda?
Can it be really true that they are just one coordinated narrative under so many seemingly independent brands?
How could such an unethical system of mind control ever be possible in a modern technological age?
The Q operation has been set up with the ultimate catch-22 for a
corrupt corporate media, proving conclusively that it is pure
propaganda, and not legitimate journalism. How so?
The identity of Q is deliberately opaque. Q is not a “formal” program
of the US government or military. Yet Q offers hundreds of data points
that demonstrate Q is indeed linked to the Trump administration.
Any ordinary person can seek these out and validate them. They are
beyond compelling. Meanwhile, the corporate media writes endless hit
pieces on Q denouncing everything Q offers as “debunked conspiracy
theory”.
They write ad hominem attacks on those who think for themselves and reject the media’s false narrative.
Yet these “journalists” never do the most basic investigative
activity of asking President Trump whether Q is legitimate, and if he is
connected to it.
This “Q question” turns Q into the most powerful (and paradoxical)
information weapon in history: the credibility of the entire mass media
is on the line, and every day they fail to ask it more people come to
realise they are not in the business of journalism.
The mass media’s refusal to ask this simple question constantly
destroys their credibility, with no action or effort required by the
forces of truth.
As Spygate and other scandals
unfold, the outrage of the public at the complicity of the media will
grow, and demands for the “Q question” to be asked will become
irresistible.
At that point, the corrupt corporate media will have triggered their
own demise: every assertion of Q they dispute will necessitate public
proof. An avalanche of disclosure will cascade down and bury them.
Every previous hit piece they wrote on Q will act as an epitaph — and
a warning to those who might consider such organised lies in future.
Clicks on the Ads Keep Us Alive
Earth
There
will be a shifting of the poles. There will be upheavals in the Arctic
and the Antarctic that will make fotr the eruption of volcanos in the
Torrid areas… The upper portion of Europe will be changed in the blink
of an eye. The earth will be broken up in the western portion of
America. The greater portion of Japan must go into the sea.
Edgar Cayce
Share this: Send the word out using these buttons!
~Jeffrey Epstein was a guest at Princess Beatrice’s 18th birthday party at Windsor Castle. ~Indonesia urges calm in Papua after two weeks of protests. ~Mysterious radio signal detected by high-tech Chinese telescope. ~Cybersecurity researcher receives € 2500 from Telegram for uncovering app bug. ~Italian Govt wins first of two mandatory confidence vote in Parliament.
~New talks between the US and North Korea may soon be scheduled. ~MIT Media Lab referred to Epstein as ‘Voldemort’ to conceal identity. ~France says time has come to ease tensions with Russia. ~Van packed with a 1,000 gallons of gas found ahead of Trump’s visit to Baltimore. ~50 US states launched an investigation into Goog dominance of the online advertising.
~Hong Kong today marching to the US Consulate. ~India to ban six single-use plastic products from October 2. ~Google censors ‘offensive’ ad for traditional ‘faggots & peas’ dish. ~Trump tweets photo of lightning strike near Air Force One. ~Eurowings fly into a CB: 13 injured, 8 requiring hospitalization.
Ranking of the World’s Top Gold Owners
United States – 8,133 tonnes
Germany – 3,369 tonnes
IMF – 2,814 tonnes
Italy – 2,451 tonnes
France – 2,436 tonnes
Strongest EQ in Europe M4.3 Greece Strongest EQ in US M4.6 Arizona Strongest EQ on the Planet M5.6 Philippines
News Burst 11 September 2019
Share this: Send the word out using these buttons!
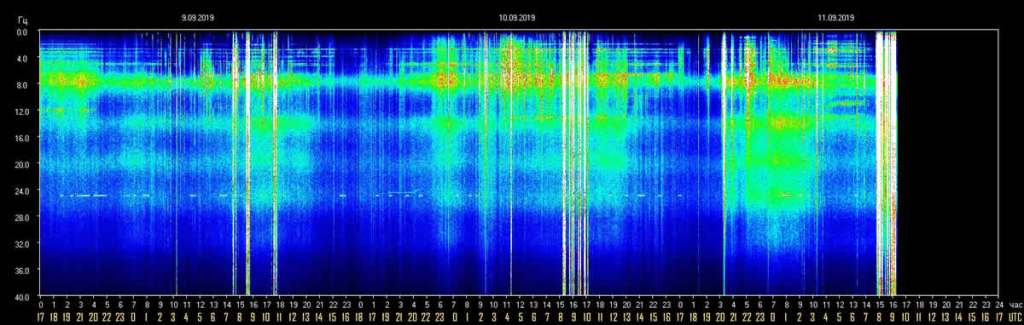
Editor’s Note: Yes…once again after about 24 hours, we see an intense period of very high amplitude Schumann Resonance energies from just before 3:00AM lasting solidly until 4:00AM when this graph ends.
This period shows Schumann Resonance energies that are not slightly separated by short periods of inactivity, thus making these more dense and palpable. The Schumann Resonance energies are reflective of both cosmic and solar radiation coming to Earth which are changing our human bodies.
Now, you must understand our bodies require this change in order to hold higher levels of energy needed to BE in the 5D world. Thus, various brief symptoms of vague discomfort (diarrhea, headache, flu-like malaise, etc.) can be called “Ascension symptoms”.
Of course, please see a physician for any long term difficulties you may be having, know why brief symptoms may exist, understand you are changing for the better, and BE…
Schumann Resonance Today. We will
try to keep you updated about the variations of the Resonance with this
page. The great variations that nobody can explain but that give us a
clear sign that the planet is changing. The Earth is vibration higher
and higher, just like us!
The Chart time is based on Tomsk – Russia – UTC +7Source
RS Base Frequency 7.83 Hz.
Schumann Resonance Today Peaks:
9/11 10:00 UTC – There was
no actual pause after yesterday’s activity, the movements continued with
a peak to 29 Hz at 20 UTC while a more powerful activity occurred from 8
UTC with two peaks above 40 Hz the strongest of which to 43 Hz at 9
UTC.
9/10 17:00 UTC – Calm. The movements ended at 10 UTC.
9/10 10:30 UTC – Today’s chart shows an activity similar to
yesterday’s, with isolated peaks, but slightly more continuous. The
movements started at 23 UTC yesterday with slight variations. The most
significant peaks occurred in rapid succession from 8 UTC with the
maximum value 34 Hz at 8:20 UTC.
9/9 17:00 UTC – After the two peaks previously reported, another one occurred at 20 Hz at 10:30 UTC after which it was calm.
9/9 11:00 UTC – A pair of isolated peaks has been the activity of
today until now, the first at 7:30 UTC has reached 27 Hz, the second
peak 1 hour later at 8:30 UTC has been at 37 Hz.
9/8 17:00 UTC – Even today, looking at the chart, one has the
feeling that the activity, in the last four days, is gradually
decreasing. Today the movements lasted 6 hours, from 6 to 12 UTC, the
maximum peak was 23 Hz at around 7 UTC.
9/7 17:00 UTC – Today’s graph shows that in the last 3 days there
has been a decline in the intensity of the activity. Today the movements
started at 5 and lasted until 11:30 UTC, during this period the maximum
peak was 30 Hz at 8:30 UTC.
9/6 17:00 UTC – Today’s activity period lasted for about 12 hours,
from 23 UTC yesterday to 11 UTC today, now the situation is calm.
9/6 10:30 UTC – The activity today started at midnight UTC with
small variation on the 15 Hz threshold, from 4 UTC the values increased
slightly reaching 20 Hz, at 8 UTC we had the strongest peak until now
that reached 44 Hz.
9/5 17:00 UTC – The activity after the strong movement described
earlier remained calm. The black band is due to lack of data for that
time period.
9/5 10:00 UTC – The TSU site had some glitches until now, the
surprise update shows us a strong activity. The opening was given by an
isolated peak at 55 Hz followed by a period of about 2 hours of strong
movements culminating with a 67 Hz spike at at 8:30 UTC.
9/4 17:00 UTC – Another spike at 27 Hz occurred during a short period of activity lasted 1 hour from 11:30 UTC.
9/4 10:00 UTC – The activity continued uninterrupted even today, the
most significant part up to now has started at 7 UTC and has led to a
peak at 40 Hz just before 8 UTC.
9/3 17:00 UTC – Even in today’s chart we can see that there wasn’t a
real calm. The periods of most intense activity were two: the first
from 7 to 9 UTC which reached the maximum at 20 Hz; the second from 14
to 15 UTC with the maximum at 36 Hz.
9/2 17:00 UTC – The situation, after the previous peaks, is in a phase of calm.
9/2 11:30 UTC – The variations continued practically without
interruption even if with moderate values, at 7 UTC a more significant
activity began which led to a peak at 69 Hz at 8 UTC followed by another
at 40 Hz about an hour later. This period of elevated activity lasted
about 2 hours.
9/1 17:00 UTC – There has been no pause, although without excessive
values the activity has been continuous and seems to last longer. An
isolated peak at 37 Hz occurred at 12:20 UTC.
9/1 09:00 UTC – Movements restarted shortly after the midnight shown
on the chart, corresponding to 17 UTC. Peaks were moderate with the
strongest that reached 36 Hz at 20:30 UTC. After this a period of
variations started with the average value being at 20 Hz for 6
continuous hours, from 23 to 5 UTC this morning.
8/31 17:00 UTC – Today was a day of continuous light activity. The
most active part was from 6 to 10 UTC with two peaks over 30 Hz.
8/30 17:00 UTC – The activity is continuing even if the duration of
the peaks is lower, at the highest peak of today at 68 Hz others
followed, all higher than 55. Since 10:30 UTC today the average has been
above 40 Hz.
8/30 13:30 UTC – At 8 UTC, quite suddenly, started a powerful
activity that after an initial peak at 37 just before 11 UTC led to a
powerful 68 Hz around 13 UTC.
8/30 09:00 UTC – The activity that we have seen started yesterday in
the last part of the chart continued at low but constant levels, so far
there has not been a calm period, even if the maximum peaks have only
reached 17 Hz.
8/29 17:00 UTC – Effectively after the isolated peak of this morning
not much happened, just a glimpse of a movement, actually ongoing, that
started at 16 UTC.
8/29 09:00 UTC – It seems that today will be a day of relative calm,
an isolated quick peak occurred just before 6 UTC and reached 19 Hz.
8/28 17:00 UTC – After the past strong activity, today, has been a
day of relative calm, a light activity occurred from 5 to 11 UTC and the
strongest peak was just before 8 UTC at 17 Hz.
8/27 17:00 UTC – After the previous peak, the activity continued and
seems to be still ongoing. The peaks were slightly lower, at 30 Hz.
8/27 13:30 UTC – After 17 hours of calm, at 4 UTC today, a strong
increase in activity began, at first gradual then from 10 UTC much more
intense. The maximum was reached at 5:20 UTC with 59 Hz.
8/26 17:00 UTC – Four isolated peaks today, spaced one from the
other from about 2 hours from 4 to 9 UTC with the maximum value at 26
Hz.
8/25 17:00 UTC – In total, today’s activity lasted about 9 hours,
from 4 to 13 UTC. During this period there were 3 peaks over 40 Hz. From
7 to 10 UTC.
8/25 09:30 UTC – This morning at 4 UTC started a consistent activity
that seems it could lead to significant peaks. In about 3 hours of
constantly increasing values, at 7 UTC it reached 40 Hz.
8/24 17:00 UTC – Minor activity today, limited from 7 to 11 UTC, the maximum peak was at 20 Hz at 10:30 UTC.
8/23 17:00 UTC – Today’s significant activity was concentrated in
about 5 hours, from 4 to 9 UTC, during this period there were 3 peaks
30, 27 and 25 Kek. After this phase of movement, some latency has
remained.
8/22 17:00 UTC – Even today a sort of continuous but scattered
activity, shortly after midnight on the chart, 17 UTC, there were
variations in amplitude dependencies of a SR frequency of 24 Hz (this
for purists who say that the amplitude does not expresses in Hz). A
further peak (… … … ….) 34 Hz occurred at 12:30 UTC and marked the
beginning of a minor activity that seems to have ended at 17 UTC.
8/21 17:00 UTC – After the peaks previously reported, the situation
gradually returned to normal, only a small flicker at 14 at 13:30 UTC.
8/20 17:00 UTC – The light activity we saw yesterday did not stop
and in this new chart we see that it began to intensify since 20 UTC
yesterday to then generate a significant first peak at 2 UTC which
reached 36 Hz. A few hours later, at 6 UTC, has begun what so far is the
strongest activity of the last few days which led immediately to a peak
of 46 Hz followed by 44 Hz at 7:45 UTC.
8/20 17:00 UTC – Today was characterized by a continuous light
background activity that had its isolated peaks at 37 and 26 Hz at 4:45
and 10:30 UTC respectively.
8/19 17:00 UTC – Another calm day, there were some variations on 10 Hz around 4 and 9 UTC.
8/18 17:00 UTC – Calm.
8/17 17:00 UTC – For the 17th of the month, as often happened, there
was a bit of entertainment with this representation created by this
series of peaks, each lasting about 30 minutes, of a series of bars …
Regarding the values , the 57 Hz previously reported remained the
highest.
8/17 12:00 UTC – Significant activity began this morning at 6 UTC.
The variations have been increasing with peaks at 22, 30, 35, 46 and 57
Hz. The latter occurred shortly after 11 UTC.
8/16 17:00 UTC – A further modest isolated peak occurred at 11:30
UTC with 15 Hz. This interrupted the calm condition that returned soon
after.
8/16 11:30 UTC – Today’s activity until now resulted in 3 isolated
peaks, all around 23 Hz, occurred at 5, 6 and 7:30 UTC. Apart from these
variations it was a condition of calm.
8/15 17:00 UTC – After the peak at 33 Hz the amplitude slowly began
to decrease with peaks always decreasing until reaching normal values at
13 UTC.
8/15 11:00 UTC – Today’s first peak was at 22 Hz at 5:30 UTC and
marked the beginning of today’s variations. A second isolated peak
reached 33 Hz at 8 UTC.
8/14 17:00 UTC – Today’s activity is similar to that of yesterday,
only that it was longer, from 2 to 12 UTC. The maximum peaks were 35 and
37 Hz at 6:30 am and 8:30 UTC.
8/13 17:00 UTC – After the peaks described previously, the variations in amplitude decreased until calm was reached at 13 UTC.
8/13 10:30 UTC – Today is presenting us a medium activity in
progress with variations in the amplitude of the Resonance that started
at 4 UTC. The first peaks were on 25 Hz while the one that is the
highest until now has reached 37 Hz at 7:30 UTC. A further intense peak
reached 32 Hz at 9:30 UTC.
8/12 17:00 UTC – Today there was a light and sparse activity, in the
morning UTC peaks occurred at 15 Hz while at 12 UTC there was a strong
isolated peak at 47 Hz.
8/11 17:00 UTC – Today’s significant movements began around 7 UTC
and soon led to the first of two today’s peaks, 32 Hz at 8 UTC. The
second and greatest peak today was 36 Hz at 9:20 UTC. In total this more
intense phase lasted about 3 hours.
8/10 17:00 UTC – The day continued with rising peaks that after
those reported previously continued until reaching today’s high of 35 Hz
at 10:45 UTC. From 12:30 UTC the situation is calm.
8/10 11:00 UTC – Also today we’re having medium activity, started at
5 UTC. The peaks occurred with amplitude increasing values, from 20 Hz
up to what is the highest until now, 30 Hz at 9:20 UTC.
8/9 17:00 UTC – Dopo il picco riportato in precedenza l’attività è andata calando fino alla calma.
8/9 15:30 UTC – Still light activity, from around 10 UTC very slight
variations have started but have led to a peak at 39 Hz at 14 UTC.
8/9 11:00 UTC – After the powerful peak yesterday the activity
remained calm until 4 UTC today when movements created two consecutive
peaks at 20 Hz. After this slight activity the situation became calm
again.
8/8 17:00 UTC – Today’s activity lasted for about 10 hours, from 6
to 16 UTC. The maximum peak is the one reported previously. Now the
situation is calm.
8/8 14:00 UTC – Today’s graph shows the sudden start of a strong
activity started at 8 UTC, within 30 minutes the maximum peak was
reached at 74 Hz. The movements are continuing with other peaks around
30 Hz.
8/7 17:00 UTC – Today there are only 3 isolated and moderate peaks,
the first at 6:45 UTC at 19 Hz, the second at 7:20 UTC at 15 Hz and the
third and last at 8 UTC at 10 Hz. Before and after these peaks was calm .
8/6 17:00 UTC – Not much to report today, the activity was
concentrated around midnight UTC with a maximum peak at 11 Hz at 00:30
UTC.
8/5 17:00 UTC – The resonance remained at a constant level of
background, from the amplitude graph we note that there is never really a
calm like yesterday. It probably has something to do with the moderate
Geomagnetic Storm (see Space Weather) currently underway with KPI 5.
8/4 17:00 UTC – Light activity from 9 to 12 UTC with two peaks at 19 and 16 Hz.
8/3 17:00 UTC – Calm from 13 UTC.
8/3 09:30 UTC – Yesterday’s light activity, which started just
before the 24 hours of the chart corresponding to 17 UTC, continued
until 19 UTC and the amplitude slightly exceeded 10 Hz. This was
followed by another activity from 00 UTC today and the highest peak at
41 Hz occurred soon after, at 00:20 UTC. Another spike at 40 Hz followed
at 9 UTC.
8/2 17:00 UTC – Today the activity was concentrated in 6 hours, from
2 to 8 UTC, the maximum peak was the one described above. In the last
part of the trip reported, from 14 UTC a constant started but for now
light activity.
8/2 08:30 UTC – Today we are witnessing what appears to be the
beginning of a significant phase of activity, it started at 2 UTC and is
continuing. After a first peak at 29 Hz at 3:30 UTC, a much higher
spike followed reaching 68 Hz at 4:15 UTC.
8/1 17:00 UTC – We returned to a light activity, the significant
part took place from 6 to 12 UTC with the maximum peak of 27 Hz at 7:40
UTC.
Frequency means how many wave cycle happen in a second, 1 Hz.
means 1 cycle per second, 40 Hz. means 40 cycles per second, Amplitude
is the size of the vibration, how big is the wave, the chart shows the
frequency variation in Hz and the amplitude using the white color.
Note
The Ancient Indian Rishis called 7.83 Hz the frequency of OM. It also happens to be Mother Earth’s natural heartbeat rhythm
Schumann resonances are named after professor
Schumann who was involved in early German secret space program and was
later paper-clipped into the United States. The frequencies of Schumann resonances are fairly stable and are mainly defined by the physical size of the ionospheric cavity.
The amplitude of Schumann resonances does
change and is bigger when ionospheric plasma gets excited. Ionospheric
plasma excitation happens because of solar activity, thunderstorms, use
of scalar plasma weapons and HAARP and lately also when the Light forces
are clearing the plasma anomaly.
Dependencies of Amplitudes Schumann Resonance September 11 2019
Dependencies of Quality Schumann Resonance September 10 2019
Dependencies of Frequency Schumann Resonance September 10 2019
All the SR daily images in one single pageSee the Images
Explanation of The Chart
The Schumann Resonance Spectrogram Chart
The Schumann Resonance Chart displays data from the magnetic field
detector to monitor the resonances occurring in the plasma waves
constantly circling the earth in the ionosphere. These three days
spectrograms show the activity occurring at the various resonant
frequencies from 1 to 40 Hz. Within the spectrogram, the power, or
intensity level of each frequency is displayed as a color, with white
being the most intense. The Schumann Resonances appear as the horizontal
lines at 0.0, 4.0, 8.0, 12.0, 16.0, 20.0, 24.0, 28.0, 32.0, 36.0 &
40.0 Hz. This chart is based on Tomsk, Russia, time UTC +7 (UTC =
Universal Time Coordinated).
What is a Spectrogram?
The Spectrogram Calendar is a visual representation of the range of
frequencies in the magnetic field at a given location. Similar to how an
equalizer displays the frequency content of music played on your
stereo, the spectrogram calendar displays the frequency content of a
magnetic field. Instead of showing a brief snapshot, it shows changes
over a period of time, in this case 3 days.
The local magnetic field is a dynamic field that changes constantly
because of variations in the ionosphere and sun and many other
influences not yet fully understood. The range of variation displayed in
the spectrogram chart is from 0 to 40 cycles per second. The vertical
axis is frequency and the horizontal axis is time. The amplitude of a
particular frequency at a specific time is represented by the intensity
of color (green, yellow, white) of each point in the image.
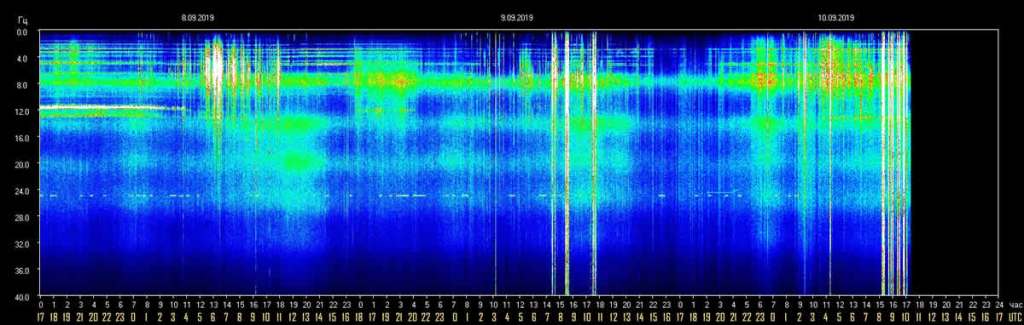
Editor’s Note: Again we see a flurry of intense spikes of high amplitude Schumann Resonance energies overnight here in America one from 9:30PM, another sort burst at 11″30PM. This occurred before a series of intense spikes ranging from 3:00AM until the graph ends at 5:00AM.
These releases of resonant energy from Mother Earth (these being the “heartbeat of Mother Earth”) seem to be following the familiar pattern of happening roughly every 28-20 hours. Is this timing allowing humanity to “catch their breathe” in between emissions? We do know incoming cosmic and solar energies are indeed changing our DNA and responsible for the “Ascension symptoms” felt by many (if not all of us!)
So…please view this graph, understand why wonderful (although it may not feel like it right now!) changes are occurring in your body, and BE…
InJoy!
34
Schumann Resonance Today. We will
try to keep you updated about the variations of the Resonance with this
page. The great variations that nobody can explain but that give us a
clear sign that the planet is changing. The Earth is vibration higher
and higher, just like us!
The Chart time is based on Tomsk – Russia – UTC +7Source
RS Base Frequency 7.83 Hz.
Schumann Resonance Today Peaks:
9/9 17:00 UTC – Today’s
chart shows an activity similar to yesterday’s, with isolated peaks, but
slightly more continuous. The movements started at 23 UTC yesterday
with slight variations. The most significant peaks occurred in rapid
succession from 8 UTC with the maximum value 34 Hz at 8:20 UTC.
9/9 17:00 UTC – After the two peaks previously reported, another one occurred at 20 Hz at 10:30 UTC after which it was calm.
9/9 11:00 UTC – A pair of isolated peaks has been the activity of
today until now, the first at 7:30 UTC has reached 27 Hz, the second
peak 1 hour later at 8:30 UTC has been at 37 Hz.
9/8 17:00 UTC – Even today, looking at the chart, one has the
feeling that the activity, in the last four days, is gradually
decreasing. Today the movements lasted 6 hours, from 6 to 12 UTC, the
maximum peak was 23 Hz at around 7 UTC.
9/7 17:00 UTC – Today’s graph shows that in the last 3 days there
has been a decline in the intensity of the activity. Today the movements
started at 5 and lasted until 11:30 UTC, during this period the maximum
peak was 30 Hz at 8:30 UTC.
9/6 17:00 UTC – Today’s activity period lasted for about 12 hours,
from 23 UTC yesterday to 11 UTC today, now the situation is calm.
9/6 10:30 UTC – The activity today started at midnight UTC with
small variation on the 15 Hz threshold, from 4 UTC the values increased
slightly reaching 20 Hz, at 8 UTC we had the strongest peak until now
that reached 44 Hz.
9/5 17:00 UTC – The activity after the strong movement described
earlier remained calm. The black band is due to lack of data for that
time period.
9/5 10:00 UTC – The TSU site had some glitches until now, the
surprise update shows us a strong activity. The opening was given by an
isolated peak at 55 Hz followed by a period of about 2 hours of strong
movements culminating with a 67 Hz spike at at 8:30 UTC.
9/4 17:00 UTC – Another spike at 27 Hz occurred during a short period of activity lasted 1 hour from 11:30 UTC.
9/4 10:00 UTC – The activity continued uninterrupted even today, the
most significant part up to now has started at 7 UTC and has led to a
peak at 40 Hz just before 8 UTC.
9/3 17:00 UTC – Even in today’s chart we can see that there wasn’t a
real calm. The periods of most intense activity were two: the first
from 7 to 9 UTC which reached the maximum at 20 Hz; the second from 14
to 15 UTC with the maximum at 36 Hz.
9/2 17:00 UTC – The situation, after the previous peaks, is in a phase of calm.
9/2 11:30 UTC – The variations continued practically without
interruption even if with moderate values, at 7 UTC a more significant
activity began which led to a peak at 69 Hz at 8 UTC followed by another
at 40 Hz about an hour later. This period of elevated activity lasted
about 2 hours.
9/1 17:00 UTC – There has been no pause, although without excessive
values the activity has been continuous and seems to last longer. An
isolated peak at 37 Hz occurred at 12:20 UTC.
9/1 09:00 UTC – Movements restarted shortly after the midnight shown
on the chart, corresponding to 17 UTC. Peaks were moderate with the
strongest that reached 36 Hz at 20:30 UTC. After this a period of
variations started with the average value being at 20 Hz for 6
continuous hours, from 23 to 5 UTC this morning.
8/31 17:00 UTC – Today was a day of continuous light activity. The
most active part was from 6 to 10 UTC with two peaks over 30 Hz.
8/30 17:00 UTC – The activity is continuing even if the duration of
the peaks is lower, at the highest peak of today at 68 Hz others
followed, all higher than 55. Since 10:30 UTC today the average has been
above 40 Hz.
8/30 13:30 UTC – At 8 UTC, quite suddenly, started a powerful
activity that after an initial peak at 37 just before 11 UTC led to a
powerful 68 Hz around 13 UTC.
8/30 09:00 UTC – The activity that we have seen started yesterday in
the last part of the chart continued at low but constant levels, so far
there has not been a calm period, even if the maximum peaks have only
reached 17 Hz.
8/29 17:00 UTC – Effectively after the isolated peak of this morning
not much happened, just a glimpse of a movement, actually ongoing, that
started at 16 UTC.
8/29 09:00 UTC – It seems that today will be a day of relative calm,
an isolated quick peak occurred just before 6 UTC and reached 19 Hz.
8/28 17:00 UTC – After the past strong activity, today, has been a
day of relative calm, a light activity occurred from 5 to 11 UTC and the
strongest peak was just before 8 UTC at 17 Hz.
8/27 17:00 UTC – After the previous peak, the activity continued and
seems to be still ongoing. The peaks were slightly lower, at 30 Hz.
8/27 13:30 UTC – After 17 hours of calm, at 4 UTC today, a strong
increase in activity began, at first gradual then from 10 UTC much more
intense. The maximum was reached at 5:20 UTC with 59 Hz.
8/26 17:00 UTC – Four isolated peaks today, spaced one from the
other from about 2 hours from 4 to 9 UTC with the maximum value at 26
Hz.
8/25 17:00 UTC – In total, today’s activity lasted about 9 hours,
from 4 to 13 UTC. During this period there were 3 peaks over 40 Hz. From
7 to 10 UTC.
8/25 09:30 UTC – This morning at 4 UTC started a consistent activity
that seems it could lead to significant peaks. In about 3 hours of
constantly increasing values, at 7 UTC it reached 40 Hz.
8/24 17:00 UTC – Minor activity today, limited from 7 to 11 UTC, the maximum peak was at 20 Hz at 10:30 UTC.
8/23 17:00 UTC – Today’s significant activity was concentrated in
about 5 hours, from 4 to 9 UTC, during this period there were 3 peaks
30, 27 and 25 Kek. After this phase of movement, some latency has
remained.
8/22 17:00 UTC – Even today a sort of continuous but scattered
activity, shortly after midnight on the chart, 17 UTC, there were
variations in amplitude dependencies of a SR frequency of 24 Hz (this
for purists who say that the amplitude does not expresses in Hz). A
further peak (… … … ….) 34 Hz occurred at 12:30 UTC and marked the
beginning of a minor activity that seems to have ended at 17 UTC.
8/21 17:00 UTC – After the peaks previously reported, the situation
gradually returned to normal, only a small flicker at 14 at 13:30 UTC.
8/20 17:00 UTC – The light activity we saw yesterday did not stop
and in this new chart we see that it began to intensify since 20 UTC
yesterday to then generate a significant first peak at 2 UTC which
reached 36 Hz. A few hours later, at 6 UTC, has begun what so far is the
strongest activity of the last few days which led immediately to a peak
of 46 Hz followed by 44 Hz at 7:45 UTC.
8/20 17:00 UTC – Today was characterized by a continuous light
background activity that had its isolated peaks at 37 and 26 Hz at 4:45
and 10:30 UTC respectively.
8/19 17:00 UTC – Another calm day, there were some variations on 10 Hz around 4 and 9 UTC.
8/18 17:00 UTC – Calm.
8/17 17:00 UTC – For the 17th of the month, as often happened, there
was a bit of entertainment with this representation created by this
series of peaks, each lasting about 30 minutes, of a series of bars …
Regarding the values , the 57 Hz previously reported remained the
highest.
8/17 12:00 UTC – Significant activity began this morning at 6 UTC.
The variations have been increasing with peaks at 22, 30, 35, 46 and 57
Hz. The latter occurred shortly after 11 UTC.
8/16 17:00 UTC – A further modest isolated peak occurred at 11:30
UTC with 15 Hz. This interrupted the calm condition that returned soon
after.
8/16 11:30 UTC – Today’s activity until now resulted in 3 isolated
peaks, all around 23 Hz, occurred at 5, 6 and 7:30 UTC. Apart from these
variations it was a condition of calm.
8/15 17:00 UTC – After the peak at 33 Hz the amplitude slowly began
to decrease with peaks always decreasing until reaching normal values at
13 UTC.
8/15 11:00 UTC – Today’s first peak was at 22 Hz at 5:30 UTC and
marked the beginning of today’s variations. A second isolated peak
reached 33 Hz at 8 UTC.
8/14 17:00 UTC – Today’s activity is similar to that of yesterday,
only that it was longer, from 2 to 12 UTC. The maximum peaks were 35 and
37 Hz at 6:30 am and 8:30 UTC.
8/13 17:00 UTC – After the peaks described previously, the variations in amplitude decreased until calm was reached at 13 UTC.
8/13 10:30 UTC – Today is presenting us a medium activity in
progress with variations in the amplitude of the Resonance that started
at 4 UTC. The first peaks were on 25 Hz while the one that is the
highest until now has reached 37 Hz at 7:30 UTC. A further intense peak
reached 32 Hz at 9:30 UTC.
8/12 17:00 UTC – Today there was a light and sparse activity, in the
morning UTC peaks occurred at 15 Hz while at 12 UTC there was a strong
isolated peak at 47 Hz.
8/11 17:00 UTC – Today’s significant movements began around 7 UTC
and soon led to the first of two today’s peaks, 32 Hz at 8 UTC. The
second and greatest peak today was 36 Hz at 9:20 UTC. In total this more
intense phase lasted about 3 hours.
8/10 17:00 UTC – The day continued with rising peaks that after
those reported previously continued until reaching today’s high of 35 Hz
at 10:45 UTC. From 12:30 UTC the situation is calm.
8/10 11:00 UTC – Also today we’re having medium activity, started at
5 UTC. The peaks occurred with amplitude increasing values, from 20 Hz
up to what is the highest until now, 30 Hz at 9:20 UTC.
8/9 17:00 UTC – Dopo il picco riportato in precedenza l’attività è andata calando fino alla calma.
8/9 15:30 UTC – Still light activity, from around 10 UTC very slight
variations have started but have led to a peak at 39 Hz at 14 UTC.
8/9 11:00 UTC – After the powerful peak yesterday the activity
remained calm until 4 UTC today when movements created two consecutive
peaks at 20 Hz. After this slight activity the situation became calm
again.
8/8 17:00 UTC – Today’s activity lasted for about 10 hours, from 6
to 16 UTC. The maximum peak is the one reported previously. Now the
situation is calm.
8/8 14:00 UTC – Today’s graph shows the sudden start of a strong
activity started at 8 UTC, within 30 minutes the maximum peak was
reached at 74 Hz. The movements are continuing with other peaks around
30 Hz.
8/7 17:00 UTC – Today there are only 3 isolated and moderate peaks,
the first at 6:45 UTC at 19 Hz, the second at 7:20 UTC at 15 Hz and the
third and last at 8 UTC at 10 Hz. Before and after these peaks was calm .
8/6 17:00 UTC – Not much to report today, the activity was
concentrated around midnight UTC with a maximum peak at 11 Hz at 00:30
UTC.
8/5 17:00 UTC – The resonance remained at a constant level of
background, from the amplitude graph we note that there is never really a
calm like yesterday. It probably has something to do with the moderate
Geomagnetic Storm (see Space Weather) currently underway with KPI 5.
8/4 17:00 UTC – Light activity from 9 to 12 UTC with two peaks at 19 and 16 Hz.
8/3 17:00 UTC – Calm from 13 UTC.
8/3 09:30 UTC – Yesterday’s light activity, which started just
before the 24 hours of the chart corresponding to 17 UTC, continued
until 19 UTC and the amplitude slightly exceeded 10 Hz. This was
followed by another activity from 00 UTC today and the highest peak at
41 Hz occurred soon after, at 00:20 UTC. Another spike at 40 Hz followed
at 9 UTC.
8/2 17:00 UTC – Today the activity was concentrated in 6 hours, from
2 to 8 UTC, the maximum peak was the one described above. In the last
part of the trip reported, from 14 UTC a constant started but for now
light activity.
8/2 08:30 UTC – Today we are witnessing what appears to be the
beginning of a significant phase of activity, it started at 2 UTC and is
continuing. After a first peak at 29 Hz at 3:30 UTC, a much higher
spike followed reaching 68 Hz at 4:15 UTC.
8/1 17:00 UTC – We returned to a light activity, the significant
part took place from 6 to 12 UTC with the maximum peak of 27 Hz at 7:40
UTC.
Frequency means how many wave cycle happen in a second, 1 Hz.
means 1 cycle per second, 40 Hz. means 40 cycles per second, Amplitude
is the size of the vibration, how big is the wave, the chart shows the
frequency variation in Hz and the amplitude using the white color.
Note
The Ancient Indian Rishis called 7.83 Hz the frequency of OM. It also happens to be Mother Earth’s natural heartbeat rhythm
Schumann resonances are named after professor
Schumann who was involved in early German secret space program and was
later paper-clipped into the United States. The frequencies of Schumann resonances are fairly stable and are mainly defined by the physical size of the ionospheric cavity.
The amplitude of Schumann resonances does
change and is bigger when ionospheric plasma gets excited. Ionospheric
plasma excitation happens because of solar activity, thunderstorms, use
of scalar plasma weapons and HAARP and lately also when the Light forces
are clearing the plasma anomaly.
Dependencies of Amplitudes Schumann Resonance September 10 2019
Dependencies of Quality Schumann Resonance September 9 2019
Dependencies of Frequency Schumann Resonance September 9 2019
All the SR daily images in one single pageSee the Images
Explanation of The Chart
The Schumann Resonance Spectrogram Chart
The Schumann Resonance Chart displays data from the magnetic field
detector to monitor the resonances occurring in the plasma waves
constantly circling the earth in the ionosphere. These three days
spectrograms show the activity occurring at the various resonant
frequencies from 1 to 40 Hz. Within the spectrogram, the power, or
intensity level of each frequency is displayed as a color, with white
being the most intense. The Schumann Resonances appear as the horizontal
lines at 0.0, 4.0, 8.0, 12.0, 16.0, 20.0, 24.0, 28.0, 32.0, 36.0 &
40.0 Hz. This chart is based on Tomsk, Russia, time UTC +7 (UTC =
Universal Time Coordinated).
What is a Spectrogram?
The Spectrogram Calendar is a visual representation of the range of
frequencies in the magnetic field at a given location. Similar to how an
equalizer displays the frequency content of music played on your
stereo, the spectrogram calendar displays the frequency content of a
magnetic field. Instead of showing a brief snapshot, it shows changes
over a period of time, in this case 3 days.
The local magnetic field is a dynamic field that changes constantly
because of variations in the ionosphere and sun and many other
influences not yet fully understood. The range of variation displayed in
the spectrogram chart is from 0 to 40 cycles per second. The vertical
axis is frequency and the horizontal axis is time. The amplitude of a
particular frequency at a specific time is represented by the intensity
of color (green, yellow, white) of each point in the image.
And
all together, all the voices, all the goals, all the wishes, all the
pains, all the joy, all the good and the evil, all together was the
world.
All together was the river of the becoming, it was the music of life.
Hermann Hesse
Share this: Send the word out using these buttons!