Not only did @JusticeOIG tweet about the release at 1:29pmEST… @TheJusticeDept tweeted AG Barr’s statement about it at 1:29pmEST. Both, of course, the same time as Q’s watch posted a week ago.
DJT: “details of the report are far worse than anything I would have even imagined…This was an attempted overthrow, and a lot of people were in on it and they got caught…I look forward to the Durham Report…he’s got his own info, which is this info plus plus plus.”
The OIG investigation served to get the Spygate plotters to tell their cover story under oath. Allowing any of their false alibis to be easily exposed to criminal prosecution.
CNN: FBI Lying and Spying on President Elect was entirely justified.
American multinational retail corporation Walmart has apologized for its Christmas sweater featuring a wide-eyed Santa Claus sat at a table with lines of cocaine. The sweater was being sold on the company’s Canadian website.
Protesters in France have begun their third day of strikes against President Emmanuel Macron’s attempt to reform the country’s pension system.
5 dead and dozens injured as NZ’s most active volcano erupts on White Island. Images from the White Island Crater Rim camera appear to show people at 2.10pm. The explosions happened shortly after.
A report in the New Zealand Herald says the majority of those injured in the volcano eruption were passengers on the cruise ship Ovation of the Seas, who were visiting White Island during the day.
The Executive Committee of the World Anti-Doping Agency (WADA) has approved recommendations of the Compliance Review Committee (CRC) to strip Russia of the right to participate in major international sports tournaments, including the Olympics and World Championships for the period of four years.
In what’s already being hailed as a defining and explosive “Pentagon papers” moment, a cache of previously classified documents obtained by The Washington Post show top Pentagon leaders continuously lied to the public about the “progress” of the now eighteen-year long Afghan war.
Justice Department Inspector General Michael Horowitz has released his report into the FBI’s investigation of the Trump campaign during the 2016 US election. The report concludes that despite nearly everybody investigating President Trump hating him – and that evidence was fabricated by at least one FBI attorney, and that they misrepresented Christopher Steele’s credentials, none of their bias ‘tainted’ the investigation, and the underlying process was sound. That said, Horowitz faults the FBI for “significant inaccuracies and omissions” in their applications to secretly monitor Trump campaign adviser Carter Page, and agents “failed to meet the basic obligation” to ensure the applications were “scrupulously accurate.”
Active Weather
Tropical Cyclone Belna 80 kts ↑ 960 hPa ↓ Indian Ocean – On W Madagascar Moving SSW
Strongest EQ in Europe M4.8 Italy Strongest EQ in US M3.5 Alaska Strongest EQ on the Planet M5.6 Southwest of Africa Deepest EQ M4.5 573 km PhilippinesNews Burst 10 December 2019
Share this: Send the word out using these buttons!
Editor’s Note: Nice! The Earth emitted several high density and high amplitudes of Schumann Resonance energies. These were followed by additional beams at 12:15am through 1:30am and another from 3:30am until 5am (EST, USA) IS changing our world.
Thanks for sharing this report, accommodate change in our life with LOVE, know your heart, and BE…
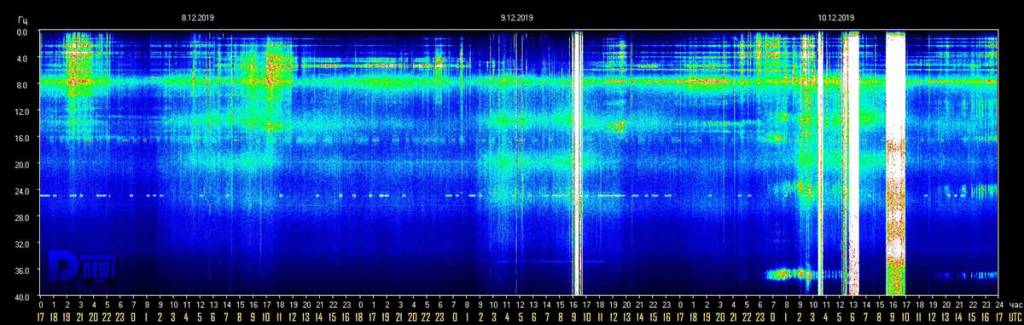
Schumann Resonance Today. We will try to keep you updated about the variations of the Resonance with this page. The great variations that nobody can explain but that give us a clear sign that the planet is changing. The Earth is vibration higher and higher, just like us!
The Chart time is based on Tomsk – Russia – UTC (Universal Time Coordinated) +7Source
RS Base Frequency 7.83 Hz.
Schumann Resonance Today Peaks:
12/10 17:00 UTC – After the umpteenth “Coincidence 17” it has been calm.
12/10 11:30 UTC – Powerful activity once more, even if limited in time. It was calm until just after 3 UTC when a first isolated peak reached Power 54. From 5:30 to 6:30 it was the most intense part with the maximum value at Power 67. The last peak so far is was reached near 17 h on the chart, 10 UTC, and was at P50.
12/9 17:00 UTC – The short but intense period of activity was all for today.
12/9 11:30 UTC – It is no surprise that today this strong peak occurred and reached Power 74, it would have been a surprise if it had been a calm day. This strong series of movements lasted about 50 minutes, from 8:40 to 9:40 UTC, at 9:15 the maximum value.
12/8 17:00 UTC – Calm.
12/8 11:30 UTC – The situation today shows total calm until around 10 UTC when very slight variations in Amplitude started.
12/7 17:00 UTC – Much of today’s activity has been concentrated in the first part of the UTC day, from midnight until 6, where maximum values have been reached. Other slight sporadic variations at P15 also occurred at 10: 30 UTC.
12/7 09:00 UTC – After the record high of yesterday the variations continued sporadically at lower levels, the maximums were around Power 15. From midnight UTC a very active phase started again which kept the Amplitude above Power 50 for about 4 hours, from 1 to 5 UTC; during this period the maximum value achieved was Power 64.
12/6 17:00 UTC – After the incredible Amplitude spike at Power 158 other strong movements continued, the period of activity in which the Amplitude has been above 100 lasted about 1 hour, from 7:45 am to 8:45 UTC. At 10:30 UTC there was a further flicker at Power 28, after which a slight background activity continues.
12/6 10:30 UTC – The today’s graph began in a condition of general calm until 3 am UTC when the variations started. Immediately they reached Power 32 at 4 UTC; the movements continued with less magnitude until 7:45 UTC when some impressive movements started and reached Power 100 in around 15 minutes, at 8 UTC. This, despite the already impressive value, is still not the maximum for today, at 8:30 am the amplitude has further increased and reached an incredible Power 158, the most powerful peak of the last 2 years! In addition to the main and the amplitude graphs, the massive variation can also be seen in the other two charts, the Quality, which shows a value of 25, and that of the frequency of the SR, which shows a value of 8.80.
12/5 17:00 UTC – Calm.
12/4 17:00 UTC – Yesterday we saw a single peak, today the activity was very similar, 2 peaks, one at Power 23 at 21:30 UTC yesterday and another today at Power 19 this morning at 1:30 UTC. For the rest of the day it was calm.
12/3 17:00 UTC – Total calm, the only wriggle at 7 UTC reached Power 13.
12/2 17:00 UTC – Today the activity was not long lasting but very intense, in addition to the previous peak, which marked the beginning of the active period at 8:30 UTC, after a while, at 9 UTC, there was the maximum of today at Power 55, this was followed shortly after by a further movement on the 30s after which, from 10 UTC, the calm returned. Still, another movement around 17 hours of the graph.
12/2 09:30 UTC – Today’s chart shows once again a stato of calm, the last significant peak at Power 20 was Nov. 30 at 19 UTC so it took about 36 hours before the amplitude values returned above P10. Today, however, it’s back, the peak was at Power 37 8:30 UTC.
12/1 17:00 UTC – A single peak isolated at Power 25 in the first part of today’s chart and then calm.
11/29 17:00 UTC – Today the only thing to report is that there have been no problems with data transmission, calm throughout the day.
11/29 17:00 UTC – As we can see from today’s chart, the lack of yesterday’s update was not due to the lack of data but apparently a combination of problems with the site and the detection apparatus. The new graph shows mainly calm apart from a very strong isolated peak at Power 58 at 6 UTC.
11/29 10:30 UTC – As we can see from today’s chart, the lack of yesterday’s update was not due to missing data but apparently a combination of problems with the site and the detection apparatus. The new graph shows mainly calm apart from a very strong isolated peak at Power 58 at 6 UTC.
11/28 17:00 UTC – Little to report except that the source image in the afternoon stopped at 13 UTC.
11/28 09:30 UTC – Today’s chart shows a condition of calm, a single light and isolated movement around 23 UTC yesterday brought the amplitude at Power 12.
11/27 17:00 UTC – Today’s activity occurred during the period from 2 to 10 UTC, eight hours that could be divided into two parts, the first 4 hours that led to a peak of 31 as described previously, and the second four hours, more intense, which led to a peak of Power 34 (17 x 2 for the most tenacious) just minutes before the 17 of the chart, 10 UTC.
11/27 08:30 UTC – The graphics are available again after a brief period of “blockage” of the TSU site. We can see that yesterday there has been no significant activity. Today, on the other hand, a new series of movements has begun, the first variations in amplitude started at 2 UTC, reaching values around Power 20 within 30 minutes, at 5 UTC there was the maximum value so far, Power 31. The activity is still ongoing.
11/26 17:00 UTC – The day started with a calm condition that lasted until 7 UTC when the first slight fluctuations occurred. Then there was a first ‘hole’ of lack of data, then another one and a last that is still going. Maximum reported today was Power 20.
11/25 17:00 UTC – Today was a day of total calm, only two isolated movements broke the flatness, one at Power 17 and one at 20 occurred at around 9 UTC.
11/24 23:00 UTC – If you look carefully to the main chart you can se a peculiar white “Pillar” ending exactly at 17, the time zone of the station. Coincidence? Schumann Resonance is parte of the QMap as you can see in the image below. Seems like “you are here”. Larger QMap.
11/24 17:00 UTC – Today’s activity lasted 9 hours, from 1 to 10 UTC, the maximum amplitude peak was Power 68 at 7 UTC and since than, for about 3 hours, there were strong variations that repeatedly exceeded the P60 thresholds.
11/24 09:00 UTC – As you can see in the graph of the of the last 3 days the increase in the power of the variations has always been constant, one day after another. On the 22nd, during the activity phase, we got to Power 30, on the 23rd it was P57 and today, for now, we are at Power 68. Today’s activity started at 1 UTC, after about 6 hours of calm, the first maximum reached briefly time P35 to reach P50, around 4 UTC, and the maximum Power 68 just before 7 UTC.
11/23 17:00 UTC – What started at 3 am UTC this morning is a period of intense activity that is still in progress and that for a period of 12 hours maintained the amplitude values on the Power 25 average. Today’s peak reached Power 57 at 14:30 UTC.
11/23 11:00 UTC – The period of calm lasted about 14 hours, it was interrupted today at 3 UTC when quite significant variations began which, within two hours, brought the amplitude values between Power 25 and 30. Remaining constantly on those values, at 8 am UTC, we had what so far has been the maximum peak at Power 41. The activity is continuing.
11/22 17:00 UTC – In the early part of today we had the most significant activity, from 4 to 10 UTC a series of peaks on the 20 with the maximum at P25 just after 10 UTC.
11/22 11:00 UTC – The activity started yesterday is continuing but at lower values, today the significant part began at 4 UTC and remained on Power 20 threshold since than with a peak Power 25 at 10 UTC.
11/21 17:00 UTC – From this morning to 5 UTC since this period of activity began, there has been a constant increase in the maximum values reached, Power 33 was reached at 14 UTC. Right now we are around Power 15.
11/21 11:00 UTC – After 3 days of calm today we are seeing new activity, from 5 UTC there have been some variations initially at Power 20 and at 10 UTC at the peak until now at Power 23.
11/20 17:00 UTC – Third day of total calm.
11/19 17:00 UTC – Calm.
11/18 17:00 UTC – Today we returned to a condition of very light activity, there were only two movements that exceeded Power 10, 16 at 6 UTC and 11 at 11 UTC.
11/17 17:00 UTC – The strong activity, that seems to have ended at 9 UTC today, lasted 20 hours. The highest peaks occurred in its initial part which took place yesterday, today the highest value was Power 30 as previously reported.
11/17 09:00 UTC – Today is the 17th, lately a day of recurring SR activity, and the movements started yesterday continued uninterrupted, the peaks are not at very high values, Power 37 was reached at 00 UTC today, but the values remained constantly around Power 30.
11/16 23:00 UTC – The strong activity continued but with slightly less intensity, this period of strong variations started at 6 UTC and has been above Power 40 for 2 hours, from 15 to 17 UTC. At this time the maximum values are around Power 30.
11/16 17:00 UTC – Today’s chart shows an initial long period of flat calm until 1 UTC when very light movements have brought the variations to reach Power 10 at 9 UTC. From here the movements started to become more consistent up to starting a strong activity period from 13 UTC during which the today’s maximum value of Power 46 was reached. It seems that the movements should also continue in the new chart of Nov. 17th.
11/15 17:00 UTC – The movements continued and grew steadily until 10 UTC when it reached today’s high at Power 22 to returned to normal values just after.
11/15 09:00 UTC – Shortly after midnight local time from the graph, corresponding to 17 UTC, we saw a slow and gradual increase in amplitude values that reached Power 17 at 8 UTC. It seems that the activity should continue.
11/14 17:00 UTC – Virtually calm, only a few slight movements between 3 and 5 UTC with a maximum of Power 13.
11/13 17:00 UTC – Calm.
11/13 15:00 UTC – The first part of today’s chart day shows absolute calm, from 1 UTC there are very light movements that have given way to the light activity of today that lasted for the central part of today’s chart. During this phase there were 3 peaks that exceeded 20 and others that touched it, Power 24 was reached at around 6 UTC.
11/12 17:00 UTC – Today’s activity took place over a period of 9 hours, from 3 to 12 UTC, the most intense part with the maximum value of today as reported previously was from 5 to 8 UTC. The situation is now shown to be calm.
11/12 08:00 UTC – After several days of intense calm we come to a new series of movements characterized by rather significant peaks. The changes started suddenly at 3 UTC and in the span of four hours, at 7 UTC, there was the strongest peak so far at Power 48.
11/11 17:00 UTC – Today was mostly calm, the only variations with a maximum of Power 14 occurred from 7:30 to 9:30 UTC.
11/10 17:00 UTC – Calm.
11/10 11:00 UTC – Not much to say, compared to the calm we see only the “streaks” on the Power 10.
11/9 17:00 UTC – The series of light movements continued without interruption, a slight drop to values close to calm took place in the last hours.
11/9 11:30 UTC – In this first part of the day the movements continued, increasing numerically but with less powerful amplitude variations whose maximum was Power 25 at 2:30 UTC.
11/8 17:00 UTC – The series of most significant movements of today lasted about eight hours, from 3 to 11 UTC with the peaks previously reported, this period has been followed by more slight movements.
11/8 10:30 UTC – From today’s image, we can see how in the last three days there has been a sort of sequence of movements characterized by a constant increasing trend, will this coincidentally reach its maximum on 11 November? The significant peaks of today started at 3, at 6 UTC reached 35 and just before 10 the maximum value of these last 3 days, Power 43.
11/7 17:00 UTC – Slight movements have continued throughout the day, the highest peak is the one reported previously but shortly after 9 UTC we can see another variation that has reached Power 27.
11/7 09:00 UTC – The graph in the first part of today shows how the constant slight movement that began yesterday is continuing. Today we have had the strongest peak of these last 3 days and reached Power 32 at 3 UTC.
11/6 17:00 UTC – After a couple of days of relative calm today, shortly after midnight UTC, movements began again which gradually brought the current peak value of Power 23 to 9:30 UTC. Activity has not stopped but has continued and at present it seems to see a crescendo that will lead to higher values.
11/5 17:00 UTC – Today’s activity is very similar to that of yesterday, slight movements from 1 to 8 UTC with the maximum value reached of Power 12.
11/4 17:00 UTC – Today the calm has been almost total, very slight variations have reached Power 15 between 6 and 10 UTC.
11/3 17:00 UTC – During the last 24 hours reported in the chart there were only 3 significant short-term events, the first happened at 19 UTC of yesterday at Power 25, the second movement, which lasted about 2 hours, reached today’s maximum of Power 32 at 6:30 UTC and the last at 10 UTC at 23.
11/2 17:00 UTC – We could recap today activity with how long the amplitude remained above 40: 6 hours, from 3 to 9 UTC. Today’s maximum is Power 98 as previously reported. From 11 UTC the values are back to normal.
11/2 09:30 UTC – The strong activity that we see in progress at this time started decisively at the turn of the local midnight, corresponding to 17 UTC. Initially with peaks at Power 20, within two hours it reached 30 around 19 UTC. These first movements were followed by a period during which the amplitude was constantly oscillating between 10 and 20. At 1 UTC today, the very powerful activity began, bringing the amplitude close to Power 100. The maximum of Power 98 was reached at 5:30 UTC.
11/1 17:00 UTC – The situation shows the continuation of the variations also in this second part of the day where the greatest peak of today was had at Power 21.
11/1 12:30 UTC – The new chart shows slight movements around midnight UTC that have reached Power 18, for the rest just ‘background’ movements around 10.
Frequency means how many wave cycle happen in a second, 1 Hz. means 1 cycle per second, 40 Hz. means 40 cycles per second, Amplitude is the size of the vibration, how big is the wave, the chart shows the frequency variation in Hz and the amplitude using the white color.
Note
The Ancient Indian Rishis called 7.83 Hz the frequency of OM. It also happens to be Mother Earth’s natural heartbeat rhythmSchumann resonances are named after professor Schumann who was involved in early German secret space program and was later paper-clipped into the United States. The frequencies of Schumann resonances are fairly stable and are mainly defined by the physical size of the ionospheric cavity. The amplitude of Schumann resonances does change and is bigger when ionospheric plasma gets excited. Ionospheric plasma excitation happens because of solar activity, thunderstorms, use of scalar plasma weapons and HAARP and lately also when the Light forces are clearing the plasma anomaly.
Dependencies of Amplitudes Schumann Resonance December 10 2019
Dependencies of Quality Schumann Resonance December 10 2019
Dependencies of Frequency Schumann Resonance December 10 2019
All the SR daily images in one single pageSee the Images
Explanation of The Chart
The Schumann Resonance Spectrogram Chart
The Schumann Resonance Chart displays data from the magnetic field detector to monitor the resonances occurring in the plasma waves constantly circling the earth in the ionosphere. These three days spectrograms show the activity occurring at the various resonant frequencies from 1 to 40 Hz. Within the spectrogram, the power, or intensity level of each frequency is displayed as a color, with white being the most intense. The Schumann Resonances appear as the horizontal lines at 0.0, 4.0, 8.0, 12.0, 16.0, 20.0, 24.0, 28.0, 32.0, 36.0 & 40.0 Hz. This chart is based on Tomsk, Russia, time UTC +7 (UTC = Universal Time Coordinated).
What is a Spectrogram?
The Spectrogram Calendar is a visual representation of the range of frequencies in the magnetic field at a given location. Similar to how an equalizer displays the frequency content of music played on your stereo, the spectrogram calendar displays the frequency content of a magnetic field. Instead of showing a brief snapshot, it shows changes over a period of time, in this case 3 days.
The local magnetic field is a dynamic field that changes constantly because of variations in the ionosphere and sun and many other influences not yet fully understood. The range of variation displayed in the spectrogram chart is from 0 to 40 cycles per second. The vertical axis is frequency and the horizontal axis is time. The amplitude of a particular frequency at a specific time is represented by the intensity of color (green, yellow, white) of each point in the image.
Editor’s Note: The chart above shows a calm, essentially “no pattern” for the Schumann Resonance energies with the exception of an extremely dense and high amplitude spike for 50 minutes between 4am and 5am (EST, USA) on 12/9. Perhaps this is why I woke at 4am this morning!
Please keep a watch on the Schumann Resonance energies, know how these affect your life, watch the world change, and BE…
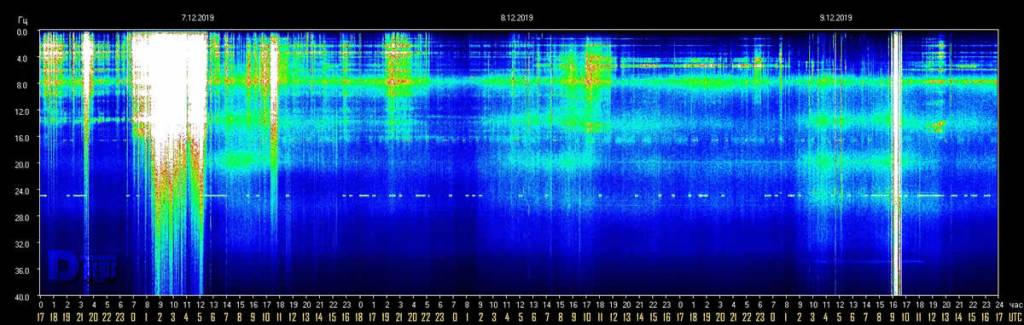
Schumann Resonance Today. We will try to keep you updated about the variations of the Resonance with this page. The great variations that nobody can explain but that give us a clear sign that the planet is changing. The Earth is vibration higher and higher, just like us!
The Chart time is based on Tomsk – Russia – UTC (Universal Time Coordinated) +7Source
RS Base Frequency 7.83 Hz.
Schumann Resonance Today Peaks:
12/9 17:00 UTC – The short but intense period of activity was all for today.
12/9 11:30 UTC – It is no surprise that today this strong peak occurred and reached Power 74, it would have been a surprise if it had been a calm day. This strong series of movements lasted about 50 minutes, from 8:40 to 9:40 UTC, at 9:15 the maximum value.
12/8 17:00 UTC – Calm.
12/8 11:30 UTC – The situation today shows total calm until around 10 UTC when very slight variations in Amplitude started.
12/7 17:00 UTC – Much of today’s activity has been concentrated in the first part of the UTC day, from midnight until 6, where maximum values have been reached. Other slight sporadic variations at P15 also occurred at 10: 30 UTC.
12/7 09:00 UTC – After the record high of yesterday the variations continued sporadically at lower levels, the maximums were around Power 15. From midnight UTC a very active phase started again which kept the Amplitude above Power 50 for about 4 hours, from 1 to 5 UTC; during this period the maximum value achieved was Power 64.
12/6 17:00 UTC – After the incredible Amplitude spike at Power 158 other strong movements continued, the period of activity in which the Amplitude has been above 100 lasted about 1 hour, from 7:45 am to 8:45 UTC. At 10:30 UTC there was a further flicker at Power 28, after which a slight background activity continues.
12/6 10:30 UTC – The today’s graph began in a condition of general calm until 3 am UTC when the variations started. Immediately they reached Power 32 at 4 UTC; the movements continued with less magnitude until 7:45 UTC when some impressive movements started and reached Power 100 in around 15 minutes, at 8 UTC. This, despite the already impressive value, is still not the maximum for today, at 8:30 am the amplitude has further increased and reached an incredible Power 158, the most powerful peak of the last 2 years! In addition to the main and the amplitude graphs, the massive variation can also be seen in the other two charts, the Quality, which shows a value of 25, and that of the frequency of the SR, which shows a value of 8.80.
12/5 17:00 UTC – Calm.
12/4 17:00 UTC – Yesterday we saw a single peak, today the activity was very similar, 2 peaks, one at Power 23 at 21:30 UTC yesterday and another today at Power 19 this morning at 1:30 UTC. For the rest of the day it was calm.
12/3 17:00 UTC – Total calm, the only wriggle at 7 UTC reached Power 13.
12/2 17:00 UTC – Today the activity was not long lasting but very intense, in addition to the previous peak, which marked the beginning of the active period at 8:30 UTC, after a while, at 9 UTC, there was the maximum of today at Power 55, this was followed shortly after by a further movement on the 30s after which, from 10 UTC, the calm returned. Still, another movement around 17 hours of the graph.
12/2 09:30 UTC – Today’s chart shows once again a stato of calm, the last significant peak at Power 20 was Nov. 30 at 19 UTC so it took about 36 hours before the amplitude values returned above P10. Today, however, it’s back, the peak was at Power 37 8:30 UTC.
12/1 17:00 UTC – A single peak isolated at Power 25 in the first part of today’s chart and then calm.
11/29 17:00 UTC – Today the only thing to report is that there have been no problems with data transmission, calm throughout the day.
11/29 17:00 UTC – As we can see from today’s chart, the lack of yesterday’s update was not due to the lack of data but apparently a combination of problems with the site and the detection apparatus. The new graph shows mainly calm apart from a very strong isolated peak at Power 58 at 6 UTC.
11/29 10:30 UTC – As we can see from today’s chart, the lack of yesterday’s update was not due to missing data but apparently a combination of problems with the site and the detection apparatus. The new graph shows mainly calm apart from a very strong isolated peak at Power 58 at 6 UTC.
11/28 17:00 UTC – Little to report except that the source image in the afternoon stopped at 13 UTC.
11/28 09:30 UTC – Today’s chart shows a condition of calm, a single light and isolated movement around 23 UTC yesterday brought the amplitude at Power 12.
11/27 17:00 UTC – Today’s activity occurred during the period from 2 to 10 UTC, eight hours that could be divided into two parts, the first 4 hours that led to a peak of 31 as described previously, and the second four hours, more intense, which led to a peak of Power 34 (17 x 2 for the most tenacious) just minutes before the 17 of the chart, 10 UTC.
11/27 08:30 UTC – The graphics are available again after a brief period of “blockage” of the TSU site. We can see that yesterday there has been no significant activity. Today, on the other hand, a new series of movements has begun, the first variations in amplitude started at 2 UTC, reaching values around Power 20 within 30 minutes, at 5 UTC there was the maximum value so far, Power 31. The activity is still ongoing.
11/26 17:00 UTC – The day started with a calm condition that lasted until 7 UTC when the first slight fluctuations occurred. Then there was a first ‘hole’ of lack of data, then another one and a last that is still going. Maximum reported today was Power 20.
11/25 17:00 UTC – Today was a day of total calm, only two isolated movements broke the flatness, one at Power 17 and one at 20 occurred at around 9 UTC.
11/24 23:00 UTC – If you look carefully to the main chart you can se a peculiar white “Pillar” ending exactly at 17, the time zone of the station. Coincidence? Schumann Resonance is parte of the QMap as you can see in the image below. Seems like “you are here”. Larger QMap.
11/24 17:00 UTC – Today’s activity lasted 9 hours, from 1 to 10 UTC, the maximum amplitude peak was Power 68 at 7 UTC and since than, for about 3 hours, there were strong variations that repeatedly exceeded the P60 thresholds.
11/24 09:00 UTC – As you can see in the graph of the of the last 3 days the increase in the power of the variations has always been constant, one day after another. On the 22nd, during the activity phase, we got to Power 30, on the 23rd it was P57 and today, for now, we are at Power 68. Today’s activity started at 1 UTC, after about 6 hours of calm, the first maximum reached briefly time P35 to reach P50, around 4 UTC, and the maximum Power 68 just before 7 UTC.
11/23 17:00 UTC – What started at 3 am UTC this morning is a period of intense activity that is still in progress and that for a period of 12 hours maintained the amplitude values on the Power 25 average. Today’s peak reached Power 57 at 14:30 UTC.
11/23 11:00 UTC – The period of calm lasted about 14 hours, it was interrupted today at 3 UTC when quite significant variations began which, within two hours, brought the amplitude values between Power 25 and 30. Remaining constantly on those values, at 8 am UTC, we had what so far has been the maximum peak at Power 41. The activity is continuing.
11/22 17:00 UTC – In the early part of today we had the most significant activity, from 4 to 10 UTC a series of peaks on the 20 with the maximum at P25 just after 10 UTC.
11/22 11:00 UTC – The activity started yesterday is continuing but at lower values, today the significant part began at 4 UTC and remained on Power 20 threshold since than with a peak Power 25 at 10 UTC.
11/21 17:00 UTC – From this morning to 5 UTC since this period of activity began, there has been a constant increase in the maximum values reached, Power 33 was reached at 14 UTC. Right now we are around Power 15.
11/21 11:00 UTC – After 3 days of calm today we are seeing new activity, from 5 UTC there have been some variations initially at Power 20 and at 10 UTC at the peak until now at Power 23.
11/20 17:00 UTC – Third day of total calm.
11/19 17:00 UTC – Calm.
11/18 17:00 UTC – Today we returned to a condition of very light activity, there were only two movements that exceeded Power 10, 16 at 6 UTC and 11 at 11 UTC.
11/17 17:00 UTC – The strong activity, that seems to have ended at 9 UTC today, lasted 20 hours. The highest peaks occurred in its initial part which took place yesterday, today the highest value was Power 30 as previously reported.
11/17 09:00 UTC – Today is the 17th, lately a day of recurring SR activity, and the movements started yesterday continued uninterrupted, the peaks are not at very high values, Power 37 was reached at 00 UTC today, but the values remained constantly around Power 30.
11/16 23:00 UTC – The strong activity continued but with slightly less intensity, this period of strong variations started at 6 UTC and has been above Power 40 for 2 hours, from 15 to 17 UTC. At this time the maximum values are around Power 30.
11/16 17:00 UTC – Today’s chart shows an initial long period of flat calm until 1 UTC when very light movements have brought the variations to reach Power 10 at 9 UTC. From here the movements started to become more consistent up to starting a strong activity period from 13 UTC during which the today’s maximum value of Power 46 was reached. It seems that the movements should also continue in the new chart of Nov. 17th.
11/15 17:00 UTC – The movements continued and grew steadily until 10 UTC when it reached today’s high at Power 22 to returned to normal values just after.
11/15 09:00 UTC – Shortly after midnight local time from the graph, corresponding to 17 UTC, we saw a slow and gradual increase in amplitude values that reached Power 17 at 8 UTC. It seems that the activity should continue.
11/14 17:00 UTC – Virtually calm, only a few slight movements between 3 and 5 UTC with a maximum of Power 13.
11/13 17:00 UTC – Calm.
11/13 15:00 UTC – The first part of today’s chart day shows absolute calm, from 1 UTC there are very light movements that have given way to the light activity of today that lasted for the central part of today’s chart. During this phase there were 3 peaks that exceeded 20 and others that touched it, Power 24 was reached at around 6 UTC.
11/12 17:00 UTC – Today’s activity took place over a period of 9 hours, from 3 to 12 UTC, the most intense part with the maximum value of today as reported previously was from 5 to 8 UTC. The situation is now shown to be calm.
11/12 08:00 UTC – After several days of intense calm we come to a new series of movements characterized by rather significant peaks. The changes started suddenly at 3 UTC and in the span of four hours, at 7 UTC, there was the strongest peak so far at Power 48.
11/11 17:00 UTC – Today was mostly calm, the only variations with a maximum of Power 14 occurred from 7:30 to 9:30 UTC.
11/10 17:00 UTC – Calm.
11/10 11:00 UTC – Not much to say, compared to the calm we see only the “streaks” on the Power 10.
11/9 17:00 UTC – The series of light movements continued without interruption, a slight drop to values close to calm took place in the last hours.
11/9 11:30 UTC – In this first part of the day the movements continued, increasing numerically but with less powerful amplitude variations whose maximum was Power 25 at 2:30 UTC.
11/8 17:00 UTC – The series of most significant movements of today lasted about eight hours, from 3 to 11 UTC with the peaks previously reported, this period has been followed by more slight movements.
11/8 10:30 UTC – From today’s image, we can see how in the last three days there has been a sort of sequence of movements characterized by a constant increasing trend, will this coincidentally reach its maximum on 11 November? The significant peaks of today started at 3, at 6 UTC reached 35 and just before 10 the maximum value of these last 3 days, Power 43.
11/7 17:00 UTC – Slight movements have continued throughout the day, the highest peak is the one reported previously but shortly after 9 UTC we can see another variation that has reached Power 27.
11/7 09:00 UTC – The graph in the first part of today shows how the constant slight movement that began yesterday is continuing. Today we have had the strongest peak of these last 3 days and reached Power 32 at 3 UTC.
11/6 17:00 UTC – After a couple of days of relative calm today, shortly after midnight UTC, movements began again which gradually brought the current peak value of Power 23 to 9:30 UTC. Activity has not stopped but has continued and at present it seems to see a crescendo that will lead to higher values.
11/5 17:00 UTC – Today’s activity is very similar to that of yesterday, slight movements from 1 to 8 UTC with the maximum value reached of Power 12.
11/4 17:00 UTC – Today the calm has been almost total, very slight variations have reached Power 15 between 6 and 10 UTC.
11/3 17:00 UTC – During the last 24 hours reported in the chart there were only 3 significant short-term events, the first happened at 19 UTC of yesterday at Power 25, the second movement, which lasted about 2 hours, reached today’s maximum of Power 32 at 6:30 UTC and the last at 10 UTC at 23.
11/2 17:00 UTC – We could recap today activity with how long the amplitude remained above 40: 6 hours, from 3 to 9 UTC. Today’s maximum is Power 98 as previously reported. From 11 UTC the values are back to normal.
11/2 09:30 UTC – The strong activity that we see in progress at this time started decisively at the turn of the local midnight, corresponding to 17 UTC. Initially with peaks at Power 20, within two hours it reached 30 around 19 UTC. These first movements were followed by a period during which the amplitude was constantly oscillating between 10 and 20. At 1 UTC today, the very powerful activity began, bringing the amplitude close to Power 100. The maximum of Power 98 was reached at 5:30 UTC.
11/1 17:00 UTC – The situation shows the continuation of the variations also in this second part of the day where the greatest peak of today was had at Power 21.
11/1 12:30 UTC – The new chart shows slight movements around midnight UTC that have reached Power 18, for the rest just ‘background’ movements around 10.
Frequency means how many wave cycle happen in a second, 1 Hz. means 1 cycle per second, 40 Hz. means 40 cycles per second, Amplitude is the size of the vibration, how big is the wave, the chart shows the frequency variation in Hz and the amplitude using the white color.
Note
The Ancient Indian Rishis called 7.83 Hz the frequency of OM. It also happens to be Mother Earth’s natural heartbeat rhythmSchumann resonances are named after professor Schumann who was involved in early German secret space program and was later paper-clipped into the United States. The frequencies of Schumann resonances are fairly stable and are mainly defined by the physical size of the ionospheric cavity. The amplitude of Schumann resonances does change and is bigger when ionospheric plasma gets excited. Ionospheric plasma excitation happens because of solar activity, thunderstorms, use of scalar plasma weapons and HAARP and lately also when the Light forces are clearing the plasma anomaly.
Dependencies of Amplitudes Schumann Resonance December 9 2019
Dependencies of Quality Schumann Resonance December 9 2019
Dependencies of Frequency Schumann Resonance December 9 2019
All the SR daily images in one single pageSee the Images
Explanation of The Chart
The Schumann Resonance Spectrogram Chart
The Schumann Resonance Chart displays data from the magnetic field detector to monitor the resonances occurring in the plasma waves constantly circling the earth in the ionosphere. These three days spectrograms show the activity occurring at the various resonant frequencies from 1 to 40 Hz. Within the spectrogram, the power, or intensity level of each frequency is displayed as a color, with white being the most intense. The Schumann Resonances appear as the horizontal lines at 0.0, 4.0, 8.0, 12.0, 16.0, 20.0, 24.0, 28.0, 32.0, 36.0 & 40.0 Hz. This chart is based on Tomsk, Russia, time UTC +7 (UTC = Universal Time Coordinated).
What is a Spectrogram?
The Spectrogram Calendar is a visual representation of the range of frequencies in the magnetic field at a given location. Similar to how an equalizer displays the frequency content of music played on your stereo, the spectrogram calendar displays the frequency content of a magnetic field. Instead of showing a brief snapshot, it shows changes over a period of time, in this case 3 days.
The local magnetic field is a dynamic field that changes constantly because of variations in the ionosphere and sun and many other influences not yet fully understood. The range of variation displayed in the spectrogram chart is from 0 to 40 cycles per second. The vertical axis is frequency and the horizontal axis is time. The amplitude of a particular frequency at a specific time is represented by the intensity of color (green, yellow, white) of each point in the image.
Returning violence for violence multiplies violence, adding deeper darkness to a night already devoid of stars. Darkness cannot drive out darkness: only love can do that.
Martin Luther King
Share this: Send the word out using these buttons!
Editor’s Note: The Schumann Resonance graph remains quiet during this date of 12/8. Thanks for keeping aware of how these energies may appear from the Earth as she responds to receiving incoming cosmic energies herself…kind of like ringing a bell!
Stay aware as our world changes, stay safe as chaos continues ,and BE…
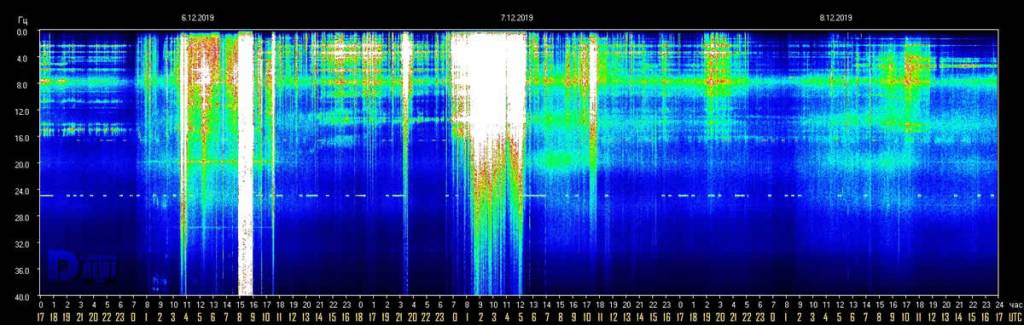
Schumann Resonance Today. We will try to keep you updated about the variations of the Resonance with this page. The great variations that nobody can explain but that give us a clear sign that the planet is changing. The Earth is vibration higher and higher, just like us!
The Chart time is based on Tomsk – Russia – UTC (Universal Time Coordinated) +7Source
RS Base Frequency 7.83 Hz.
Schumann Resonance Today Peaks:
12/8 17:00 UTC – Calm.
12/8 11:30 UTC – The situation today shows total calm until around 10 UTC when very slight variations in Amplitude started.
12/7 17:00 UTC – Much of today’s activity has been concentrated in the first part of the UTC day, from midnight until 6, where maximum values have been reached. Other slight sporadic variations at P15 also occurred at 10: 30 UTC.
12/7 09:00 UTC – After the record high of yesterday the variations continued sporadically at lower levels, the maximums were around Power 15. From midnight UTC a very active phase started again which kept the Amplitude above Power 50 for about 4 hours, from 1 to 5 UTC; during this period the maximum value achieved was Power 64.
12/6 17:00 UTC – After the incredible Amplitude spike at Power 158 other strong movements continued, the period of activity in which the Amplitude has been above 100 lasted about 1 hour, from 7:45 am to 8:45 UTC. At 10:30 UTC there was a further flicker at Power 28, after which a slight background activity continues.
12/6 10:30 UTC – The today’s graph began in a condition of general calm until 3 am UTC when the variations started. Immediately they reached Power 32 at 4 UTC; the movements continued with less magnitude until 7:45 UTC when some impressive movements started and reached Power 100 in around 15 minutes, at 8 UTC. This, despite the already impressive value, is still not the maximum for today, at 8:30 am the amplitude has further increased and reached an incredible Power 158, the most powerful peak of the last 2 years! In addition to the main and the amplitude graphs, the massive variation can also be seen in the other two charts, the Quality, which shows a value of 25, and that of the frequency of the SR, which shows a value of 8.80.
12/5 17:00 UTC – Calm.
12/4 17:00 UTC – Yesterday we saw a single peak, today the activity was very similar, 2 peaks, one at Power 23 at 21:30 UTC yesterday and another today at Power 19 this morning at 1:30 UTC. For the rest of the day it was calm.
12/3 17:00 UTC – Total calm, the only wriggle at 7 UTC reached Power 13.
12/2 17:00 UTC – Today the activity was not long lasting but very intense, in addition to the previous peak, which marked the beginning of the active period at 8:30 UTC, after a while, at 9 UTC, there was the maximum of today at Power 55, this was followed shortly after by a further movement on the 30s after which, from 10 UTC, the calm returned. Still, another movement around 17 hours of the graph.
12/2 09:30 UTC – Today’s chart shows once again a stato of calm, the last significant peak at Power 20 was Nov. 30 at 19 UTC so it took about 36 hours before the amplitude values returned above P10. Today, however, it’s back, the peak was at Power 37 8:30 UTC.
12/1 17:00 UTC – A single peak isolated at Power 25 in the first part of today’s chart and then calm.
11/29 17:00 UTC – Today the only thing to report is that there have been no problems with data transmission, calm throughout the day.
11/29 17:00 UTC – As we can see from today’s chart, the lack of yesterday’s update was not due to the lack of data but apparently a combination of problems with the site and the detection apparatus. The new graph shows mainly calm apart from a very strong isolated peak at Power 58 at 6 UTC.
11/29 10:30 UTC – As we can see from today’s chart, the lack of yesterday’s update was not due to missing data but apparently a combination of problems with the site and the detection apparatus. The new graph shows mainly calm apart from a very strong isolated peak at Power 58 at 6 UTC.
11/28 17:00 UTC – Little to report except that the source image in the afternoon stopped at 13 UTC.
11/28 09:30 UTC – Today’s chart shows a condition of calm, a single light and isolated movement around 23 UTC yesterday brought the amplitude at Power 12.
11/27 17:00 UTC – Today’s activity occurred during the period from 2 to 10 UTC, eight hours that could be divided into two parts, the first 4 hours that led to a peak of 31 as described previously, and the second four hours, more intense, which led to a peak of Power 34 (17 x 2 for the most tenacious) just minutes before the 17 of the chart, 10 UTC.
11/27 08:30 UTC – The graphics are available again after a brief period of “blockage” of the TSU site. We can see that yesterday there has been no significant activity. Today, on the other hand, a new series of movements has begun, the first variations in amplitude started at 2 UTC, reaching values around Power 20 within 30 minutes, at 5 UTC there was the maximum value so far, Power 31. The activity is still ongoing.
11/26 17:00 UTC – The day started with a calm condition that lasted until 7 UTC when the first slight fluctuations occurred. Then there was a first ‘hole’ of lack of data, then another one and a last that is still going. Maximum reported today was Power 20.
11/25 17:00 UTC – Today was a day of total calm, only two isolated movements broke the flatness, one at Power 17 and one at 20 occurred at around 9 UTC.
11/24 23:00 UTC – If you look carefully to the main chart you can se a peculiar white “Pillar” ending exactly at 17, the time zone of the station. Coincidence? Schumann Resonance is parte of the QMap as you can see in the image below. Seems like “you are here”. Larger QMap.
11/24 17:00 UTC – Today’s activity lasted 9 hours, from 1 to 10 UTC, the maximum amplitude peak was Power 68 at 7 UTC and since than, for about 3 hours, there were strong variations that repeatedly exceeded the P60 thresholds.
11/24 09:00 UTC – As you can see in the graph of the of the last 3 days the increase in the power of the variations has always been constant, one day after another. On the 22nd, during the activity phase, we got to Power 30, on the 23rd it was P57 and today, for now, we are at Power 68. Today’s activity started at 1 UTC, after about 6 hours of calm, the first maximum reached briefly time P35 to reach P50, around 4 UTC, and the maximum Power 68 just before 7 UTC.
11/23 17:00 UTC – What started at 3 am UTC this morning is a period of intense activity that is still in progress and that for a period of 12 hours maintained the amplitude values on the Power 25 average. Today’s peak reached Power 57 at 14:30 UTC.
11/23 11:00 UTC – The period of calm lasted about 14 hours, it was interrupted today at 3 UTC when quite significant variations began which, within two hours, brought the amplitude values between Power 25 and 30. Remaining constantly on those values, at 8 am UTC, we had what so far has been the maximum peak at Power 41. The activity is continuing.
11/22 17:00 UTC – In the early part of today we had the most significant activity, from 4 to 10 UTC a series of peaks on the 20 with the maximum at P25 just after 10 UTC.
11/22 11:00 UTC – The activity started yesterday is continuing but at lower values, today the significant part began at 4 UTC and remained on Power 20 threshold since than with a peak Power 25 at 10 UTC.
11/21 17:00 UTC – From this morning to 5 UTC since this period of activity began, there has been a constant increase in the maximum values reached, Power 33 was reached at 14 UTC. Right now we are around Power 15.
11/21 11:00 UTC – After 3 days of calm today we are seeing new activity, from 5 UTC there have been some variations initially at Power 20 and at 10 UTC at the peak until now at Power 23.
11/20 17:00 UTC – Third day of total calm.
11/19 17:00 UTC – Calm.
11/18 17:00 UTC – Today we returned to a condition of very light activity, there were only two movements that exceeded Power 10, 16 at 6 UTC and 11 at 11 UTC.
11/17 17:00 UTC – The strong activity, that seems to have ended at 9 UTC today, lasted 20 hours. The highest peaks occurred in its initial part which took place yesterday, today the highest value was Power 30 as previously reported.
11/17 09:00 UTC – Today is the 17th, lately a day of recurring SR activity, and the movements started yesterday continued uninterrupted, the peaks are not at very high values, Power 37 was reached at 00 UTC today, but the values remained constantly around Power 30.
11/16 23:00 UTC – The strong activity continued but with slightly less intensity, this period of strong variations started at 6 UTC and has been above Power 40 for 2 hours, from 15 to 17 UTC. At this time the maximum values are around Power 30.
11/16 17:00 UTC – Today’s chart shows an initial long period of flat calm until 1 UTC when very light movements have brought the variations to reach Power 10 at 9 UTC. From here the movements started to become more consistent up to starting a strong activity period from 13 UTC during which the today’s maximum value of Power 46 was reached. It seems that the movements should also continue in the new chart of Nov. 17th.
11/15 17:00 UTC – The movements continued and grew steadily until 10 UTC when it reached today’s high at Power 22 to returned to normal values just after.
11/15 09:00 UTC – Shortly after midnight local time from the graph, corresponding to 17 UTC, we saw a slow and gradual increase in amplitude values that reached Power 17 at 8 UTC. It seems that the activity should continue.
11/14 17:00 UTC – Virtually calm, only a few slight movements between 3 and 5 UTC with a maximum of Power 13.
11/13 17:00 UTC – Calm.
11/13 15:00 UTC – The first part of today’s chart day shows absolute calm, from 1 UTC there are very light movements that have given way to the light activity of today that lasted for the central part of today’s chart. During this phase there were 3 peaks that exceeded 20 and others that touched it, Power 24 was reached at around 6 UTC.
11/12 17:00 UTC – Today’s activity took place over a period of 9 hours, from 3 to 12 UTC, the most intense part with the maximum value of today as reported previously was from 5 to 8 UTC. The situation is now shown to be calm.
11/12 08:00 UTC – After several days of intense calm we come to a new series of movements characterized by rather significant peaks. The changes started suddenly at 3 UTC and in the span of four hours, at 7 UTC, there was the strongest peak so far at Power 48.
11/11 17:00 UTC – Today was mostly calm, the only variations with a maximum of Power 14 occurred from 7:30 to 9:30 UTC.
11/10 17:00 UTC – Calm.
11/10 11:00 UTC – Not much to say, compared to the calm we see only the “streaks” on the Power 10.
11/9 17:00 UTC – The series of light movements continued without interruption, a slight drop to values close to calm took place in the last hours.
11/9 11:30 UTC – In this first part of the day the movements continued, increasing numerically but with less powerful amplitude variations whose maximum was Power 25 at 2:30 UTC.
11/8 17:00 UTC – The series of most significant movements of today lasted about eight hours, from 3 to 11 UTC with the peaks previously reported, this period has been followed by more slight movements.
11/8 10:30 UTC – From today’s image, we can see how in the last three days there has been a sort of sequence of movements characterized by a constant increasing trend, will this coincidentally reach its maximum on 11 November? The significant peaks of today started at 3, at 6 UTC reached 35 and just before 10 the maximum value of these last 3 days, Power 43.
11/7 17:00 UTC – Slight movements have continued throughout the day, the highest peak is the one reported previously but shortly after 9 UTC we can see another variation that has reached Power 27.
11/7 09:00 UTC – The graph in the first part of today shows how the constant slight movement that began yesterday is continuing. Today we have had the strongest peak of these last 3 days and reached Power 32 at 3 UTC.
11/6 17:00 UTC – After a couple of days of relative calm today, shortly after midnight UTC, movements began again which gradually brought the current peak value of Power 23 to 9:30 UTC. Activity has not stopped but has continued and at present it seems to see a crescendo that will lead to higher values.
11/5 17:00 UTC – Today’s activity is very similar to that of yesterday, slight movements from 1 to 8 UTC with the maximum value reached of Power 12.
11/4 17:00 UTC – Today the calm has been almost total, very slight variations have reached Power 15 between 6 and 10 UTC.
11/3 17:00 UTC – During the last 24 hours reported in the chart there were only 3 significant short-term events, the first happened at 19 UTC of yesterday at Power 25, the second movement, which lasted about 2 hours, reached today’s maximum of Power 32 at 6:30 UTC and the last at 10 UTC at 23.
11/2 17:00 UTC – We could recap today activity with how long the amplitude remained above 40: 6 hours, from 3 to 9 UTC. Today’s maximum is Power 98 as previously reported. From 11 UTC the values are back to normal.
11/2 09:30 UTC – The strong activity that we see in progress at this time started decisively at the turn of the local midnight, corresponding to 17 UTC. Initially with peaks at Power 20, within two hours it reached 30 around 19 UTC. These first movements were followed by a period during which the amplitude was constantly oscillating between 10 and 20. At 1 UTC today, the very powerful activity began, bringing the amplitude close to Power 100. The maximum of Power 98 was reached at 5:30 UTC.
11/1 17:00 UTC – The situation shows the continuation of the variations also in this second part of the day where the greatest peak of today was had at Power 21.
11/1 12:30 UTC – The new chart shows slight movements around midnight UTC that have reached Power 18, for the rest just ‘background’ movements around 10.
Frequency means how many wave cycle happen in a second, 1 Hz. means 1 cycle per second, 40 Hz. means 40 cycles per second, Amplitude is the size of the vibration, how big is the wave, the chart shows the frequency variation in Hz and the amplitude using the white color.
Note
The Ancient Indian Rishis called 7.83 Hz the frequency of OM. It also happens to be Mother Earth’s natural heartbeat rhythmSchumann resonances are named after professor Schumann who was involved in early German secret space program and was later paper-clipped into the United States. The frequencies of Schumann resonances are fairly stable and are mainly defined by the physical size of the ionospheric cavity. The amplitude of Schumann resonances does change and is bigger when ionospheric plasma gets excited. Ionospheric plasma excitation happens because of solar activity, thunderstorms, use of scalar plasma weapons and HAARP and lately also when the Light forces are clearing the plasma anomaly.
Dependencies of Amplitudes Schumann Resonance December 8 2019
Dependencies of Quality Schumann Resonance December 8 2019
Dependencies of Frequency Schumann Resonance December 8 2019
All the SR daily images in one single pageSee the Images
Explanation of The Chart
The Schumann Resonance Spectrogram Chart
The Schumann Resonance Chart displays data from the magnetic field detector to monitor the resonances occurring in the plasma waves constantly circling the earth in the ionosphere. These three days spectrograms show the activity occurring at the various resonant frequencies from 1 to 40 Hz. Within the spectrogram, the power, or intensity level of each frequency is displayed as a color, with white being the most intense. The Schumann Resonances appear as the horizontal lines at 0.0, 4.0, 8.0, 12.0, 16.0, 20.0, 24.0, 28.0, 32.0, 36.0 & 40.0 Hz. This chart is based on Tomsk, Russia, time UTC +7 (UTC = Universal Time Coordinated).
What is a Spectrogram?
The Spectrogram Calendar is a visual representation of the range of frequencies in the magnetic field at a given location. Similar to how an equalizer displays the frequency content of music played on your stereo, the spectrogram calendar displays the frequency content of a magnetic field. Instead of showing a brief snapshot, it shows changes over a period of time, in this case 3 days.
The local magnetic field is a dynamic field that changes constantly because of variations in the ionosphere and sun and many other influences not yet fully understood. The range of variation displayed in the spectrogram chart is from 0 to 40 cycles per second. The vertical axis is frequency and the horizontal axis is time. The amplitude of a particular frequency at a specific time is represented by the intensity of color (green, yellow, white) of each point in the image.
Editor’s Note: Time to WAKE UP America (World) and smell the coffee! Many kinds of Disclosure are NOW on the their way. Watch the show, see Dark leave the Earth, and BE…
QAnon December 7 2019 – Think For Yourself. By Interstellar. Source 8kun. Updated 12/8/2019
Clicks on the Ads Keep Us Alive
3655
Q !!Hs1Jq13jV6 No.96 Dec 7 2019 16:42:24 (UTC)
Relevant to today re: F assets. Deconstruction of foreign controlled [intel] US media [+alt] critical. Untouchable re: State backed? Epstein thought so. Puppets & Puppet Masters. Q
New from MI team. Foreign assets activated. With impending IG report release, watch for spin/disinfo fm MSM & Alt Media > all foreign controlled [intel] = Mossad. They have enjoyed cover via State Dept as did Epstein (who ran a honeypot blackmail op for Mossad). Must deconstruct.QAnon December 7 2019 – Think For Yourself
Jeffrey Epstein, Ghislaine Maxwell and Harvey Weinstein grin at Princess Beatrice’s Windsor Castle party.
QAnon December 7 2019
This will be fun. Q lays out who is controlling the Alt right, US Media and many US politicians. The Mossad. Alt right examples of Mossad agents include Cernovic and Posobiec. They all have handlers. Q tells us to find connections.
This who “scream the loudest”… literally. Alex Jones wins that title. Remember when Alex Jones went on a rant and screamed “F*** Trump”? Why would he do that? This occurred around the time Alex realized Q was providing real intel to patriots.QAnon December 7 2019 – Think For Yourself
And this was also around the time Mr Mossad himself Jerome Corsi was getting called out by Q for trying to usurp the QAnon movement and funnel anons over to AJ for profit. This is how they exert control.QAnon December 7 2019 – Think For Yourself
What happens when people don’t conform to their rule? What happens when people cannot defend themselves? Why do [D]‘s want to abolish the 2nd amendment? “A well regulated Militia, being necessary to the security of a free State, the right of the people to keep and bear Arms, shall not be infringed.” What did the Framers of the Constitution fear the most? http://www.archives.gov/founding-docs/declaration-transcript “–That whenever any Form of Government becomes destructive of these ends, it is the Right of the People to alter or to abolish it, and to institute new Government, laying its foundation on such principles and organizing its powers in such form, as to them shall seem most likely to effect their Safety and Happiness. But when a long train of abuses and usurpations, pursuing invariably the same Object evinces a design to reduce them under absolute Despotism, it is their right, it is their duty, to throw off such Government, and to provide new Guards for their future security.–” We, the People. Q
Tweet deleted re: HK protester shot. Read here: theguardian.com
This is what tyrannical govts do. It’s why Ds want our guns. “When govts fear the people, there is liberty. When the people fear the govt, there is tyranny.”QAnon December 7 2019 – Think For Yourself
It’s all about control. It’s always been about control. Dems cant control patriots thanks to the 2nd amendment. Q links to a YouTube video of protesters in Hong Kong. Watch what happens when tyrannical governments strip their citizens of the ability to defend themselves.
Thank the Lord for this Great Country, our constitution and our great military full of patriots who ensure our freedom and our constitutional rights are protected!QAnon December 7 2019 – Think For Yourself
@RudyGiuliani was with @OANN in Budapest & Ukraine doing interview with former Ukraine prosecutor Yuri Lutsenko. @ChanelRion tweeted re: seeing Soros & Pinchuk at the airport in Kiev last night.
Soros is the epitome of EVIL.QAnon December 7 2019 – Think For Yourself
Soros is in Ukraine. @RudyGiuliani just traveled to Ukraine. The DS is panicking. What is the Ukrainian President providing Rudy with!? Hard drives maybe!!?? Evidence of the attempted coup. Q links to the definition of Evil. Soros is pure evil. Satan In flesh. The one question I have for you Q is when will Soros be given a one way trip to that “special place” you have picked out for him?QAnon December 7 2019 – Think For Yourself
http://www.foxnews.com/us/naval-air-station-shooter-manifesto-us-nation-of-evil Posted on Twitter prior to shooting? Calls to ban/remove Twitter? Calls to ban/remove 8ch for same reason? Congressional hearing? Why was there a coordinated effort to ban/remove 8ch? What was the reason? What was the REAL reason? Logical thinking. Q
Pensacola shooter posted anti-American/anti-Israel tweets before attack but no calls for Twitter to be shutdown as w/8chan where prev shooters allegedly posted manifestos. 8chan owner even had to testify before Congress. [They] are desperate to stop Q.QAnon December 7 2019 – Think For Yourself
Q making point that yesterday’s shooter paired manifesto on twitter before the shooting. Congress has not called for investigations like they did 8chan when the shooter posted manifesto on 8chan. Real reason was designed to permanently remove 8chan so Qanon could not post.QAnon December 7 2019 – Think For Yourself
Relevant to today re: F assets. Deconstruction of foreign controlled [intel] US media [+alt] critical. Untouchable re: State backed? Epstein thought so. Puppets & Puppet Masters. Q
Relevant to today re: F assets. Deconstruction of foreign controlled [intel] US media [+alt] critical. Untouchable re: State backed? Epstein thought so. Puppets & Puppet Masters. Q >>96
Great catch by @WWG1WGA_Every1 ! It was painfully obvious @DRUDGE had turned on President Trump a while ago. Now his @DRUDGE_REPORT Twitter bio appears to reflect that past tense status. How many more fake MAGAs will out themselves?QAnon December 7 2019 – Think For Yourself
Drudge is Mossad. Good find @wwg1wga_every1. Drudge used to be owned by Matt Drudge. There were rumors he sold it under a confidentiality agreement. Looks like Mossad owns it now.QAnon December 7 2019 – Think For Yourself
Ask yourself a very simple question, why? The ‘why’ will be (publicly) answered soon. Dark > Light Q
The why is because they never thought she’d lose & hadn’t covered any of their trails of treason, corruption, subversion, sedition, and evil perversions. They are criminals of the highest order & President @realDonaldTrump represents an existential threat to their crime spree.QAnon December 7 2019 – Think For Yourself
Big. Why would Hussein collude with others to impede the next sitting president? Q said that will be made public soon. Think of all the pedophilia, trafficking, money laundering, treason, satan worship, globalism Hussein wanted to cover up. This will be massive.QAnon December 7 2019 – Think For Yourself
Knowledge is power. Think for yourself. Trust yourself. Do due diligence. You awake, and thinking for yourself, is their greatest fear. Sheep no more. THE GREAT AWAKENING. Q
We allowed ourselves to believe what we were being told by media, schools, churches, Hollywood, etc. Many have now awakened BUT I still see people hanging on every damn tweet by Twitter personalities as Gospel. STOP! Think for yourselves!QAnon December 7 2019 – Think For Yourself
A stunning admission from Warren: “I shouldn’t have done it. I am not a person of color, I am not a citizen of a tribe. And I have apologized for confusion I have caused” pic.twitter.com/hVpRHdJyFJ
Corrupt. Think Harvard. Think tax break. Think political career. Corrupt. DRAIN THE SWAMP! Q
Just another crooked politician who wants to control our lives yet scammed the system herself for a job & tax breaks. She, however, is NOT an anomaly in DC. Thank God POTUS is draining that fetid swamp.QAnon December 7 2019 – Think For Yourself
Elizabeth Warren is corrupt. She’s a product of Harvard. Harvard President and Fellows of Harvard are exempt from federal and state taxes. Harvard is exempt from State taxes. Warrens entire political career is based on a lie. Link to article showing Warren apologizing.QAnon December 7 2019 – Think For Yourself
Elizabeth Warren is corrupt. She’s a product of Harvard. Harvard President and Fellows of Harvard are exempt from federal and state taxes. Harvard is exempt from State taxes. Warrens entire political career is based on a lie. Link to article showing Warren apologizing.QAnon December 7 2019 – Think For Yourself
You’ve heard about QAnon. But what is really going on with this conspiracy theory? A Political Science Professor explains, tonight. #FoxNews 8PM ET. pic.twitter.com/wBi4YoOhWT
While a biased POV shelters/protects the host, the overall discussion [eyes on] generates awareness. Q
I take this to mean @JesseBWatters guest will likely tout the usual conspiracy theory narrative but the fact that Watters is bringing him on will bring more eyes on and wake more people up. Does he read Q?QAnon December 7 2019 – Think For Yourself
With making the point that while Jesse Waters refers to Q as a conspiracy, he’s doing it to shelter/protect himself as a host. He is generating awareness while sheltering his own point of view. There is a need for people like himself, Hannity, Solomon, Carter to remain sheltered to some degree so they can continue to report the real news. They can still draw attention to Q as Jesse is doing tonight. Think of the hundreds of thousands of newbies who will research Q after tonight.QAnon December 7 2019 – Think For Yourself