Chinese scientist He Jiankui, who created the world’s first “gene-edited” babies, has been sentenced to three years in prison and fined 3 million yuan (US$430,000). He, along with two others named Zhang Renli and Qin Jinzhou, was convicted by a Shenzhen court on Monday on charges related to the “illegally carrying out human embryo gene-editing intended for reproduction”, which led to the births of three genetically edited babies.
Hong Kong will end 2019 with multiple protests planned for New Year’s Eve (Dec 31) and New Year’s Day aimed at disrupting festivities and shopping in the Asian financial hub, which has seen a rise in clashes between police and protesters since Christmas. Events dubbed “Suck the Eve” and “Shop with you” are scheduled for New Year’s Eve on Tuesday around the city, including in the party district of Lan Kwai Fong, Hong Kong’s picturesque Victoria Harbour, and popular shopping malls, according to notices circulated on social media.
Pakistan is currently in the grip of severe cold wave, with the mercury on Sunday, Dec 29 plunging to record-breaking -21C (-5.8F) in Skardu, a city located the central valley of Gilgit-Baltistan. According to local reports, the small canals and ponds in Skardu have been frozen due to the severe low temperature, while snowfall has also blocked many main roads and passes.
With fewer than 2 full-days remaining, India’s capital Delhi is about to register its second-coldest month of December since records began in 1901. Several flights have been diverted and almost three dozen trains are running behind schedule as a thick blanket of fog covers New Delhi amid an unusually severe winter season.
A group of friends started an IT company in 2013 and for a few years all was going smoothly, with profits steadily growing. However, a major rift then broke out among its leadership, which ended with one of the co-founders being shown the door. The man went to look for a new job outside France, but he didn’t forget the wrong done to him by his former associates. That’s how a businessman became a hacker. An investigation established that between December 2018 and January 2019, he used remote transactions to snatch 182 units of bitcoin, which is around €1.1 million ($1.2 million), from the company’s accounts. Having the inside-out knowledge of how the firm operates, the man never exceeded the withdrawal limit that automatically triggers an alarm.
At 2:00 pm UTC on 30 December, Tropical Cyclone Sarai (Category 2) was tracking closer to Nuku’alofa, Tonga, than previously forecast. On its current track, Tropical Cyclone Sarai is expected to be located 90km west of Nuku’alofa at 7:00pm. Occasional rain and strong to gale force winds will continue to affect the group this morning. The maximum winds near its center are about 50 knots (100 km/hr) with momentary gusts of up to 60 knots (120km/hr).
A population of coral reefs is making a remarkable recovery around the newest island on Earth, Hunga Tonga – Hunga Ha’apai (HTHH), after it was formed during a volcanic eruption in 2015. The island is 200m high and connects the neighbouring islands of Hunga Tonga and Hunga Ha’apai. The finding was made by a team of scientists recently, who were studying the effects of the eruption on coral reef diversity around the island.
Merry Christams Pacific Islanders: The Office of the Drug Control under the Australian Government’s Department of Health has announced the amount of kava that can be imported by a traveller for personal use has increased from 2kg to 4kg.
Report: “Bali, Indonesia’s most-visited island, has suffered the effects of overtourism in the last few years to the point that the government is weighing a tourist tax to help combat some of the more sinister effects on the environment.” According to this report, people are actually being advised to give the Indonesian island a miss next year, in order to give the wildlife and nature a chance to recuperate.
A volunteer firefighter was killed battling Australian bushfires on Monday as “columns” of flames generating their own dangerous weather systems bore down on a tourist region, prompting the evacuation of tens of thousands of people. Around 100 fires are burning across Australia, with as many as 14 “emergency” warnings in place for Victoria while fires are also threatening homes and infrastructure in South Australia and Tasmania.
Active Weather
Severe Tropical Storm Calvinia 55kts ↑ 980 hPa ↓ S of Mauritius – Moving SE 5 kts ↓
Tropical Cyclone Sarai 45 kts ↓ 987 hPa ↑ SW of Tonga – Moving SE 7 kts ↓
Strongest EQ in Europe M3.5 Romania Strongest EQ in US M3.7 Alaska Strongest EQ on the Planet M5.3 Southwest of Africa Deepest EQ M4.4 388 km Kamchatka, RussiaNews Burst 30 December 2019
Share this: Send the word out using these buttons!
Editor’s Note: The Schumann Resonance graph is slowing no activity for the past 24 hours. Have the Cosmic energies finished coming to Earth? I think NOT my friends, as I still “hear” these energies non-stop ( I AM clairaudient.)
A New Year starts for us ALL, so let us see if the specific frequency needed to cause the Earth to “ring like a bell” in response occurs. In the meantime, be sure to keep your energy high, practice self-love, and BE…
Schumann Resonance Today. We will try to keep you updated about the variations of the Resonance with this page. The great variations that nobody can explain but that give us a clear sign that the planet is changing. The Earth is vibration higher and higher, just like us!
The Chart time is based on Tomsk – Russia – UTC (Universal Time Coordinated) +7Source
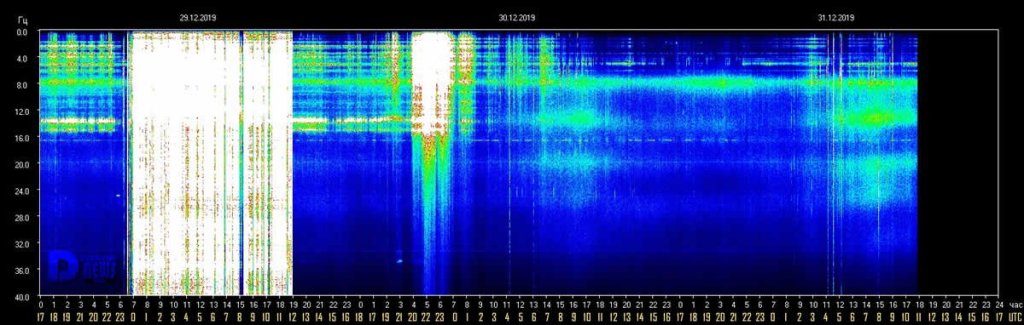
12/30 10:00 UTC – After yesterday’s very strong activity, the situation remained calm for about 9 hours until about 21 UTC (yesterday), when new moderate movements began which lasted almost 4 hours until 1:30 UTC. During this period the maximum amplitude value reached has been Power 30.
12/29 17:00 UTC – Today’s activity lasted 13 hours, from 23 (yesterday) to 12 UTC (today), the average was about Power 70 and only once, briefly for about 15 minutes around 8 UTC, the amplitude went below Power 40. Graphically it looks like a column of light.
12/29 13:30 UTC – In the second part of the day shown in the graph it is highlighted how the intensity of the variations has remained substantially unchanged and has generated the strongest peak of the day at Power 93. It seems that, suddenly as they started, the movements have rapidly dropped to normal values at 12 UTC.
12/29 09:00 UTC – The situation changed suddenly at 23 UTC when a series of movements began and led the amplitude values to reach Power 72 at 7 UTC, from that moment onward the amplitude remained on values between Power 65 and Power 80 with the peak maximum at Power 82 at 1:30 and 2 UTC.
12/28 17:00 UTC – Calm.
12/27 17:00 UTC – Calm.
12/27 13:30 UTC – What appears to be all of today’s activity took place in four hours, from 4 to 8 UTC. During this period there were 4 peaks, each stronger than the previous one, and the last one at 7:30 UTC at Power 38 was the strongest.
12/26 17:00 UTC – Calm.
12/25 17:00 UTC – The activity seems to be in slight and constant decline, today two slight peaks, the first at Power 18 at 3 UTC, the second at Power 12 at 12: 30 UTC.
12/24 17:00 UTC – Today’s activity lasted for about eight hours, from 2 to 10 UTC, the highest values occurred between 6 and 7: 30 UTC and reached Power 27.
12/23 17:00 UTC – Power 34 isolated at 10:30 UTC was all the activity for today.
12/22 17:00 UTC – Today we could say that total calm lasted only 4 hours, from 5 to 9 UTC, the variations for the rest of time were not significant, apart from those previously reported.
12/22 09:30 UTC – After several days of almost absolute calm, yesterday’s evening UTC time we had about 4 hours of significant activity, from 15 to 19 UTC. During this period the amplitude values remained for most of the time above Power 30 with the maximum at Power 37 at 18:30 UTC.
12/21 17:00 UTC – A slight activity began today in the last hours shown in the graph, the first change in amplitude occurred just before 5 UTC at Power 18 followed by minor variations. Shortly after 15 UTC the movements became more intense with first Power 31 and then the maximum of today’s chart at Power 35 just before 17 UTC.
12/20 17:00 UTC – Today it was still calm, the little variations seen in the graph reached Power 11.
12/19 17:00 UTC – Calm.
12/18 17:00 UTC – Technically we had an event that stands out as often happens lately on the 17th of the month, a peak at Power 17 on December 17th at 19 UTC (corresponding to today’s 2 am on the chart). For the rest, still calm.
12/17 17:00 UTC – Calm, many consecutive days of complete cam are not common.
12/16 17:00 UTC – Calm.
12/15 17:00 UTC – Another calm day, just a wriggle at 3 UTC that reached Power 15.
12/14 17:00 UTC – Calm.
12/13 17:00 UTC – Calm.
12/13 11:00 UTC – Significant activity even today and as in the last few days consisted mainly in isolated peaks. Those of today were 2, very strong, the first at 6 UTC reached Power 60, the second shortly after at 6:40 UTC reached Power 51.
12/12 17:00 UTC – Calm.
12/12 14:00 UTC – There we have it, the Coincidence 17 again today, the Amplitude has reached Power 74 between 16 and 17 on the chart. corresponding to 9-10 UTC. In this case we could start thinking about how many times it must happen before it becomes impossible…
12/12 07:30 UTC – It is clearly a time of pillars, even today we had 30 very intense minutes; from 6 to 6:30 UTC there was the first movement with the amplitude values that reached Power 63 shortly after 6 UTC.
12/11 17:00 UTC – Calm continued.
12/10 17:00 UTC – After the umpteenth “Coincidence 17” it has been calm.
12/10 11:30 UTC – Powerful activity once more, even if limited in time. It was calm until just after 3 UTC when a first isolated peak reached Power 54. From 5:30 to 6:30 it was the most intense part with the maximum value at Power 67. The last peak so far is was reached near 17 h on the chart, 10 UTC, and was at P50.
12/9 17:00 UTC – The short but intense period of activity was all for today.
12/9 11:30 UTC – It is no surprise that today this strong peak occurred and reached Power 74, it would have been a surprise if it had been a calm day. This strong series of movements lasted about 50 minutes, from 8:40 to 9:40 UTC, at 9:15 the maximum value.
12/8 17:00 UTC – Calm.
12/8 11:30 UTC – The situation today shows total calm until around 10 UTC when very slight variations in Amplitude started.
12/7 17:00 UTC – Much of today’s activity has been concentrated in the first part of the UTC day, from midnight until 6, where maximum values have been reached. Other slight sporadic variations at P15 also occurred at 10: 30 UTC.
12/7 09:00 UTC – After the record high of yesterday the variations continued sporadically at lower levels, the maximums were around Power 15. From midnight UTC a very active phase started again which kept the Amplitude above Power 50 for about 4 hours, from 1 to 5 UTC; during this period the maximum value achieved was Power 64.
12/6 17:00 UTC – After the incredible Amplitude spike at Power 158 other strong movements continued, the period of activity in which the Amplitude has been above 100 lasted about 1 hour, from 7:45 am to 8:45 UTC. At 10:30 UTC there was a further flicker at Power 28, after which a slight background activity continues.
12/6 10:30 UTC – The today’s graph began in a condition of general calm until 3 am UTC when the variations started. Immediately they reached Power 32 at 4 UTC; the movements continued with less magnitude until 7:45 UTC when some impressive movements started and reached Power 100 in around 15 minutes, at 8 UTC. This, despite the already impressive value, is still not the maximum for today, at 8:30 am the amplitude has further increased and reached an incredible Power 158, the most powerful peak of the last 2 years! In addition to the main and the amplitude graphs, the massive variation can also be seen in the other two charts, the Quality, which shows a value of 25, and that of the frequency of the SR, which shows a value of 8.80.
12/5 17:00 UTC – Calm.
12/4 17:00 UTC – Yesterday we saw a single peak, today the activity was very similar, 2 peaks, one at Power 23 at 21:30 UTC yesterday and another today at Power 19 this morning at 1:30 UTC. For the rest of the day it was calm.
12/3 17:00 UTC – Total calm, the only wriggle at 7 UTC reached Power 13.
12/2 17:00 UTC – Today the activity was not long lasting but very intense, in addition to the previous peak, which marked the beginning of the active period at 8:30 UTC, after a while, at 9 UTC, there was the maximum of today at Power 55, this was followed shortly after by a further movement on the 30s after which, from 10 UTC, the calm returned. Still, another movement around 17 hours of the graph.
12/2 09:30 UTC – Today’s chart shows once again a stato of calm, the last significant peak at Power 20 was Nov. 30 at 19 UTC so it took about 36 hours before the amplitude values returned above P10. Today, however, it’s back, the peak was at Power 37 8:30 UTC.
12/1 17:00 UTC – A single peak isolated at Power 25 in the first part of today’s chart and then calm.
Frequency means how many wave cycle happen in a second, 1 Hz. means 1 cycle per second, 40 Hz. means 40 cycles per second, Amplitude is the size of the vibration, how big is the wave, the chart shows the frequency variation in Hz and the amplitude using the white color.
Note
The Ancient Indian Rishis called 7.83 Hz the frequency of OM. It also happens to be Mother Earth’s natural heartbeat rhythmSchumann resonances are named after professor Schumann who was involved in early German secret space program and was later paper-clipped into the United States. The frequencies of Schumann resonances are fairly stable and are mainly defined by the physical size of the ionospheric cavity. The amplitude of Schumann resonances does change and is bigger when ionospheric plasma gets excited. Ionospheric plasma excitation happens because of solar activity, thunderstorms, use of scalar plasma weapons and HAARP and lately also when the Light forces are clearing the plasma anomaly.
Dependencies of Amplitudes Schumann Resonance December 31 2019
Dependencies of Quality Schumann Resonance December 30 2019
Dependencies of Frequency Schumann Resonance December 30 2019
All the SR daily images in one single pageSee the Images
Explanation of The Chart
The Schumann Resonance Spectrogram Chart
The Schumann Resonance Chart displays data from the magnetic field detector to monitor the resonances occurring in the plasma waves constantly circling the earth in the ionosphere. These three days spectrograms show the activity occurring at the various resonant frequencies from 1 to 40 Hz. Within the spectrogram, the power, or intensity level of each frequency is displayed as a color, with white being the most intense. The Schumann Resonances appear as the horizontal lines at 0.0, 4.0, 8.0, 12.0, 16.0, 20.0, 24.0, 28.0, 32.0, 36.0 & 40.0 Hz. This chart is based on Tomsk, Russia, time UTC +7 (UTC = Universal Time Coordinated).
What is a Spectrogram?
The Spectrogram Calendar is a visual representation of the range of frequencies in the magnetic field at a given location. Similar to how an equalizer displays the frequency content of music played on your stereo, the spectrogram calendar displays the frequency content of a magnetic field. Instead of showing a brief snapshot, it shows changes over a period of time, in this case 3 days.
The local magnetic field is a dynamic field that changes constantly because of variations in the ionosphere and sun and many other influences not yet fully understood. The range of variation displayed in the spectrogram chart is from 0 to 40 cycles per second. The vertical axis is frequency and the horizontal axis is time. The amplitude of a particular frequency at a specific time is represented by the intensity of color (green, yellow, white) of each point in the image.
Editor’s Note: We see from the daily graph for the Schumann Resonance that after the YUGE “white-out” of these energies from yesterday, a lower amplitude of high density from the hours of 10:30pm through 2am (EST, USA) over night.
Thanks for staying aware of energies that are now impacting the Earth in a major kind of way, know why you are changing (DNA change = thought change = vibration change= world change), and BE…
Schumann Resonance Today. We will try to keep you updated about the variations of the Resonance with this page. The great variations that nobody can explain but that give us a clear sign that the planet is changing. The Earth is vibration higher and higher, just like us!
The Chart time is based on Tomsk – Russia – UTC (Universal Time Coordinated) +7Source
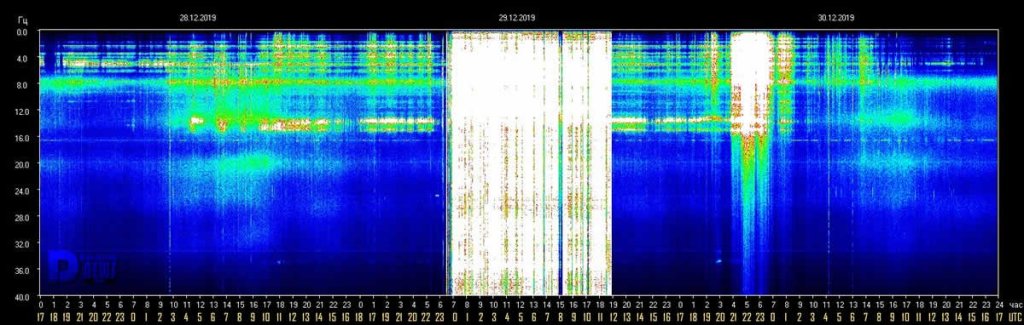
12/30 10:00 UTC – After yesterday’s very strong activity, the situation remained calm for about 9 hours until about 21 UTC (yesterday), when new moderate movements began which lasted almost 4 hours until 1:30 UTC. During this period the maximum amplitude value reached has been Power 30.
12/29 17:00 UTC – Today’s activity lasted 13 hours, from 23 (yesterday) to 12 UTC (today), the average was about Power 70 and only once, briefly for about 15 minutes around 8 UTC, the amplitude went below Power 40. Graphically it looks like a column of light.
12/29 13:30 UTC – In the second part of the day shown in the graph it is highlighted how the intensity of the variations has remained substantially unchanged and has generated the strongest peak of the day at Power 93. It seems that, suddenly as they started, the movements have rapidly dropped to normal values at 12 UTC.
12/29 09:00 UTC – The situation changed suddenly at 23 UTC when a series of movements began and led the amplitude values to reach Power 72 at 7 UTC, from that moment onward the amplitude remained on values between Power 65 and Power 80 with the peak maximum at Power 82 at 1:30 and 2 UTC.
12/28 17:00 UTC – Calm.
12/27 17:00 UTC – Calm.
12/27 13:30 UTC – What appears to be all of today’s activity took place in four hours, from 4 to 8 UTC. During this period there were 4 peaks, each stronger than the previous one, and the last one at 7:30 UTC at Power 38 was the strongest.
12/26 17:00 UTC – Calm.
12/25 17:00 UTC – The activity seems to be in slight and constant decline, today two slight peaks, the first at Power 18 at 3 UTC, the second at Power 12 at 12: 30 UTC.
12/24 17:00 UTC – Today’s activity lasted for about eight hours, from 2 to 10 UTC, the highest values occurred between 6 and 7: 30 UTC and reached Power 27.
12/23 17:00 UTC – Power 34 isolated at 10:30 UTC was all the activity for today.
12/22 17:00 UTC – Today we could say that total calm lasted only 4 hours, from 5 to 9 UTC, the variations for the rest of time were not significant, apart from those previously reported.
12/22 09:30 UTC – After several days of almost absolute calm, yesterday’s evening UTC time we had about 4 hours of significant activity, from 15 to 19 UTC. During this period the amplitude values remained for most of the time above Power 30 with the maximum at Power 37 at 18:30 UTC.
12/21 17:00 UTC – A slight activity began today in the last hours shown in the graph, the first change in amplitude occurred just before 5 UTC at Power 18 followed by minor variations. Shortly after 15 UTC the movements became more intense with first Power 31 and then the maximum of today’s chart at Power 35 just before 17 UTC.
12/20 17:00 UTC – Today it was still calm, the little variations seen in the graph reached Power 11.
12/19 17:00 UTC – Calm.
12/18 17:00 UTC – Technically we had an event that stands out as often happens lately on the 17th of the month, a peak at Power 17 on December 17th at 19 UTC (corresponding to today’s 2 am on the chart). For the rest, still calm.
12/17 17:00 UTC – Calm, many consecutive days of complete cam are not common.
12/16 17:00 UTC – Calm.
12/15 17:00 UTC – Another calm day, just a wriggle at 3 UTC that reached Power 15.
12/14 17:00 UTC – Calm.
12/13 17:00 UTC – Calm.
12/13 11:00 UTC – Significant activity even today and as in the last few days consisted mainly in isolated peaks. Those of today were 2, very strong, the first at 6 UTC reached Power 60, the second shortly after at 6:40 UTC reached Power 51.
12/12 17:00 UTC – Calm.
12/12 14:00 UTC – There we have it, the Coincidence 17 again today, the Amplitude has reached Power 74 between 16 and 17 on the chart. corresponding to 9-10 UTC. In this case we could start thinking about how many times it must happen before it becomes impossible…
12/12 07:30 UTC – It is clearly a time of pillars, even today we had 30 very intense minutes; from 6 to 6:30 UTC there was the first movement with the amplitude values that reached Power 63 shortly after 6 UTC.
12/11 17:00 UTC – Calm continued.
12/10 17:00 UTC – After the umpteenth “Coincidence 17” it has been calm.
12/10 11:30 UTC – Powerful activity once more, even if limited in time. It was calm until just after 3 UTC when a first isolated peak reached Power 54. From 5:30 to 6:30 it was the most intense part with the maximum value at Power 67. The last peak so far is was reached near 17 h on the chart, 10 UTC, and was at P50.
12/9 17:00 UTC – The short but intense period of activity was all for today.
12/9 11:30 UTC – It is no surprise that today this strong peak occurred and reached Power 74, it would have been a surprise if it had been a calm day. This strong series of movements lasted about 50 minutes, from 8:40 to 9:40 UTC, at 9:15 the maximum value.
12/8 17:00 UTC – Calm.
12/8 11:30 UTC – The situation today shows total calm until around 10 UTC when very slight variations in Amplitude started.
12/7 17:00 UTC – Much of today’s activity has been concentrated in the first part of the UTC day, from midnight until 6, where maximum values have been reached. Other slight sporadic variations at P15 also occurred at 10: 30 UTC.
12/7 09:00 UTC – After the record high of yesterday the variations continued sporadically at lower levels, the maximums were around Power 15. From midnight UTC a very active phase started again which kept the Amplitude above Power 50 for about 4 hours, from 1 to 5 UTC; during this period the maximum value achieved was Power 64.
12/6 17:00 UTC – After the incredible Amplitude spike at Power 158 other strong movements continued, the period of activity in which the Amplitude has been above 100 lasted about 1 hour, from 7:45 am to 8:45 UTC. At 10:30 UTC there was a further flicker at Power 28, after which a slight background activity continues.
12/6 10:30 UTC – The today’s graph began in a condition of general calm until 3 am UTC when the variations started. Immediately they reached Power 32 at 4 UTC; the movements continued with less magnitude until 7:45 UTC when some impressive movements started and reached Power 100 in around 15 minutes, at 8 UTC. This, despite the already impressive value, is still not the maximum for today, at 8:30 am the amplitude has further increased and reached an incredible Power 158, the most powerful peak of the last 2 years! In addition to the main and the amplitude graphs, the massive variation can also be seen in the other two charts, the Quality, which shows a value of 25, and that of the frequency of the SR, which shows a value of 8.80.
12/5 17:00 UTC – Calm.
12/4 17:00 UTC – Yesterday we saw a single peak, today the activity was very similar, 2 peaks, one at Power 23 at 21:30 UTC yesterday and another today at Power 19 this morning at 1:30 UTC. For the rest of the day it was calm.
12/3 17:00 UTC – Total calm, the only wriggle at 7 UTC reached Power 13.
12/2 17:00 UTC – Today the activity was not long lasting but very intense, in addition to the previous peak, which marked the beginning of the active period at 8:30 UTC, after a while, at 9 UTC, there was the maximum of today at Power 55, this was followed shortly after by a further movement on the 30s after which, from 10 UTC, the calm returned. Still, another movement around 17 hours of the graph.
12/2 09:30 UTC – Today’s chart shows once again a stato of calm, the last significant peak at Power 20 was Nov. 30 at 19 UTC so it took about 36 hours before the amplitude values returned above P10. Today, however, it’s back, the peak was at Power 37 8:30 UTC.
12/1 17:00 UTC – A single peak isolated at Power 25 in the first part of today’s chart and then calm.
Frequency means how many wave cycle happen in a second, 1 Hz. means 1 cycle per second, 40 Hz. means 40 cycles per second, Amplitude is the size of the vibration, how big is the wave, the chart shows the frequency variation in Hz and the amplitude using the white color.
Note
The Ancient Indian Rishis called 7.83 Hz the frequency of OM. It also happens to be Mother Earth’s natural heartbeat rhythmSchumann resonances are named after professor Schumann who was involved in early German secret space program and was later paper-clipped into the United States. The frequencies of Schumann resonances are fairly stable and are mainly defined by the physical size of the ionospheric cavity. The amplitude of Schumann resonances does change and is bigger when ionospheric plasma gets excited. Ionospheric plasma excitation happens because of solar activity, thunderstorms, use of scalar plasma weapons and HAARP and lately also when the Light forces are clearing the plasma anomaly.
Dependencies of Amplitudes Schumann Resonance December 30 2019
Dependencies of Quality Schumann Resonance December 30 2019
Dependencies of Frequency Schumann Resonance December 30 2019
All the SR daily images in one single pageSee the Images
Explanation of The Chart
The Schumann Resonance Spectrogram Chart
The Schumann Resonance Chart displays data from the magnetic field detector to monitor the resonances occurring in the plasma waves constantly circling the earth in the ionosphere. These three days spectrograms show the activity occurring at the various resonant frequencies from 1 to 40 Hz. Within the spectrogram, the power, or intensity level of each frequency is displayed as a color, with white being the most intense. The Schumann Resonances appear as the horizontal lines at 0.0, 4.0, 8.0, 12.0, 16.0, 20.0, 24.0, 28.0, 32.0, 36.0 & 40.0 Hz. This chart is based on Tomsk, Russia, time UTC +7 (UTC = Universal Time Coordinated).
What is a Spectrogram?
The Spectrogram Calendar is a visual representation of the range of frequencies in the magnetic field at a given location. Similar to how an equalizer displays the frequency content of music played on your stereo, the spectrogram calendar displays the frequency content of a magnetic field. Instead of showing a brief snapshot, it shows changes over a period of time, in this case 3 days.
The local magnetic field is a dynamic field that changes constantly because of variations in the ionosphere and sun and many other influences not yet fully understood. The range of variation displayed in the spectrogram chart is from 0 to 40 cycles per second. The vertical axis is frequency and the horizontal axis is time. The amplitude of a particular frequency at a specific time is represented by the intensity of color (green, yellow, white) of each point in the image.
A columnist for The Washington Post blasted Rachel Maddow for her coverage of the infamous Steele dossier on Thursday, saying that the MSNBC host engaged in “a pattern of misleading and dishonest asymmetry” in her reporting on the salacious document in the nearly three years since its publication. MSM turning on each other? Trying to develop CYA stories? Did WaPoo discover Barr/Durham/Etc are looking at the media?
Loren “Sensei” Copp, 50, former owner of Dojo Pizza in St. Louis, MO, was sentenced to 65 years in prison for production and attempted production of child pornography; possession of child pornography; and the use of interstate facilities to persuade or coerce a minor to engage in sexual activity.
Big Nikola Tesla document dump dropped from the FBI vault. Q: Who at MIT was tasked to make sense of Tesla’s research after his death? A: John G. Trump (Trumps uncle).vault.fbi.gov
A Tongan man has reportedly died on an Australian farm while working in that country’s Seasonal Worker Program (modern slavery). Fifteen Pacific islanders have reportedly died in the program since it began 10 years ago.
The whistleblower who exposed the relationship between Google and Hillary Clinton before Congress lost his wife in an “accident” tonight.
Twitter just suspended two of the accounts POTUS just retweeted, within an hour of him retweeting them. One of them was placed into a limited state by just retweeted literally 13 minutes ago after @potus retweeted it.
At least five people were killed when a twin-engine aircraft crashed in Louisiana on Saturday. The plane crashed in an open field not far away from Lafayette Regional Airport near a post office and Walmart.
The reactor at the Leibstadt nuclear power station in northern Switzerland shut down automatically because of a technical problem on Saturday. The shutdown at Leibstadt, which was built in 1984 and is one of four nuclear power stations in the country, took place at 7:48 a.m. local time following a technical fault in the non-nuclear part of the plant, a statement by the operator said.
Chinese lawmakers voted to abolish the “custody and education” punishment system that allowed police to hold sex workers and their clients without charge for up to two years, state media reported. The arbitrary detention system will cease from Sunday and those held at “education centres” should be released immediately, state news agency Xinhua reported.
Anti-government Yellow Vests and anti-pension rallies have simultaneously descended upon the streets of the French capital, promptly escalating into clashes with police who responded with tear gas and baton charges.
A huge 190.77-carat diamond was discovered in Russia’s Siberian republic of Yakutia The gem could have laid undisturbed for around 2 billion years, according to preliminary data, but further examination is set to determine the exact age.
At least 90 people are reported dead and 125 more wounded after a massive car bomb was detonated at a busy intersection in the Somali capital of Mogadishu on Saturday. The apparent suicide attack happened during rush hour traffic at about 8am. Among the dead are 17 Somali police officers, while most have been described as university students on their way to classes.
Blind Items Revealed #1 – December 16, 2019
Since the death of the billionaire pedophile, this foreign born permanent A list model has been wearing a unique piece of jewelry. She never wore it before his death that anyone has been able to find. It is a pentagram that she wears as part of a necklace and has done so multiple times. Jeffrey Epstein/Naomi Campbell Img
Active Weather
Tropical Depression Phanfone 35kts ↓ 1002 hPa E of Vietnam Moving WSW 5 kts
Tropical Cyclone Sarai 60 kts ↑ 973 hPa ↓ SE of Fiji – Moving ESE 5 kts ↓
Strongest EQ in Europe M4.4 Greece Strongest EQ in US M3.9 California Strongest EQ on the Planet M5.5 Prince Edward Islands Deepest EQ M3.8 400 km IranNews Burst 29 December 2019
Share this: Send the word out using these buttons!
Editor’s Note: Wowza! The graph for the Schumann Resonance energies show a tremendous almost solid column of high amplitude, high frequency energies (Light) for a period of 12 hours, from 7:00pm to 7:00am (EST, USA).
Why does this happen? These energies are released by the Earth as she vibrates in response to receiving cosmic energies (frequency unknown). This causes the Earth to respond by “ringing like a bell” with the release of Schumann Resonance energies.
Please know we are in a time of high energetic activity both from cosmic energies as well as the resulting Schumann Resonance energies. These are changing our DNA which changes the way we think and feel which IS changing our world. Please BE…
Schumann Resonance Today. We will try to keep you updated about the variations of the Resonance with this page. The great variations that nobody can explain but that give us a clear sign that the planet is changing. The Earth is vibration higher and higher, just like us!
The Chart time is based on Tomsk – Russia – UTC (Universal Time Coordinated) +7Source
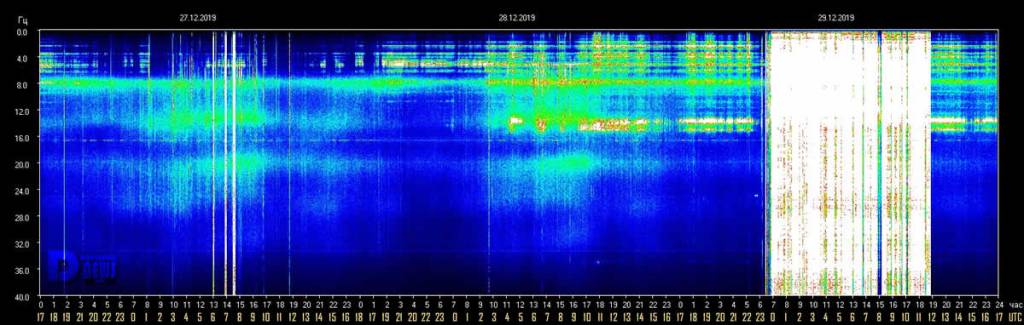
12/29 17:00 UTC – Today’s activity lasted 13 hours, from 23 (yesterday) to 12 UTC (today), the average was about Power 70 and only once, briefly for about 15 minutes around 8 UTC, the amplitude went below Power 40. Graphically it looks like a column of light.
12/29 13:30 UTC – In the second part of the day shown in the graph it is highlighted how the intensity of the variations has remained substantially unchanged and has generated the strongest peak of the day at Power 93. It seems that, suddenly as they started, the movements have rapidly dropped to normal values at 12 UTC.
12/29 09:00 UTC – The situation changed suddenly at 23 UTC when a series of movements began and led the amplitude values to reach Power 72 at 7 UTC, from that moment onward the amplitude remained on values between Power 65 and Power 80 with the peak maximum at Power 82 at 1:30 and 2 UTC..
12/28 17:00 UTC – Calm.
12/27 17:00 UTC – Calm.
12/27 13:30 UTC – What appears to be all of today’s activity took place in four hours, from 4 to 8 UTC. During this period there were 4 peaks, each stronger than the previous one, and the last one at 7:30 UTC at Power 38 was the strongest.
12/26 17:00 UTC – Calm.
12/25 17:00 UTC – The activity seems to be in slight and constant decline, today two slight peaks, the first at Power 18 at 3 UTC, the second at Power 12 at 12: 30 UTC.
12/24 17:00 UTC – Today’s activity lasted for about eight hours, from 2 to 10 UTC, the highest values occurred between 6 and 7: 30 UTC and reached Power 27.
12/23 17:00 UTC – Power 34 isolated at 10:30 UTC was all the activity for today.
12/22 17:00 UTC – Today we could say that total calm lasted only 4 hours, from 5 to 9 UTC, the variations for the rest of time were not significant, apart from those previously reported.
12/22 09:30 UTC – After several days of almost absolute calm, yesterday’s evening UTC time we had about 4 hours of significant activity, from 15 to 19 UTC. During this period the amplitude values remained for most of the time above Power 30 with the maximum at Power 37 at 18:30 UTC.
12/21 17:00 UTC – A slight activity began today in the last hours shown in the graph, the first change in amplitude occurred just before 5 UTC at Power 18 followed by minor variations. Shortly after 15 UTC the movements became more intense with first Power 31 and then the maximum of today’s chart at Power 35 just before 17 UTC.
12/20 17:00 UTC – Today it was still calm, the little variations seen in the graph reached Power 11.
12/19 17:00 UTC – Calm.
12/18 17:00 UTC – Technically we had an event that stands out as often happens lately on the 17th of the month, a peak at Power 17 on December 17th at 19 UTC (corresponding to today’s 2 am on the chart). For the rest, still calm.
12/17 17:00 UTC – Calm, many consecutive days of complete cam are not common.
12/16 17:00 UTC – Calm.
12/15 17:00 UTC – Another calm day, just a wriggle at 3 UTC that reached Power 15.
12/14 17:00 UTC – Calm.
12/13 17:00 UTC – Calm.
12/13 11:00 UTC – Significant activity even today and as in the last few days consisted mainly in isolated peaks. Those of today were 2, very strong, the first at 6 UTC reached Power 60, the second shortly after at 6:40 UTC reached Power 51.
12/12 17:00 UTC – Calm.
12/12 14:00 UTC – There we have it, the Coincidence 17 again today, the Amplitude has reached Power 74 between 16 and 17 on the chart. corresponding to 9-10 UTC. In this case we could start thinking about how many times it must happen before it becomes impossible…
12/12 07:30 UTC – It is clearly a time of pillars, even today we had 30 very intense minutes; from 6 to 6:30 UTC there was the first movement with the amplitude values that reached Power 63 shortly after 6 UTC.
12/11 17:00 UTC – Calm continued.
12/10 17:00 UTC – After the umpteenth “Coincidence 17” it has been calm.
12/10 11:30 UTC – Powerful activity once more, even if limited in time. It was calm until just after 3 UTC when a first isolated peak reached Power 54. From 5:30 to 6:30 it was the most intense part with the maximum value at Power 67. The last peak so far is was reached near 17 h on the chart, 10 UTC, and was at P50.
12/9 17:00 UTC – The short but intense period of activity was all for today.
12/9 11:30 UTC – It is no surprise that today this strong peak occurred and reached Power 74, it would have been a surprise if it had been a calm day. This strong series of movements lasted about 50 minutes, from 8:40 to 9:40 UTC, at 9:15 the maximum value.
12/8 17:00 UTC – Calm.
12/8 11:30 UTC – The situation today shows total calm until around 10 UTC when very slight variations in Amplitude started.
12/7 17:00 UTC – Much of today’s activity has been concentrated in the first part of the UTC day, from midnight until 6, where maximum values have been reached. Other slight sporadic variations at P15 also occurred at 10: 30 UTC.
12/7 09:00 UTC – After the record high of yesterday the variations continued sporadically at lower levels, the maximums were around Power 15. From midnight UTC a very active phase started again which kept the Amplitude above Power 50 for about 4 hours, from 1 to 5 UTC; during this period the maximum value achieved was Power 64.
12/6 17:00 UTC – After the incredible Amplitude spike at Power 158 other strong movements continued, the period of activity in which the Amplitude has been above 100 lasted about 1 hour, from 7:45 am to 8:45 UTC. At 10:30 UTC there was a further flicker at Power 28, after which a slight background activity continues.
12/6 10:30 UTC – The today’s graph began in a condition of general calm until 3 am UTC when the variations started. Immediately they reached Power 32 at 4 UTC; the movements continued with less magnitude until 7:45 UTC when some impressive movements started and reached Power 100 in around 15 minutes, at 8 UTC. This, despite the already impressive value, is still not the maximum for today, at 8:30 am the amplitude has further increased and reached an incredible Power 158, the most powerful peak of the last 2 years! In addition to the main and the amplitude graphs, the massive variation can also be seen in the other two charts, the Quality, which shows a value of 25, and that of the frequency of the SR, which shows a value of 8.80.
12/5 17:00 UTC – Calm.
12/4 17:00 UTC – Yesterday we saw a single peak, today the activity was very similar, 2 peaks, one at Power 23 at 21:30 UTC yesterday and another today at Power 19 this morning at 1:30 UTC. For the rest of the day it was calm.
12/3 17:00 UTC – Total calm, the only wriggle at 7 UTC reached Power 13.
12/2 17:00 UTC – Today the activity was not long lasting but very intense, in addition to the previous peak, which marked the beginning of the active period at 8:30 UTC, after a while, at 9 UTC, there was the maximum of today at Power 55, this was followed shortly after by a further movement on the 30s after which, from 10 UTC, the calm returned. Still, another movement around 17 hours of the graph.
12/2 09:30 UTC – Today’s chart shows once again a stato of calm, the last significant peak at Power 20 was Nov. 30 at 19 UTC so it took about 36 hours before the amplitude values returned above P10. Today, however, it’s back, the peak was at Power 37 8:30 UTC.
12/1 17:00 UTC – A single peak isolated at Power 25 in the first part of today’s chart and then calm.
Frequency means how many wave cycle happen in a second, 1 Hz. means 1 cycle per second, 40 Hz. means 40 cycles per second, Amplitude is the size of the vibration, how big is the wave, the chart shows the frequency variation in Hz and the amplitude using the white color.
Note
The Ancient Indian Rishis called 7.83 Hz the frequency of OM. It also happens to be Mother Earth’s natural heartbeat rhythmSchumann resonances are named after professor Schumann who was involved in early German secret space program and was later paper-clipped into the United States. The frequencies of Schumann resonances are fairly stable and are mainly defined by the physical size of the ionospheric cavity. The amplitude of Schumann resonances does change and is bigger when ionospheric plasma gets excited. Ionospheric plasma excitation happens because of solar activity, thunderstorms, use of scalar plasma weapons and HAARP and lately also when the Light forces are clearing the plasma anomaly.
Dependencies of Amplitudes Schumann Resonance December 29 2019
Dependencies of Quality Schumann Resonance December 29 2019
Dependencies of Frequency Schumann Resonance December 29 2019
All the SR daily images in one single pageSee the Images
Explanation of The Chart
The Schumann Resonance Spectrogram Chart
The Schumann Resonance Chart displays data from the magnetic field detector to monitor the resonances occurring in the plasma waves constantly circling the earth in the ionosphere. These three days spectrograms show the activity occurring at the various resonant frequencies from 1 to 40 Hz. Within the spectrogram, the power, or intensity level of each frequency is displayed as a color, with white being the most intense. The Schumann Resonances appear as the horizontal lines at 0.0, 4.0, 8.0, 12.0, 16.0, 20.0, 24.0, 28.0, 32.0, 36.0 & 40.0 Hz. This chart is based on Tomsk, Russia, time UTC +7 (UTC = Universal Time Coordinated).
What is a Spectrogram?
The Spectrogram Calendar is a visual representation of the range of frequencies in the magnetic field at a given location. Similar to how an equalizer displays the frequency content of music played on your stereo, the spectrogram calendar displays the frequency content of a magnetic field. Instead of showing a brief snapshot, it shows changes over a period of time, in this case 3 days.
The local magnetic field is a dynamic field that changes constantly because of variations in the ionosphere and sun and many other influences not yet fully understood. The range of variation displayed in the spectrogram chart is from 0 to 40 cycles per second. The vertical axis is frequency and the horizontal axis is time. The amplitude of a particular frequency at a specific time is represented by the intensity of color (green, yellow, white) of each point in the image.