Prince Harry and Meghan Markle fleeing the palace is a fairy tale to take the media heat off of Prince Andrew. How far and wide this scandal goes depends on how Buckingham Palace acts. But that is not easy since Prince Charles has his own connections to an earlier sex trafficker named Jimmy Savile, who was knighted. Now, the royal reporters and US media are focused on Harry and Meghan and their whereabouts in the colonies. The only Epstein stories appearing in the US is how the feds in a lower Manhattan lockup really became the Keystone Kops.
A new ‘impossible’ type of particle has been picked up by the Antarctic Impulsive Transient Antenna (ANITA) experiment’s particle detector balloon. According to researchers, particles which appeared to be “extremely high-energy neutrinos” detected by ANITA’s sensors have demonstrated the ability to travel ‘through’ our planet, something that should be impossible.
Jeffrey Epstein’s estate was sued on Wednesday by the U.S. Virgin Islands, which claimed that the late financier sexually abused and trafficked in dozens of young women and girls on his private Caribbean island. The Virgin Islands said his misconduct was much more extensive, continuing to as recently 2018 and involving girls as young as 11 or 12.
Twenty men in the United Kingdom have been convicted of raping and abusing more than a dozen teenage girls in the northern city of Huddersfield. The sentences have totaled 221 years in prison. Similar cases have erupted across South Yorkshire, with the National Crime Agency (NCA) reporting earlier this year that they believe upwards of 1,510 girls are believed to have been sexually exploited in the region over a 16-year period. The NCA said it had identified 110 people suspected of being part of child-grooming gangs in Rotherham, the largest town in South Yorkshire.
Cryptos are now manipulated like the banks/currencies system, yesterday [they] spammed BCHSV/USD was the best performing and today is loosing 20%.
Dutchsinse website/YT/Twitter and all the rest are showing no contents, not banned or closed or what… just valid but empty URLs. Apparently he’s only on Twitch.
Nicholas Wilson, a financial services whistleblower who was fired by UK law firm, Weightmans, after exposing millions of pounds in unfair customer charges, claims the City of London relies on “dirty money” and says the world economy would collapse if the City stopped laundering it. Mr Wilson, a former litigation manager, said: “The EU wanted to tighten up on money laundering and the UK was the only country who voted against it… Capitalism relies on a swash of dirty money which is moved around and supports investment around the world.”
Weekly Asteroid: In April 2017, a shiny fireball flew over the skies of Kyoto, Japan, raising questions about its potential origin and cosmic identity. Later, it was determined that the bright intruder belonged to a near-Earth asteroid called 2003 YT1. 2003 YT1, or 164121, is a binary asteroid that was discovered in 2003 and classified as a near-Earth object and potentially hazardous space rock, approximately 2 kilometres in diameter.
During a speech to the Annual Evaluation Meeting for 2019 at the Bestepe National Congress and Culture Centre in Ankara Turkish President Recep Tayyip Erdogan announced that the country will be sending troops to Libya under an agreement with the Government of National Accord. Erdogan added that Turkey will use both military and diplomatic means to ensure “stability” in Libya.
“The black boxes of the downed Boeing will be decoded in Ukraine. On January 15, the chairman of Iran’s aviation bureau and all specialists will come here, and decoding of the black boxes will start on January 20,” head of the Kiev Scientific Research Institute of Forensic Expertise Alexander Ruvin said after returning from Tehran.
A raid on a residential complex in Jerusalem has uncovered a “cult”-like group where dozens of women and children were being held against their will – including some girls who had their fingers placed into fires to “make them understand what hell is,” Israeli police say. The operation, which was carried out in an ultra-Orthodox neighborhood Monday, resulted in the arrests of the alleged ringleader and his eight female accomplices. They are suspected of isolating some 50 women in the complex, along with children ranging in age from 1-5, and keeping them out of contact with their families and the outside world.
Thousands of porn actors have reportedly been affected and face the danger of their sensitive information, from passports and credit cards to the most intimate details, such as scars and body measurements, could go public. This potentially puts them under the threat of extortion, stalking, shaming and job loss. The personal data and copies of documents of more than 4000 adult industry actors became accessible to strangers amid a data leak from an international porn company.
The timing of the media fuss over the alleged “Russian hack” of Burisma coincides with the resumption of the impeachment process by the Senate, say American academics, suggesting that the story could be a mere distraction aimed at evoking the specter of “Trump-Russia” collusion amid the 2020 election cycle.
News Burst 17 January 2020
Share this: Send the word out using these buttons!
On Wednesday, a day after India’s top court dismissed the mercy plea by two of the convicts in 2012 Nirbhaya gang rape and murder case, Delhi prison authorities have told Delhi High Court that due to one of the four convicted in the case pending petition for mercy to the President of India, there would be no execution of the four convicts on 22 January.
Two Iranian missiles struck down a Ukrainian passenger jet, the New York Times reported on Tuesday, posting verified security camera footage showing double projectiles gliding through the sky before hitting their target. The missiles were fired 30 seconds apart and help explain a mystery as to why the plane’s transponder was not working – it was disabled by the first strike, before being hit by a second, the Times said.
Lawyers for Michael Flynn, U.S. President Donald Trump’s former national security adviser, on Tuesday said in a court filing that he would seek to withdraw his guilty plea in former Special Counsel Robert Mueller’s investigation into alleged Russian interference in the 2016 presidential election. Flynn pleaded guilty in late 2017 to lying to the FBI about interactions with Russia’s ambassador to the United States in the weeks before Trump took office, but has since argued that prosecutors violated his rights and duped him into a plea agreement.
Sweden admits sending fake officer to NATO. The Swedish man had for many years worked with some of the nation’s top secrets. Not only did he make a career in the military intelligence service and work for the defence group Saab, he also held high military positions abroad – despite lacking a military education as such.
The Laser Interferometer Gravitational-Wave Observatory (LIGO) network of sensors designed specifically to detect gravitational waves has already detected at least two collisions of ultra-dense neutron stars, but has never picked up a phenomenon known as burst gravitational waves, until now. The LIGO and Virgo gravitational wave detectors reported an unanticipated “burst” of gravitational waves on January 14, possibly for the first time ever.
The Russian government has resigned, Prime Minister Dmitry Medvedev announced. The prime minister thinks it right that the current government should step down in the wake of the presidential proposals to amend the constitution, Medvedev told President Vladimir Putin’s meeting with the cabinet. “After those amendments are adopted — and it was said that this is likely to be done following discussion — there will be significant changes not only to a variety of constitution articles, but to the balance of power, namely to the executive, legislative and judicial branches of power,” the prime minister said.
Amazon and Walmart’s Flipkart have been hit with a barrage of criticism from India’s brick-and-mortar retailers who accuse the U.S. giants of violating Indian law with deep discounts and discriminating against small sellers by promoting select big ones.
Amazon said it will setup digital centers in 100 Indian cities and villages to help businesses get online to sell their goods and will offer support in marketing and logistics. The investment of $1 billion will help bring more than 10 million Indian businesses online and enable exports of India-made goods worth $10 billion by 2025, it added.
Amazon, which paid $0 in taxes, made more than $11 billion in profit in 2018—almost 16,000 times as much as the $690,000 donation for Australian bushfires recovery. Bezos himself could afford to contribute a great deal. By Business Insider’s calculations, Bezos’s income grew by $34 million per day in the past three months, meaning Bezos made approximately $690,000 every 30 minutes give or take.
Attorney Michael Avenatti was arrested by Internal Revenue Service (IRS) agents Tuesday evening during a break in a disciplinary hearing in Los Angeles over allegations that the high-profile lawyer scammed a client out of $840,000.
The National Security Agency has discovered a major security flaw in Microsoft’s Windows 10 operating system that could allow hackers to intercept seemingly secure communications, but rather than exploit the flaw for its own intelligence needs, the NSA tipped off Microsoft so that it can fix the system for everyone. In other words, somebody else had discovered it as well.
US Congressmen Adam Schiff and Jerry Nadler are among the seven lawmakers to be named as House of Representatives impeachment managers in the Senate trial of US President Donald Trump, the Office of House Speaker Nancy Pelosi announced in a statement on Wednesday.
Iranians called on social media on Wednesday (Jan 15) for fresh demonstrations a week after the shooting down of a passenger plane, seeking to turn the aftermath of the crash into a sustained campaign against Iran’s leadership. Protesters, with students at the forefront, have staged daily rallies in Tehran and other cities since Saturday.
The Pakistani army has been called-in to assist with relief efforts as many regions, particularly in the north of the country, continue to be ravaged by brutal, anomalous cold and snow. At least 100 people have died, with many more reported injured, as severe cold and heavy snowfall continued to lash parts of Pakistan on Wednesday, January 15. Northern parts have seen 62+ people die this week alone after avalanches buried some fifteen villages in Azad Jammu & Kashmir, according to the National Disaster Management Authority (NDMA). In addition, over 50 house were destroyed in the region. Furthermore, at least 25 people were killed and around 40 houses flattened in the province of Balochistan during the last 24 hours.
Active Weather
Tropical Cyclone Claudia – 35-50 kts↓ 998 hPa↑- W of Australia Moving W 10 kts↓
Strongest EQ in Europe M3.8 Kosovo Strongest EQ in US M3.2 Alaska Strongest EQ on the Planet M5.5 Kupang, Indonesia Deepest EQ M5.3 511 km South of Fiji Islands News Burst 16 January 2020
Share this: Send the word out using these buttons!
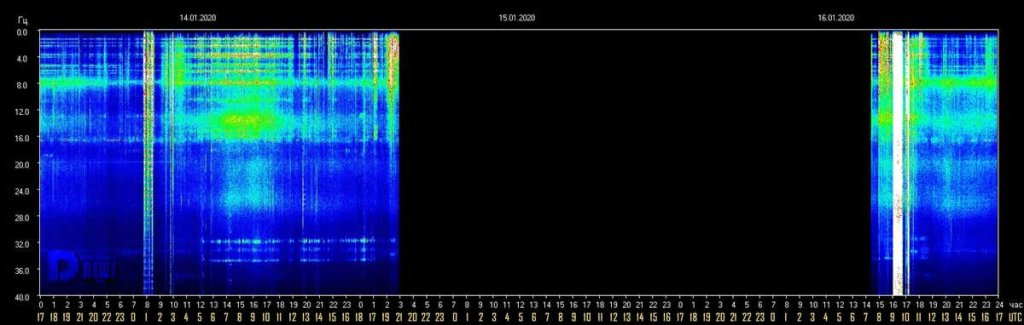
Editor’s Note: The Schumann Resonance graph was blank for over 35 hours before coming on-line and transmitting at 2:30am this morning. Almost immediate activity was shown with light activity beginning at 3:00am. from 4:00am through 5:00Am (EST, USA), a “whiteout” period of high-density, high amplitude energies were seen followed by a short 15 minute period for energies of the same structure.
Thanks for keeping your eyes tuned to these energies as the Earth begins her own vibratory and energetic ascent into a new dimension. Let ALL of humanity join her by BEing…
For over 35 straight hours the Schumann Resonance was void from showing any frequency coming in. THEN WHITEOUT BLAST! This is Mother Earth/GAIA changing time lines TO the New 5 D frequencies. A reset if you will. The reboot of the computer coming back on line. Now that the 5 D is taking a strong hold as it gets rid of the old 3 D Matrix she is physically changing as well. (Worldwide Earthquakes, Volcanoes, Sink holes, Floods, Fires Etc…) Like a snake shedding its old skin, like a caterpillar laying rest in a cocoon before it spreads its wings as a beautiful butterfly. This dormancy is a reset; a recalibration coming back online for the new Earth is giving birth. 💓 Be patient with yourself be patient with others because we are all going through a change and a transition as is GAIA/Mother Earth. We all will need to assist one another in this change that is taking place on Earth because this transition WILL NOT be easy for some as they don’t understand what and why this is taking place. COMPASSION, PATIENCE, UNDERSTANDING, GUIDANCE, LOVE….JUST KNOW “WE” ARE AT A DAWN OF A NEW AGE, NEW EARTH, HIGHER FREQUENCY WHERE WE ARE FINALLY COMING BACK ON LINE (DNA, Abilities will start to manifest slowly) WHERE “WE” HAVE BEEN DORMANT FOR WAY TOO LONG. “OUT WITH THE OLD IN WITH THE “NEW”! ☝💕💞💖 NOTHING BUT LOVE TO YOU ALL, ALWAYS ❣
Schumann Resonance Today. We will try to keep you updated about the variations of the Resonance with this page. The great variations that nobody can explain but that give us a clear sign that the planet is changing. The Earth is vibration higher and higher, just like us!
The Chart time is based on Tomsk – Russia – UTC (Universal Time Coordinated) +7Source
1/16 17:00 UTC – To summarize, the blackout started on January 14th at 8 pm and ended on the 16th at 7:30 am, 35 hours and 30 minutes. As the data returned we had the significant peak at 67 followed by a minor move to Power 25, today’s movements occurred from 9 to 10:15 UTC.
1/16 10:00 UTC – It seems that the blackout is over, and we find that there is a strong activity ongoing. At 9 UTC, about 2 hours after the data came back live, immediately a ‘pillar’ that reaches Power 68.
1/16 08:00 UTC – Still no data, we are entering the second consecutive day of total black, coincidence?
1/15 17:00 UTC – No changes, we are now beyond 21 hours of ‘darkness’.
1/15 12:00 UTC – Pitch black.
1/15 07:00 UTC – We are still in blackout mode, it is now about 12 hours from the last update. The last massive outage was exactly on almost same days in October 2019, started on October 13 to end on the 18th.
1/15 00:00 UTC – The chart stopped updating at 19:30 when a slight activity apparently started again, it is not uncommon to have some ‘blank’ hours every now and than.
1/13 17:00 UTC – The first part of today’s chart shows complete calm, from just after midnight UTC some slight movements started which slightly exceeded Power 10. A ‘background buzz’ then continued for the rest of the day.
1/13 17:00 UTC – Calm.
1/13 09:00 UTC – Today began with a slight ‘background’ activity around Power 10, these slight variations continued until 8 am. During this period, an isolated peak at Power 33 occurred at 4:15 UTC.
1/12 17:00 UTC – Only movement today at 5 am UTC has reached Power 25.
1/11 23:00 UTC – The Power 40 lasted almost 1 hour across 17 UTC, most of the time above Power 30
1/11 17:00 UTC – 31 hours of total calm until shortly after 16 UTC when a new activity started, and which is currently underway; so far the maximum amplitude has reached Power 40.
1/11 11:00 UTC – Total Calm.
1/10 17:00 UTC – After the first three previous ‘pillars’ there was also the fourth, between 8 and 9 UTC and reached Power 47. Today’s activity took place in the period from 2 am to 9 am UTC. In the amplitude graph, over the last 3 days, can be noted a gradual increase in the amplitude values and duration.
1/10 08:30 UTC – Yesterday we had a short series of isolated ‘pillars’, today the same thing but of greater magnitude, both in the maximum amplitude value and in the duration of the peaks. The first ‘introductory’ movement took place at 1 UTC at Power 20; the second peak was at Power 46 from 4 to 5 UTC; the last peak so far has been at Power 65 and lasted about 30 minutes from 5:30 UTC.
1/9 17:00 UTC – Calm.
1/9 10:30 UTC – Today’s chart is characterized by two major ‘pillars’ accompanied by others of smaller size, all isolated. The most significant: from 5:30 to 6 UTC at Power 50; from 6:30 to 7 UTC at Power 58; from 9:15 to 9:30 UTC at Power 25.
1/8 17:00 UTC – Calm.
1/8 08:30 UTC – For this first part of today’s chart nothing significant except a Pillar that lasted about 40 minutes and reached Power 18 at 4:15 UTC. The below news report of ‘something’ on the 6th, we had 18 hours of flat calm while… January 6th, something unexpected happened in the soil of northern Norway. “Electrical currents started flowing… It seemed to be some kind of shockwave… My instruments detected a sudden, strong variation in both ground currents and our local magnetic field” reported Rob Stammes, who monitors ground currents at the Polar Light Center geophysical observatory in Lofoten archipelago in NW Norway. NASA’s ACE spacecraft detected something as well. Approximately 15 minutes before the disturbance in Norway, the interplanetary magnetic field (IMF) near Earth abruptly swung around 180 degrees, and the solar wind density jumped more than 5-fold. The sudden surge at around 19:30 UTC. electroverse.net
1/7 17:00 UTC – Today’s chart shows a period of around 18 hours of flat calm, very few swings, it started at 8 am UTC yesterday and ended at 2 am UTC this morning. After this ‘silence’ some light background movements started, Power 15 was today’s maximum at 7 UTC.
1/6 17:00 UTC – Total Calm.
1/5 17:00 UTC – Calm.
1/5 8:00 UTC – Today, together with the second part of yesterday, was characterized by fairly powerful but isolated peaks; two have occurred, the first at Power 21 took place at 00 UTC, the second, much more powerful, reached Power 48 at 4:45 UTC.
1/4 17:00 UTC – Today the activity has almost been continuous, in the first part of the day shown on the graph the amplitude peaked around 15 while in the second half the variations were more sporadic but reached the peak of Power 43 at 13:40 UTC. The situation is now calm.
1/4 8:00 UTC – After the not so uncommon data blackout, but peculiar for it’s duration, the restored flow shows a light activity that topped several times between Power 13 and 15, maximum for now was at 6 UTC.
1/3 17:00 UTC – Calm until the end of the chart when some variations seems about to start.
1/3 10:00 UTC – We are back to normal operations after the data blackout which lasted approximately 17 hours. The first available data show a calm situation.
1/2 18:00 UTC – The publication of the new data stopped at 16 local time in Tomsk, corresponding to 9 UTC. So far the darkening has lasted 9 hours.
1/2 15:30 UTC – The activity continued in a very moderate way throughout the day, the maximum at about power 14 has been temporarily reached at 1 and 6 UTC.
1/1 17:00 UTC – The second part of today’s graph shows a marked increase in activity even if the peaks have remained relatively low. The movements started at 12 UTC and lasted until 17, the highest peak was at Power 25.
1/1 11:00 UTC – Today, like yesterday, it seems a calm day, the maximum values once again reached Power 10 momentarily around 6 am UTC.
12/31 17:00 UTC – Calm.
12/31 11:30 UTC – Calm.
12/30 17:00 UTC – Calm.
12/30 10:00 UTC – After yesterday’s very strong activity, the situation remained calm for about 9 hours until about 21 UTC (yesterday), when new moderate movements began which lasted almost 4 hours until 1:30 UTC. During this period the maximum amplitude value reached has been Power 30.
12/29 17:00 UTC – Today’s activity lasted 13 hours, from 23 (yesterday) to 12 UTC (today), the average was about Power 70 and only once, briefly for about 15 minutes around 8 UTC, the amplitude went below Power 40. Graphically it looks like a column of light.
12/29 13:30 UTC – In the second part of the day shown in the graph it is highlighted how the intensity of the variations has remained substantially unchanged and has generated the strongest peak of the day at Power 93. It seems that, suddenly as they started, the movements have rapidly dropped to normal values at 12 UTC.
12/29 09:00 UTC – The situation changed suddenly at 23 UTC when a series of movements began and led the amplitude values to reach Power 72 at 7 UTC, from that moment onward the amplitude remained on values between Power 65 and Power 80 with the peak maximum at Power 82 at 1:30 and 2 UTC.
12/28 17:00 UTC – Calm.
12/27 17:00 UTC – Calm.
12/27 13:30 UTC – What appears to be all of today’s activity took place in four hours, from 4 to 8 UTC. During this period there were 4 peaks, each stronger than the previous one, and the last one at 7:30 UTC at Power 38 was the strongest.
12/26 17:00 UTC – Calm.
12/25 17:00 UTC – The activity seems to be in slight and constant decline, today two slight peaks, the first at Power 18 at 3 UTC, the second at Power 12 at 12: 30 UTC.
12/24 17:00 UTC – Today’s activity lasted for about eight hours, from 2 to 10 UTC, the highest values occurred between 6 and 7: 30 UTC and reached Power 27.
12/23 17:00 UTC – Power 34 isolated at 10:30 UTC was all the activity for today.
12/22 17:00 UTC – Today we could say that total calm lasted only 4 hours, from 5 to 9 UTC, the variations for the rest of time were not significant, apart from those previously reported.
12/22 09:30 UTC – After several days of almost absolute calm, yesterday’s evening UTC time we had about 4 hours of significant activity, from 15 to 19 UTC. During this period the amplitude values remained for most of the time above Power 30 with the maximum at Power 37 at 18:30 UTC.
12/21 17:00 UTC – A slight activity began today in the last hours shown in the graph, the first change in amplitude occurred just before 5 UTC at Power 18 followed by minor variations. Shortly after 15 UTC the movements became more intense with first Power 31 and then the maximum of today’s chart at Power 35 just before 17 UTC.
12/20 17:00 UTC – Today it was still calm, the little variations seen in the graph reached Power 11.
12/19 17:00 UTC – Calm.
12/18 17:00 UTC – Technically we had an event that stands out as often happens lately on the 17th of the month, a peak at Power 17 on December 17th at 19 UTC (corresponding to today’s 2 am on the chart). For the rest, still calm.
12/17 17:00 UTC – Calm, many consecutive days of complete cam are not common.
12/16 17:00 UTC – Calm.
12/15 17:00 UTC – Another calm day, just a wriggle at 3 UTC that reached Power 15.
12/14 17:00 UTC – Calm.
12/13 17:00 UTC – Calm.
12/13 11:00 UTC – Significant activity even today and as in the last few days consisted mainly in isolated peaks. Those of today were 2, very strong, the first at 6 UTC reached Power 60, the second shortly after at 6:40 UTC reached Power 51.
12/12 17:00 UTC – Calm.
12/12 14:00 UTC – There we have it, the Coincidence 17 again today, the Amplitude has reached Power 74 between 16 and 17 on the chart. corresponding to 9-10 UTC. In this case we could start thinking about how many times it must happen before it becomes impossible…
12/12 07:30 UTC – It is clearly a time of pillars, even today we had 30 very intense minutes; from 6 to 6:30 UTC there was the first movement with the amplitude values that reached Power 63 shortly after 6 UTC.
12/11 17:00 UTC – Calm continued.
12/10 17:00 UTC – After the umpteenth “Coincidence 17” it has been calm.
12/10 11:30 UTC – Powerful activity once more, even if limited in time. It was calm until just after 3 UTC when a first isolated peak reached Power 54. From 5:30 to 6:30 it was the most intense part with the maximum value at Power 67. The last peak so far is was reached near 17 h on the chart, 10 UTC, and was at P50.
12/9 17:00 UTC – The short but intense period of activity was all for today.
12/9 11:30 UTC – It is no surprise that today this strong peak occurred and reached Power 74, it would have been a surprise if it had been a calm day. This strong series of movements lasted about 50 minutes, from 8:40 to 9:40 UTC, at 9:15 the maximum value.
12/8 17:00 UTC – Calm.
12/8 11:30 UTC – The situation today shows total calm until around 10 UTC when very slight variations in Amplitude started.
12/7 17:00 UTC – Much of today’s activity has been concentrated in the first part of the UTC day, from midnight until 6, where maximum values have been reached. Other slight sporadic variations at P15 also occurred at 10: 30 UTC.
12/7 09:00 UTC – After the record high of yesterday the variations continued sporadically at lower levels, the maximums were around Power 15. From midnight UTC a very active phase started again which kept the Amplitude above Power 50 for about 4 hours, from 1 to 5 UTC; during this period the maximum value achieved was Power 64.
12/6 17:00 UTC – After the incredible Amplitude spike at Power 158 other strong movements continued, the period of activity in which the Amplitude has been above 100 lasted about 1 hour, from 7:45 am to 8:45 UTC. At 10:30 UTC there was a further flicker at Power 28, after which a slight background activity continues.
12/6 10:30 UTC – The today’s graph began in a condition of general calm until 3 am UTC when the variations started. Immediately they reached Power 32 at 4 UTC; the movements continued with less magnitude until 7:45 UTC when some impressive movements started and reached Power 100 in around 15 minutes, at 8 UTC. This, despite the already impressive value, is still not the maximum for today, at 8:30 am the amplitude has further increased and reached an incredible Power 158, the most powerful peak of the last 2 years! In addition to the main and the amplitude graphs, the massive variation can also be seen in the other two charts, the Quality, which shows a value of 25, and that of the frequency of the SR, which shows a value of 8.80.
12/5 17:00 UTC – Calm.
12/4 17:00 UTC – Yesterday we saw a single peak, today the activity was very similar, 2 peaks, one at Power 23 at 21:30 UTC yesterday and another today at Power 19 this morning at 1:30 UTC. For the rest of the day it was calm.
12/3 17:00 UTC – Total calm, the only wriggle at 7 UTC reached Power 13.
12/2 17:00 UTC – Today the activity was not long lasting but very intense, in addition to the previous peak, which marked the beginning of the active period at 8:30 UTC, after a while, at 9 UTC, there was the maximum of today at Power 55, this was followed shortly after by a further movement on the 30s after which, from 10 UTC, the calm returned. Still, another movement around 17 hours of the graph.
12/2 09:30 UTC – Today’s chart shows once again a stato of calm, the last significant peak at Power 20 was Nov. 30 at 19 UTC so it took about 36 hours before the amplitude values returned above P10. Today, however, it’s back, the peak was at Power 37 8:30 UTC.
12/1 17:00 UTC – A single peak isolated at Power 25 in the first part of today’s chart and then calm.
Frequency means how many wave cycle happen in a second, 1 Hz. means 1 cycle per second, 40 Hz. means 40 cycles per second, Amplitude is the size of the vibration, how big is the wave, the chart shows the frequency variation in Hz and the amplitude using the white color.
Note
The Ancient Indian Rishis called 7.83 Hz the frequency of OM. It also happens to be Mother Earth’s natural heartbeat rhythm Schumann resonances are named after professor Schumann who was involved in early German secret space program and was later paper-clipped into the United States. The frequencies of Schumann resonances are fairly stable and are mainly defined by the physical size of the ionospheric cavity. The amplitude of Schumann resonances does change and is bigger when ionospheric plasma gets excited. Ionospheric plasma excitation happens because of solar activity, thunderstorms, use of scalar plasma weapons and HAARP and lately also when the Light forces are clearing the plasma anomaly.
Dependencies of Amplitudes Schumann Resonance January 16 2020
Dependencies of Quality Schumann Resonance January 16 2019
Dependencies of Frequency Schumann Resonance January 16 2019
All the SR daily images in one single pageSee the Images
Explanation of The Chart
The Schumann Resonance Spectrogram Chart
The Schumann Resonance Chart displays data from the magnetic field detector to monitor the resonances occurring in the plasma waves constantly circling the earth in the ionosphere. These three days spectrograms show the activity occurring at the various resonant frequencies from 1 to 40 Hz. Within the spectrogram, the power, or intensity level of each frequency is displayed as a color, with white being the most intense. The Schumann Resonances appear as the horizontal lines at 0.0, 4.0, 8.0, 12.0, 16.0, 20.0, 24.0, 28.0, 32.0, 36.0 & 40.0 Hz. This chart is based on Tomsk, Russia, time UTC +7 (UTC = Universal Time Coordinated).
What is a Spectrogram?
The Spectrogram Calendar is a visual representation of the range of frequencies in the magnetic field at a given location. Similar to how an equalizer displays the frequency content of music played on your stereo, the spectrogram calendar displays the frequency content of a magnetic field. Instead of showing a brief snapshot, it shows changes over a period of time, in this case 3 days.
The local magnetic field is a dynamic field that changes constantly because of variations in the ionosphere and sun and many other influences not yet fully understood. The range of variation displayed in the spectrogram chart is from 0 to 40 cycles per second. The vertical axis is frequency and the horizontal axis is time. The amplitude of a particular frequency at a specific time is represented by the intensity of color (green, yellow, white) of each point in the image.
According to Area 1, the Silicon Valley security firm that allegedly detected the hacking, Russian hackers from a military intelligence unit known formerly as the G.R.U., and to private researchers by the alias “Fancy Bear,” used so-called phishing emails that appear designed to steal usernames and passwords, to gain access to Burisma’s network. Burisma is the Ukrainian energy firm that VP Biden’s son was paid $50,000 per month as a board member.
Nicola Sturgeon, First Minister of Scotland and leader of the Scottish National Party wrote to UK Prime Minister Boris Johnson to request a second independence referendum. Boris Johnson wrote back refusing her request.
Reacting swiftly to developments within the British royal family, several companies are looking to sell their merchandise while poking fun at the Duke and Duchess of Sussex. Mere hours after the Duke and Duchess of Sussex announced their plans, Ikea Italy posted an advert for cardboard moving boxes on Instagram which said: “Meghan, Harry. We understand you, we are made to change”.
Taal volcano in the Philippines could spew lava and ash for weeks, authorities warned, leaving thousands in limbo after they fled their homes fearing a massive eruption. The crater of the volcano exploded to life with towering clouds of ash and jets of red-hot lava on Sunday, forcing those living around the mountain south of Manila to flee to safety.
Six people died, 15 were injured and another 10 remain missing after a large sinkhole swallowed a bus carrying pedestrians in northwestern China on Monday afternoon, according to China’s Xinhua News Agency.
India’s Supreme Court on Tuesday dismissed pleas for a review of the death sentence handed down to four men in the rape and murder of a young woman on a New Delhi bus, leaving an appeal to the president as their only possible recourse. The 2012 attack on the 23-year old physiotherapy student on the moving bus shocked India and led to tough new laws against sexual violence, including the death penalty for rape in some cases. Last week, a Delhi court said they would be hanged on Jan 22.
A Delta flight from Los Angeles International Airport to Shanghai made an emergency U-turn on Tuesday, dumping fuel on approximately 30 schoolchildren as it returned to LAX. Students at Park Avenue Elementary School were exposed to an unknown type of fuel [kerosene], and were evaluated by paramedics on scene.
Putin playfully urges Syria’s Assad to host Trump visit while touring biblical site.
A huge fire broke out at a chemical plant in Tarragona, Spain following an explosion at the site. One person is reported dead and another six injured. The blast was reported at around 6:40pm local time on Tuesday in the Catalonian port city which attracts tourists with its numerous Roman-era ruins.
Ukraine’s Supreme Anti-Corruption Court has obliged the National Anti-Corruption Bureau (NABU) to launch a probe into seizure of government power and corruption suspicions. The cases mention the names of the United States’ 44th president, Barack Obama, former Ukrainian president, Pyotr Poroshenko and ex-US vice-president, Joseph Biden, a member of the Ukrainian parliament from the Opposition Platform – For Life party, Renat Kuzmin, said on Tuesday.
Amazon’s founder and chief executive Jeff Bezos arrived in India Tuesday and was welcomed with a new antitrust case. The Competition Commission of India (CCI) on Monday ordered an investigation into alleged malpractices by Flipkart and Amazon India as far as the issue of deep discounting and practice of preferred sellers of mobile phones by both the retailers was concerned.
Active Weather
Tropical Cyclone Claudia – 50-70 kts↓ 989 hPa↑- W of Australia Moving W 11 kts
Strongest EQ in Europe M3.4 Greece Strongest EQ in US M3.7 Alaska Strongest EQ on the Planet M5.1 Argentina Deepest EQ M4.2 256 km Argentina News Burst 15 January 2020
Share this: Send the word out using these buttons!
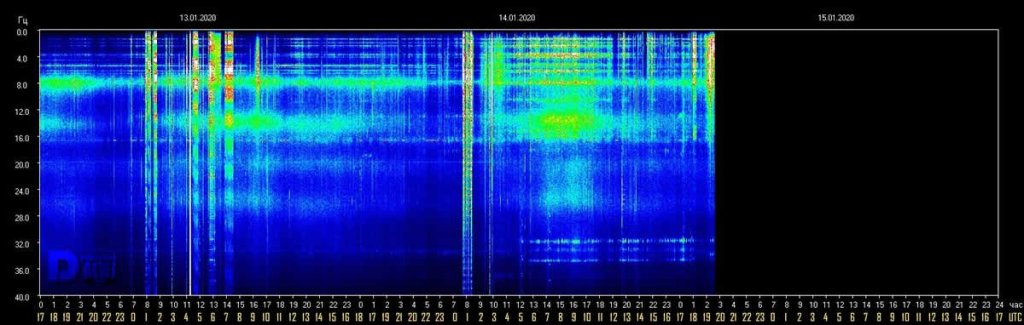
Editor’s Note: Almost 22 hours have gone by without any transmission for the Schumann Resonance graph from Tomsk, Russia. Just before this transmission ended, we were beginning to see a light release for this energies when the graph blanked out.
Please stay aware of energies arriving on Earth, know there purpose, and BE…
Schumann Resonance Today. We will try to keep you updated about the variations of the Resonance with this page. The great variations that nobody can explain but that give us a clear sign that the planet is changing. The Earth is vibration higher and higher, just like us!
The Chart time is based on Tomsk – Russia – UTC (Universal Time Coordinated) +7Source
1/15 17:00 UTC – No changes, we are now beyond 21 hours of ‘darkness’.
1/15 12:00 UTC – Pitch black.
1/15 07:00 UTC – We are still in blackout mode, it is now about 12 hours from the last update. The last massive outage was exactly on almost same days in October 2019, started on October 13 to end on the 18th.
1/15 00:00 UTC – The chart stopped updating at 19:30 when a slight activity apparently started again, it is not uncommon to have some ‘blank’ hours every now and than.
1/13 17:00 UTC – The first part of today’s chart shows complete calm, from just after midnight UTC some slight movements started which slightly exceeded Power 10. A ‘background buzz’ then continued for the rest of the day.
1/13 17:00 UTC – Calm.
1/13 09:00 UTC – Today began with a slight ‘background’ activity around Power 10, these slight variations continued until 8 am. During this period, an isolated peak at Power 33 occurred at 4:15 UTC.
1/12 17:00 UTC – Only movement today at 5 am UTC has reached Power 25.
1/11 23:00 UTC – The Power 40 lasted almost 1 hour across 17 UTC, most of the time above Power 30
1/11 17:00 UTC – 31 hours of total calm until shortly after 16 UTC when a new activity started, and which is currently underway; so far the maximum amplitude has reached Power 40.
1/11 11:00 UTC – Total Calm.
1/10 17:00 UTC – After the first three previous ‘pillars’ there was also the fourth, between 8 and 9 UTC and reached Power 47. Today’s activity took place in the period from 2 am to 9 am UTC. In the amplitude graph, over the last 3 days, can be noted a gradual increase in the amplitude values and duration.
1/10 08:30 UTC – Yesterday we had a short series of isolated ‘pillars’, today the same thing but of greater magnitude, both in the maximum amplitude value and in the duration of the peaks. The first ‘introductory’ movement took place at 1 UTC at Power 20; the second peak was at Power 46 from 4 to 5 UTC; the last peak so far has been at Power 65 and lasted about 30 minutes from 5:30 UTC.
1/9 17:00 UTC – Calm.
1/9 10:30 UTC – Today’s chart is characterized by two major ‘pillars’ accompanied by others of smaller size, all isolated. The most significant: from 5:30 to 6 UTC at Power 50; from 6:30 to 7 UTC at Power 58; from 9:15 to 9:30 UTC at Power 25.
1/8 17:00 UTC – Calm.
1/8 08:30 UTC – For this first part of today’s chart nothing significant except a Pillar that lasted about 40 minutes and reached Power 18 at 4:15 UTC. The below news report of ‘something’ on the 6th, we had 18 hours of flat calm while… January 6th, something unexpected happened in the soil of northern Norway. “Electrical currents started flowing… It seemed to be some kind of shockwave… My instruments detected a sudden, strong variation in both ground currents and our local magnetic field” reported Rob Stammes, who monitors ground currents at the Polar Light Center geophysical observatory in Lofoten archipelago in NW Norway. NASA’s ACE spacecraft detected something as well. Approximately 15 minutes before the disturbance in Norway, the interplanetary magnetic field (IMF) near Earth abruptly swung around 180 degrees, and the solar wind density jumped more than 5-fold. The sudden surge at around 19:30 UTC. electroverse.net
1/7 17:00 UTC – Today’s chart shows a period of around 18 hours of flat calm, very few swings, it started at 8 am UTC yesterday and ended at 2 am UTC this morning. After this ‘silence’ some light background movements started, Power 15 was today’s maximum at 7 UTC.
1/6 17:00 UTC – Total Calm.
1/5 17:00 UTC – Calm.
1/5 8:00 UTC – Today, together with the second part of yesterday, was characterized by fairly powerful but isolated peaks; two have occurred, the first at Power 21 took place at 00 UTC, the second, much more powerful, reached Power 48 at 4:45 UTC.
1/4 17:00 UTC – Today the activity has almost been continuous, in the first part of the day shown on the graph the amplitude peaked around 15 while in the second half the variations were more sporadic but reached the peak of Power 43 at 13:40 UTC. The situation is now calm.
1/4 8:00 UTC – After the not so uncommon data blackout, but peculiar for it’s duration, the restored flow shows a light activity that topped several times between Power 13 and 15, maximum for now was at 6 UTC.
1/3 17:00 UTC – Calm until the end of the chart when some variations seems about to start.
1/3 10:00 UTC – We are back to normal operations after the data blackout which lasted approximately 17 hours. The first available data show a calm situation.
1/2 18:00 UTC – The publication of the new data stopped at 16 local time in Tomsk, corresponding to 9 UTC. So far the darkening has lasted 9 hours.
1/2 15:30 UTC – The activity continued in a very moderate way throughout the day, the maximum at about power 14 has been temporarily reached at 1 and 6 UTC.
1/1 17:00 UTC – The second part of today’s graph shows a marked increase in activity even if the peaks have remained relatively low. The movements started at 12 UTC and lasted until 17, the highest peak was at Power 25.
1/1 11:00 UTC – Today, like yesterday, it seems a calm day, the maximum values once again reached Power 10 momentarily around 6 am UTC.
12/31 17:00 UTC – Calm.
12/31 11:30 UTC – Calm.
12/30 17:00 UTC – Calm.
12/30 10:00 UTC – After yesterday’s very strong activity, the situation remained calm for about 9 hours until about 21 UTC (yesterday), when new moderate movements began which lasted almost 4 hours until 1:30 UTC. During this period the maximum amplitude value reached has been Power 30.
12/29 17:00 UTC – Today’s activity lasted 13 hours, from 23 (yesterday) to 12 UTC (today), the average was about Power 70 and only once, briefly for about 15 minutes around 8 UTC, the amplitude went below Power 40. Graphically it looks like a column of light.
12/29 13:30 UTC – In the second part of the day shown in the graph it is highlighted how the intensity of the variations has remained substantially unchanged and has generated the strongest peak of the day at Power 93. It seems that, suddenly as they started, the movements have rapidly dropped to normal values at 12 UTC.
12/29 09:00 UTC – The situation changed suddenly at 23 UTC when a series of movements began and led the amplitude values to reach Power 72 at 7 UTC, from that moment onward the amplitude remained on values between Power 65 and Power 80 with the peak maximum at Power 82 at 1:30 and 2 UTC.
12/28 17:00 UTC – Calm.
12/27 17:00 UTC – Calm.
12/27 13:30 UTC – What appears to be all of today’s activity took place in four hours, from 4 to 8 UTC. During this period there were 4 peaks, each stronger than the previous one, and the last one at 7:30 UTC at Power 38 was the strongest.
12/26 17:00 UTC – Calm.
12/25 17:00 UTC – The activity seems to be in slight and constant decline, today two slight peaks, the first at Power 18 at 3 UTC, the second at Power 12 at 12: 30 UTC.
12/24 17:00 UTC – Today’s activity lasted for about eight hours, from 2 to 10 UTC, the highest values occurred between 6 and 7: 30 UTC and reached Power 27.
12/23 17:00 UTC – Power 34 isolated at 10:30 UTC was all the activity for today.
12/22 17:00 UTC – Today we could say that total calm lasted only 4 hours, from 5 to 9 UTC, the variations for the rest of time were not significant, apart from those previously reported.
12/22 09:30 UTC – After several days of almost absolute calm, yesterday’s evening UTC time we had about 4 hours of significant activity, from 15 to 19 UTC. During this period the amplitude values remained for most of the time above Power 30 with the maximum at Power 37 at 18:30 UTC.
12/21 17:00 UTC – A slight activity began today in the last hours shown in the graph, the first change in amplitude occurred just before 5 UTC at Power 18 followed by minor variations. Shortly after 15 UTC the movements became more intense with first Power 31 and then the maximum of today’s chart at Power 35 just before 17 UTC.
12/20 17:00 UTC – Today it was still calm, the little variations seen in the graph reached Power 11.
12/19 17:00 UTC – Calm.
12/18 17:00 UTC – Technically we had an event that stands out as often happens lately on the 17th of the month, a peak at Power 17 on December 17th at 19 UTC (corresponding to today’s 2 am on the chart). For the rest, still calm.
12/17 17:00 UTC – Calm, many consecutive days of complete cam are not common.
12/16 17:00 UTC – Calm.
12/15 17:00 UTC – Another calm day, just a wriggle at 3 UTC that reached Power 15.
12/14 17:00 UTC – Calm.
12/13 17:00 UTC – Calm.
12/13 11:00 UTC – Significant activity even today and as in the last few days consisted mainly in isolated peaks. Those of today were 2, very strong, the first at 6 UTC reached Power 60, the second shortly after at 6:40 UTC reached Power 51.
12/12 17:00 UTC – Calm.
12/12 14:00 UTC – There we have it, the Coincidence 17 again today, the Amplitude has reached Power 74 between 16 and 17 on the chart. corresponding to 9-10 UTC. In this case we could start thinking about how many times it must happen before it becomes impossible…
12/12 07:30 UTC – It is clearly a time of pillars, even today we had 30 very intense minutes; from 6 to 6:30 UTC there was the first movement with the amplitude values that reached Power 63 shortly after 6 UTC.
12/11 17:00 UTC – Calm continued.
12/10 17:00 UTC – After the umpteenth “Coincidence 17” it has been calm.
12/10 11:30 UTC – Powerful activity once more, even if limited in time. It was calm until just after 3 UTC when a first isolated peak reached Power 54. From 5:30 to 6:30 it was the most intense part with the maximum value at Power 67. The last peak so far is was reached near 17 h on the chart, 10 UTC, and was at P50.
12/9 17:00 UTC – The short but intense period of activity was all for today.
12/9 11:30 UTC – It is no surprise that today this strong peak occurred and reached Power 74, it would have been a surprise if it had been a calm day. This strong series of movements lasted about 50 minutes, from 8:40 to 9:40 UTC, at 9:15 the maximum value.
12/8 17:00 UTC – Calm.
12/8 11:30 UTC – The situation today shows total calm until around 10 UTC when very slight variations in Amplitude started.
12/7 17:00 UTC – Much of today’s activity has been concentrated in the first part of the UTC day, from midnight until 6, where maximum values have been reached. Other slight sporadic variations at P15 also occurred at 10: 30 UTC.
12/7 09:00 UTC – After the record high of yesterday the variations continued sporadically at lower levels, the maximums were around Power 15. From midnight UTC a very active phase started again which kept the Amplitude above Power 50 for about 4 hours, from 1 to 5 UTC; during this period the maximum value achieved was Power 64.
12/6 17:00 UTC – After the incredible Amplitude spike at Power 158 other strong movements continued, the period of activity in which the Amplitude has been above 100 lasted about 1 hour, from 7:45 am to 8:45 UTC. At 10:30 UTC there was a further flicker at Power 28, after which a slight background activity continues.
12/6 10:30 UTC – The today’s graph began in a condition of general calm until 3 am UTC when the variations started. Immediately they reached Power 32 at 4 UTC; the movements continued with less magnitude until 7:45 UTC when some impressive movements started and reached Power 100 in around 15 minutes, at 8 UTC. This, despite the already impressive value, is still not the maximum for today, at 8:30 am the amplitude has further increased and reached an incredible Power 158, the most powerful peak of the last 2 years! In addition to the main and the amplitude graphs, the massive variation can also be seen in the other two charts, the Quality, which shows a value of 25, and that of the frequency of the SR, which shows a value of 8.80.
12/5 17:00 UTC – Calm.
12/4 17:00 UTC – Yesterday we saw a single peak, today the activity was very similar, 2 peaks, one at Power 23 at 21:30 UTC yesterday and another today at Power 19 this morning at 1:30 UTC. For the rest of the day it was calm.
12/3 17:00 UTC – Total calm, the only wriggle at 7 UTC reached Power 13.
12/2 17:00 UTC – Today the activity was not long lasting but very intense, in addition to the previous peak, which marked the beginning of the active period at 8:30 UTC, after a while, at 9 UTC, there was the maximum of today at Power 55, this was followed shortly after by a further movement on the 30s after which, from 10 UTC, the calm returned. Still, another movement around 17 hours of the graph.
12/2 09:30 UTC – Today’s chart shows once again a stato of calm, the last significant peak at Power 20 was Nov. 30 at 19 UTC so it took about 36 hours before the amplitude values returned above P10. Today, however, it’s back, the peak was at Power 37 8:30 UTC.
12/1 17:00 UTC – A single peak isolated at Power 25 in the first part of today’s chart and then calm.
Frequency means how many wave cycle happen in a second, 1 Hz. means 1 cycle per second, 40 Hz. means 40 cycles per second, Amplitude is the size of the vibration, how big is the wave, the chart shows the frequency variation in Hz and the amplitude using the white color.
Note
The Ancient Indian Rishis called 7.83 Hz the frequency of OM. It also happens to be Mother Earth’s natural heartbeat rhythm Schumann resonances are named after professor Schumann who was involved in early German secret space program and was later paper-clipped into the United States. The frequencies of Schumann resonances are fairly stable and are mainly defined by the physical size of the ionospheric cavity. The amplitude of Schumann resonances does change and is bigger when ionospheric plasma gets excited. Ionospheric plasma excitation happens because of solar activity, thunderstorms, use of scalar plasma weapons and HAARP and lately also when the Light forces are clearing the plasma anomaly.
Dependencies of Amplitudes Schumann Resonance January 15 2020
Dependencies of Quality Schumann Resonance January 15 2019
Dependencies of Frequency Schumann Resonance January 15 2019
All the SR daily images in one single pageSee the Images
Explanation of The Chart
The Schumann Resonance Spectrogram Chart
The Schumann Resonance Chart displays data from the magnetic field detector to monitor the resonances occurring in the plasma waves constantly circling the earth in the ionosphere. These three days spectrograms show the activity occurring at the various resonant frequencies from 1 to 40 Hz. Within the spectrogram, the power, or intensity level of each frequency is displayed as a color, with white being the most intense. The Schumann Resonances appear as the horizontal lines at 0.0, 4.0, 8.0, 12.0, 16.0, 20.0, 24.0, 28.0, 32.0, 36.0 & 40.0 Hz. This chart is based on Tomsk, Russia, time UTC +7 (UTC = Universal Time Coordinated).
What is a Spectrogram?
The Spectrogram Calendar is a visual representation of the range of frequencies in the magnetic field at a given location. Similar to how an equalizer displays the frequency content of music played on your stereo, the spectrogram calendar displays the frequency content of a magnetic field. Instead of showing a brief snapshot, it shows changes over a period of time, in this case 3 days.
The local magnetic field is a dynamic field that changes constantly because of variations in the ionosphere and sun and many other influences not yet fully understood. The range of variation displayed in the spectrogram chart is from 0 to 40 cycles per second. The vertical axis is frequency and the horizontal axis is time. The amplitude of a particular frequency at a specific time is represented by the intensity of color (green, yellow, white) of each point in the image.