A top government official in France has admitted that draconian lockdown measures being imposed on the rest of the population shouldn’t be implemented in the country’s migrant-heavy ghettos in order to prevent riots. In a letter leaked to magazine Le Canard Enchaine, French Secretary of State to the Ministry of the Interior Laurent Nunez advises, “It is not a priority to enforce closings in certain neighborhoods and to stop gatherings.”
The Japan Environment Agency expressed fears the approaching rainy season could jeopardize the safekeeping of piles of contaminated waste collected after the 2011 nuclear disaster. It said March 17 there was a risk of bulk plastic bags stored at 12 temporary sites in six municipalities in Fukushima Prefecture being swept away through the erosion of riverbanks caused by flooding, as well as mudslides and landslides triggered by torrential rains. Officials are desperate to prevent a repeat of what happened last October when Typhoon No. 19 swept hundreds of bags into a river. The ministry said its preventive measures will include transporting stockpiles to other temporary storage facilities and fencing in sites before the rainy season starts in May. Fukushima Prefecture has 721 temporary sites.
President Hassan Rouhani told members of his cabinet on Sunday that Iran’s record of dealing with the coronavirus epidemic “is acceptable” compared with other countries. He claimed that in some provinces there is “improvement”, while critics say his government’s response has been slow, chaotic and sometimes self-contradictory. Alireza Vahabzadeh, an adviser to Iran’s health minister, tweeted on March 29 that the death toll has risen to 2,640 and the number of infected people has reached 38,309. While the health ministry has issued mostly linear numbers since the outbreak was announced on February 19, Radio Farda’s independent estimate puts the number of deaths at 4,300 and cases of hospitalization at twice the government’s official figure for infections.
Why nationalize the US banks when you can just nationalize the Federal Reserve? That’s in essence what the White House did Friday by putting the Fed under Treasury Department supervision. But it does not stop there. President Trump is now the world’s banker as he takes control of the Fed’s balance sheet folding it into Treasury’s Exchange Stabilization Fund, which will now contain the International Monetary Fund’s Special Drawing Rights. Treasury Secretary Steve Mnuchin now will be the 800-lbs gorilla in all debt markets, not just the Treasury market. Commercial Paper, Asset-back securities, corporate bonds and bond ETFs and small business loans are just a few of the markets the administration will be securing through the Exchange Stabilization Fund. Blackrock will be the firm executing all these trades using the Fed’s balance sheet but employing Treasury’s new special purchase vehicles to lawfully prop up these flagging markets. Is this the first step towards ending the Federal Reserve? Unknowable right now, but should this operation last through the end of the year, the Treasury Department will control the majority of US and corporate debt markets directly.
Japan is moving to refuse entry to all foreign nationals travelling on U.S. passports or who have been in the United States for the past two weeks. Discussions are still being held to decide whether the measure would cover all of the United States or just certain parts, government sources said. The restriction applies even to Japanese nationals returning from the United States.
Upon hearing that a new coronavirus had emerged in Wuhan in the Hubei province, local authorities’ first instinct, as we know, was to suppress the information. Police reprimanded whistleblowers like the Wuhan-based doctor Li Wenliang, who subsequently died of the disease. This should have motivated Chinese leaders to weigh the costs of censorship and reconsider the appointment of unqualified party members to key public-health positions. The head of the Hubei Provincial Health Commission, dismissed during the crisis, had no medical training or experience in the public-health sector. Moreover, some other countries, especially Singapore and Taiwan, managed to contain the COVID-19 outbreak without incurring the high costs that China did when it placed at least 760 million Chinese under varying degrees of residential lockdown. China’s leaders should be looking to these countries for lessons on smarter crisis response. But, far from learning from past mistakes, China’s leaders are trying to cover them up. As virtually the entire global economy effectively shuts down to contain the China-born virus and deaths in Italy — the pandemic’s new epicenter — exceed 7,500, the Chinese Communist Party has shifted its propaganda machine into high gear. Its goal: change the narrative of the COVID-19 crisis. At home, this has meant touting the CCP’s leadership in mobilizing the country to “win the war” against the virus. It has also meant encouraging the spread on Chinese social media of exaggerated or outright false stories about Western democracies’ “inept” responses to the outbreak. Abroad, China’s propaganda machine is trumpeting declining infection rates as evidence that strong centralized leadership is more effective than democratic governance. Meanwhile, the government is sending humanitarian assistance — including health care workers and medical supplies — to hard-hit countries like Iran, Italy and the Philippines. But if Chinese leaders hope to use the COVID-19 pandemic to build and project soft power, they are likely to be sorely disappointed. For starters, the world is nowhere near ready to forget the role that its initial cover-up played in allowing the virus to spread.
The coronavirus pandemic led to a rare surge of online posts in Thailand questioning the monarchy on Sunday and a government minister subsequently warned that inappropriate posts could lead to jail. Insulting the monarchy is a crime, punishable by up to 15 years in prison. A Thai-language hashtag that translates to #whydoweneedaking? was one of the top trending topics on Twitter in Thailand after an overseas Thai activist posted about King Maha Vajiralongkorn continuing to travel in Germany during the coronavirus crisis. King Vajiralongkorn, 67, who was crowned last year, has a second home in Germany. He spends much of his time outside Thailand.
The Dutch government has recalled over half a million face masks it imported from China after discovering that they were faulty. The Netherlands said on Saturday that it had asked its hospitals to return around 600,000 face masks which health professionals are using to treat patients of the coronavirus. The NOS reported that the faulty masks fail to meet safety requirements because they did not fit on the faces of doctors and nurses and were failing to prevent particles of the virus passing through.
The Chinese embassy in Madrid said on 26 March that the Spanish government had bought a batch of faulty COVID-19 testing kits from an unauthorised Chinese company called Shenzhen Bioeasy Biotechnology. “The Chinese ministry of commerce offered Spain a list of certified providers, which did not include Shenzhen Bioeasy Biotechnology. Shenzhen Bioeasy Biotechnology has not yet been licensed by the Chinese National Medical Products Administration to sell its products,” said the Chinese Embassy. The Spanish association of microbiologists (SEIMC) warned that the testing kits in this batch performed with an accuracy level of under 30%.
After plunging into Friday’s close, US equity futures markets are extending losses at the open after President Trump extended the virus guidelines (lockdown) until April 30th. Dow futures have erased most of Thursday’s surge gains. But oil was the big mover as WTI plunged as much as 7.5% to a $19 handle, the lowest since early 2002.
Qatar Airways will have to seek government support eventually, Chief Executive Akbar al-Baker said, warning the Middle East carrier could soon run out of cash needed to continue flying. Several states have already stepped in to help airlines that have seen demand decimated almost overnight by the coronavirus outbreak, with the United States offering $58 billion in aid. Qatar Airways is one of few airlines continuing to maintain scheduled commercial passenger services and over the next two weeks expects to operate 1,800 flights. “We have received many requests from governments all over the world, embassies in certain countries, requesting Qatar Airways not to stop flying,” Baker said, however, he warned the airline was burning through cash and only had enough to sustain operations for a “very short period of time”.
Some 10,521 foreigners in Cambodia, the bulk being from the UK, have signed an online petition calling on British Prime Minister Boris Johnson and relevant officials to fly them out of the Kingdom. The petition is targeted at 15,000 foreigners. Among them are nearly 200 Europeans, the majority being British nationals, who are stranded in Cambodia after airlines cancelled their flights, according to the list shared in a Facebook group “Stranded in Cambodia UK”.
A light plane evacuating a patient to Japan crashed and exploded shortly after takeoff from the Ninoy Aquino International Airport last night, killing all eight people on board that included a medical evacuation crew, the Canadian patient and an American. The Philippine-registered Lion Air West Wing was bound for Tokyo’s Haneda Airport in Japan and had just taken off from Runway 24 when it turned into a fireball at past 8 p.m. yesterday.
Sun Activity
Sunspot number: 0 Spotless Days Current Stretch: 19 days 2020 total: 67 days (78%) 2019 total: 281 days (77%)
Strongest EQ in Europe M4.5 Greece Strongest EQ in North America M3.6 Texas Strongest EQ on the Planet M5.6 New Caledonia Deepest EQ M5.2 98 km Papua New Guinea News Burst 30 March 2020
Share this: Send the word out using these buttons!
Nesara Discernment Transition. Commander Hatonn. By Gabriel RL/Neva
It is the information age. It is the time of reflection. It is time for you to discover yourself, your own truths. In many cases, you may not like what you will find within you.
We are here to inspire you with this truth, to inspire you the importance of you recognizing yourself and you seeing your weaknesses, your fears, taking the reins of your own lives confronting yourself many times.
You need to anchor to your hearts knowing what you want. A house built on the sand, without foundations, it cannot be sustained when the first wave comes. A house that is built on rocks, well founded, it will stay.
You need to be well supported in yourself so that when a lot of information will come to you, information that in some cases might be in disagreement with that inner truth that makes you good, that makes you happy, that brings you peace, you will not fall into discouragement, sadness and anger, but also know that if you continue to hold on to truths that you try to use to camouflage certain things that need to be cured, you will have a strong shock.
When we will arrive with our fleets we will transmit a universal truth that is beyond any paradigm ever built on Earth, that is beyond even the most sublime truth that you believe while on Earth.
Castle on Sand
Nesara Discernment Transition
What we have to say is much greater than anything you’ve ever heard. You have heard about NESARA, what it will do and the changes it will bring.
NESARA is a continuation, an important continuator of this process of change and transformation that will come as a planetary aid, and not exactly individual.
No one will put their hands on these resources so well guarded and secured by the great fraternities that bless the Earth under the regency of Count Saint Germain, Kuan Yin and the Great Positive Dragons of this planet.
NESARA is a continuation
Nesara Discernment Transition
The resources that will arrive will help the most needy and will have the coordination of humble and simple minds, not greedy, not proud, not vain, not overbearing, not dangerous.
There will be no sweepstakes to see who deserves more or who deserves less, there will be no ones, best ones, chosen for good behavior.
I say this using your language on Earth, especially to those souls that have been prepared for millennia for these transmissions. We have already warned our beloved transmitter, with this energy code-named Neva, that these resources will be in the hands of those more balanced and anyone with intention of putting their hands for their own purposes will not be authorized.
If you have incurred debts, honor your debts. If resources were unfairly taken away, with abusive interest or any other form of illegal theft, you will be satisfied and compensated at all levels.
Abundance and Prosperity
Nesara Discernment Transition
But first, your minds need to be calm and without these worries, because we are not your bankers, we are not your financial managers, we are not your advisers, we are not your investors.
We are your brothers and sisters working here from space, collaborating for this Planetary Liberation Plan and we see you as our partners in this endeavor.
While your Earth is going through a major cleansing and purification process through this viral calamity, you have the opportunity to respawn alone with yourself.
Alone in your deepest interior, and even if you are in the presence of your close family and friends, in necessary seclusion, you are having the opportunity for reflection and alignment for the future.
Transformations will arrive: changes at all levels that will affect all of your areas, all cultures, science, politics and religion.
Understand that our presence is not and has never been to prevent you from living your way.
Our presence is and has always been to deliver to you what you yourselves asked for before you incarnated, from the first moments: to deliver the memory of your cosmic history, deliver the information that can lead you to a more harmonious and happy life.
As our representatives on the Physical Plane of the Earth, we thank you for your loving support, even though, in many cases, you have to support yourself in the midst of so many pains and calamities.
Know that all of this will be rewarded by the very vibration that you have emitted for your future to coexist in an environment of peace, harmony, honesty, health and bliss.
Communications platforms are being installed across your planet, in the high, medium and low orbit, and representatives of our fleets will start transmitting more decoded signals in intuitions for your next days, months and years, which will take you to continue to enter the much desired New Era.
After the present calamity, you will be more united as a race and ready for new steps.
The care that you are taking each other is a small sample of your feeling of unity, always innate, but that has been put to sleep by the turmoil and turbulence of this dimensional reality.
I am Hatonn, representative of Intergalactic Communications with the Earth’s Physical Plane in purity and crystalline transmission from our Main Station.
In the presence of other companions, we greet you!
Commander Hatonn.
Clicks on the Ads Keep Us Alive 🙂
Dream
You can’t reach anything if you don’t dream about it. Everything in existence, was before conceived like a dream, everything achieved, was before thought. One thing is sure, if you can’t imagine… you can’t achieve.
Stephen Littleword
Share this: Send the word out using these buttons!
Editor’s Note: Let’s see…a slight wave of the Schumann Resonance energies appeared from midnight 3/29 until 8:00am (EST, USA). This is a reminder of the ongoing barrage of cosmic energies arriving on Planet Earth NOW.
One sign of this is the recent onslaught of geo-political upheaval globally. It may be wise to keep your attention on the daily report for the Schumann Resonance energies while eliminating fear from your life. This will allow you to concentrate on Being happy which will serve to have you hold and BE in…
Schumann Resonance Today. We will try to keep you updated about the variations of the Resonance with this page. The great variations that nobody can explain but that give us a clear sign that the planet is changing. The Earth is vibration higher and higher, just like us!
The Chart time is based on Tomsk – Russia – UTC (Universal Time Coordinated) +7Source
RS Base Frequency 7.83 Hz.
Schumann Resonance Today Peaks:
“Every second, a multitude of pulses travel around the world in this unique, resonant chamber between Earth and the ionosphere, sending colluding signals to all microorganisms. These signals couple us to the Earth’s magnetic field. Named after their discoverer, these Schumann Resonances (SR) drive the harmonizing pulse for life in our world.” Eric Thompson
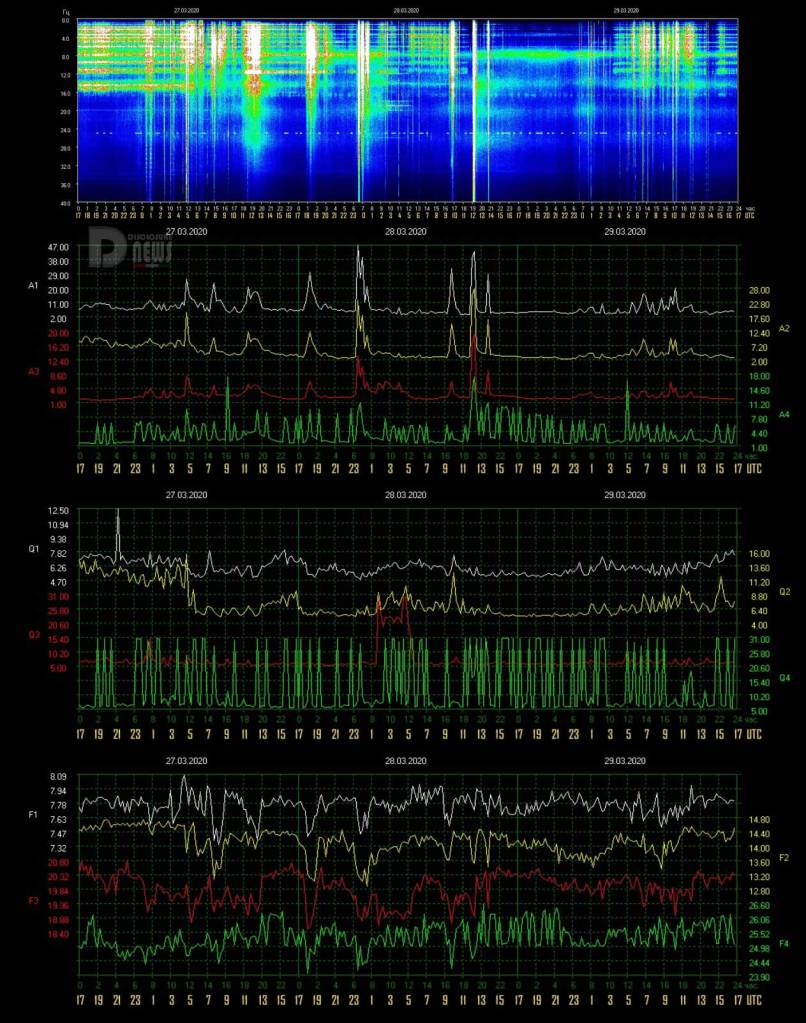
3/29 14:30 – Today’s new activity began very gently after midnight UTC when the amplitude very slowly started a steady increase. The maximum values were of medium intensity, Power 20 was reached at 10 UTC and at 13 the situation returned to calm. The Quality Q4, which has graphically generated a sort of ‘Morse Code’, also appears to be in the subsidence phase.
3/28 23:00 – The new graphs show what apparently seems calm, in reality the dotted line continues on the 25 Hz line due to the dense and continuous variations of the Quality Q4. The intense green coloring on the 8 Hz line seems to be due to the A4 amplitude.
3/28 17:00 – A last isolated movement at Power 29 at 13:40 closes the today’s graph (local timeline) but not the slight movements of the Quality.
3/28 14:00 – What graphically seems to have been the period of the “bands”, from around 1 UTC on 26 March, is apparently closing with the latter peak at Power 45 at 12 UTC today, so just under 3 days when the activity, between ups and downs, it has been practically continuous.
3/28 11:00 – Another day of significant activity, given the situation on the planet, it seems obvious that this could be the case. The first movement, as previously reported, reached Power 30 between 18 and 19 UTC yesterday; the second occurred at midnight UTC, from 11 pm to 1 am, and was the maximum value reached so far, Power 47. The latter was followed by a period of relative calm until 10 UTC when a new leap brought the amplitude at Power 33. A purely personal interpretation of these movements could be the updating of the Etheric DNA, 9 strands are involved which have had one of the many “firmware updates”, this first group was completed at 12; the second group of 8 was completed at 18 and the filament 5, at 7.83 Hz, was done powerfully at midnight UTC. It appears that there are now 4 left.
3/27 21:00 – The activity has steadily and slowly increased since 13 UTC yesterday, with the new charts we see a strong peak that has brought amplitude to Power 30, the movement started at 18 UTC and lasted about 1 hour.
3/27 17:00 – There was a drop in the highs reached but the activity remained significant. A series of variations between 11 and 13 UTC, accompanied by a dive in the frequency, reached Power 20 once again but in this period of time we have been for about an hour and 30 minutes above Power 15. The horizontal bands continue even if with less intensity. Has anyone tried to decipher the Morse Code formed by lines and dots on the Frequency of 25 Hz in the main graph?
3/27 11:00 – No calm today, after the series of “stripes” which have remained at an amplitude around Power 10 some significant movements have interrupted this peculiar “graphic”. The first movements beyond the 10 threshold occurred at 5 UTC with what is the strongest peak so far, Power 26, correlated with a discreet leap in frequency, an increase. Between 7 and 8 UTC it reached Power 20 but even if the amplitude was smaller a strong oscillation of the frequency, a decrease this time, brought the ECC close to the value of the previous peak.
3/26 22:30 – In the new chart we see a rather particular graphic representation consisting of a series of horizontal lines, instead of the usual vertical ones, spaced by a few Hz in the lower part of the frequency band while the distance increases slightly as the frequency increases, the last line corresponds to 14. Difficult to give an explanation with the data shown in the graphs.
3/26 17:00 – Today we had two peaks at Power 17, at 1 am and 2 am UTC, these were followed by a very light activity that touched Power 10 on several occasions, always keeping the light movements constant. Note the strong Quality peak that occurred at 1 UTC when it reached 17×2, Power 34, which, together with a sudden drop in frequency to 7.27 Hz, brought the ECC to 78 as shown in the table below. From 14 UTC it seems that a more intense period has started. The dotted line in the main chart si continuing, generated by the values of Quality 4.
3/26 01:30 – After about 13 hours of calm we had this isolated peak at Power 17 at 1 am UTC.
3/25 17:00 – Today’s activity took place in a time span of 8 hours, from 2 to 10 UTC, the maximum value reached was Power 41 at 8:15 within a period of about 2 hours, from 7 to 9 UTC, with greater intensity. From 14 UTC, a calm situation seems to have returned.
3/25 08:30 – We had about 12 hours of almost calm until 2 UTC when new movements suddenly brought the amplitude around Power 35 with two peaks at 2:30 and 4 UTC. From 7 UTC it seems that the intensity is increasing towards Power 41 and beyond at 8 UTC.
3/24 17:00 – The last 24 hours have been characterized by an initial part of calm, from 17 to 2 am UTC. All the parameters in the graphs show minimum values, even the dotted line generated by the Quality has stopped. Just before 2 UTC, slight variations began with Amplitude between Power 10 and 15, also Quality and Frequency have resumed the movements. Around 9 UTC in the main graph we can see a more intense coloring due to the decreasing movements of Frequency and increase of Quality value. The highest peak in Amplitude was at 4:30 UTC at Power 17 while the combination of all parameters gave an ECC peak at 36 at 9 UTC, compared to 24 of the previous peak.
3/23 17:00 – The activity decreased gradually, the last peak in time order was at about 13 UTC and reached Power 15, however there are still variations especially in the Quality which with “rhythmic” movements is apparently “drawing” the dotted line on the 24 Hz in the main graph.
3/23 11:30 – Moar movements occurred with another series between 8 and 10 UTC, here the maximum reached was Power 30 at 8 am and Power 20 at 9:30 UTC.
3/23 04:30 – We are on the move again, after about 4 hours in which the variations have reduced, since after midnight UTC we see a gradual increase, Power 15 has been exceeded at 2:30 and for about 1 hour we have remained on that value until a strong peak has brought the SR back to Power 46.
3/22 17:00 – Let’s summarize the activity shown in today’s chart. The movements lasted 12 hours, from 5 to 17 UTC. The most important part started at 10 UTC and is still ongoing. The peaks were initially Power 50 and then moved to Power 60 around 13 UTC. At the time of this update there are strong isolated peaks but very close to each other that reach between Power 40 and 45.
3/22 15:00 – This wave of very strong activity has reduced fro now, started at 10 UTC went above Power 40 at 11 and has returned below the threshold of 40 at 14 UTC, 3 hours of very strong activity in which the average was Power 50.
3/22 12:30 – Big movements in progress, after the ‘opening’ at Power 50 a much more powerful activity started at 9 UTC and brought the maximum to Power 56. The changes have been significant in all parameters and at the time of this update Gaia is still telling us something.
3/22 08:30 – We’re back to a condition of strong activity, at 5 UTC we had a first movement and within 40 minutes we had a powerful peak at Power 50 for the duration of 20 minutes until 6 UTC. This initial spike has been followed by another, Power 23 at 7 UTC. The movements seem to continue.
3/21 17:00 – Today was a mild activity day, the slight variations that colored the main graph were of the Quality and Frequency. A line around 24 Hz can be seen in the primary graph, it started at 9 UTC yesterday and stopped almost exactly 24 hours later at 9 UTC today. The detector that generated this line seems to be that of the Frequency, the F4 detector has measured almost the same value for 24 hours.
3/20 17:00 – After the maximum peaks occurred during the UTC night, the movements continued with ups and downs but never stopped. At 9 UTC a surge in amplitude reached Power 34 and then lowered around Power 10, and so it remained practically until this update. In the last hours of the main graph a “colored” activity is shown, in this regard the cause of this “coloring” is due to the wide variations both in Quality and Frequency, the latter increasing. In this regard, although the variations in frequency may seem minor, these have a strong impact on the main graph and consequently on the Energy of the Collective Consciousness.
3/20 09:30 – Even today strong activity, for three days the movements have been almost continuous and at the time of this update we are above Power 30. The most massive part so far has started just after midnight UTC, the changes have brought the amplitude gradually to Power 44, this value was practically maintained for almost two consecutive hours, from about 2 am to 3:30 UTC. Thereafter there wasn’t a real pause, but only a decrease in the amplitude of these movements which once again reached a significant peak at 9 UTC with Power 34.
3/19 22:00 – As anticipated, after a series of slight movements straddling the change of graphs, from 21 UTC there has been about an hour of activity that brought the amplitude of the SR first to Power 22 and then to Power 32 just before 22 UTC.
3/19 17:00 – The activity has decreased in the period from 12 to 17 UTC but in the last two hours there are fluctuations in the Quality which, together with a slight increase in the Amplitude, suggest a restart of the movements.
3/19 11:00 – Even today we are having some activity, isolated peaks with increasing amplitude started from 1 UTC, the most significant movements were at 7:30 UTC with Power 28 and at 9:30 UTC with Power 32.
3/18 17:00 – The activity lasted about 20 hours, from 19 UTC yesterday to 15 UTC today. Now the movements have decreased significantly.
3/18 09:30 – A day of strong activity, Gaia is responding to the moment of strong impact. The strongest peaks so far have occurred in the UTC night when at midnight the amplitude reached Power 50, they were not isolated movements but a set of variations of all the values reported. From 7 UTC to now, even if the amplitude fluctuates around Power 40, both the Quality and Frequency are having very strong movements, bringing the ECC to 85.
3/18 00:00 – The new graphs started with a bang, after a first peak at Power 36 at 19:30 UTC the activity continued as predicted and continued to increase, from 21 UTC the movements increased in intensity to reach Power 45 at 22 UTC, from what we can see it seems that there will be be further activity.
3/17 21:00 – The new charts, of March 18 but technically still on 17 in UTC time, show a moderate activity that started shortly after 18 UTC and that in about 1 hour brought the amplitude to Power 36. The activity seems to continue.
3/17 17:00 – Calm.
3/17 10:30 – Another day of light activity, so far the maximum has been reached at 00 UTC today with Power 14.
3/16 17:00 – Today we saw quite significant movements started at 3 UTC and continued until 14. The maximum values did not reach high peaks but the variations of all three parameters gave a much more intense coloring than yesterday. Now it seems that we have entered a period of calm, we shall see if “Coincidence 17” will be repeated with the new graphs.
3/16 07:30 – Today’s activity has become more relevant but not so much for the variations in amplitude but rather for the movements that we can see in the line graph of the Quality and the drop in that of Frequency. This series of movements is highlighted in the main graph in the period from 3 to 7 UTC. The activity is continuing.
3/15 17:00 – No changes, slight background activity.
3/15 11:00 – The activity continued with slight movements as yesterday but with a slight increase, the strongest peak in the new charts occurred shortly after 19 UTC yesterday and reached Power 32. Subsequently, the background hum remained with variations of both Quality and Frequency, from these the lively coloring of the main graph.
3/14 17:00 – Today’s, shown in the graphs, is divided into two parts, the first characterized by calm, the second by slight movements around Power 10 that seem to continue.
3/14 11:30 – Today’s graphs show that from 2 UTC the light movements are almost continuous, the amplitude of these variations is moderate reaching several times the maximum of Power 13.
3/13 17:00 – After the peak previously reported at Power 42, which was the strongest of the day, light movements continued until 11 UTC with a final jump to Power 13 and since then it has been calm.
3/13 10:30 – In the new graphs we can see that from just after midnight UTC slight movements began which, up to 7 UTC, had oscillations of amplitude around Power 10. From 7 to 8 UTC there was a strong peak that led the amplitude at Power 42, after this movement we went back to a slight background activity.
3/12 17:00 – After the strong peak at Power 57 between 8 and 9 UTC, the activity completely and suddenly subsided returning to a calm state.
3/12 9:00 – March 12 is a special day, we would have liked to make a prediction… In any case, the activity had a small surge in yesterday’s UTC evening, between 19 and 22, with variations in amplitude that reached Power 20. These were followed by relative calm until 6 UTC when we had an isolated peak at Power 24. At 7 UTC the strongest activity so far began, and brought amplitude to Power 57 between 8 and 8:30 UTC. The ECC for this peak turns out to be 90, see table below.
3/11 22:00 – As anticipated, with the new charts we see that the activity has returned with a crescendo that, from 19 UTC, has led the amplitude to reach Power 20 at 21 UTC. The activity seems to continue.
3/11 17:00 – Slight movements continued after 7 UTC reaching a maximum of Power 8 at 14 UTC. Not much after, just at the time of this update seems like new movements are starting.
3/11 13:00 – The latest updated graphs show a period of calm that lasted from 10 UTC yesterday until 1 am when a series of very light movements around Power 10 started, these oscillations continued until 7 UTC, from that moment calm seems to have returned.
3/10 17:00 – Always and only 17, after the peaks at Power 17 the calm began at 17 local timeline, 10 UTC.
3/10 09:30 – The activity continued even if all along at moderate levels, the peaks continued around Power 17. We got it, 17… 5:5 🙂
3/9 17:00 – Power 17 remained the highest value on today’s chart but there is still a slight background activity.
3/9 13:00 – The new graphs show that a slight activity has always been present for almost 48 hours. The most significant movements, so far, have started around 1 UTC when the amplitude has exceeded Power 10. Around 6 UTC there was a further increase in Power 13 and at 10 UTC we had Power 16. The crescendo is continuing and at the time of this update we are at Power 17.
3/8 17:00 – From 13 UTC the activity started to subside.
3/8 15:00 – The last 24 hours have been characterized by an average activity with the most intense part in the hours preceding midnight UTC. For the remaining part, the movements were continuous but limited around Power 10, shortly after 17 of the local timeline (10:30 UTC) there was a movement that reached Power 17.
3/7 22:00 – We had anticipated that we could have a significant activity and so it is. The rise was constant until 21 UTC when a powerful peak reached Power 41.
3/7 17:00 – Around 15 UTC started what appears to be the beginning of an activity that could become significant, the amplitude exceeded Power 10 just before 17 UTC.
3/7 13:00 – Not much to report except that the very light background movements have continued, in today’s graph we can note two isolated peaks, one at 18 UTC yesterday that reached Power 13, and one at 11 UTC today that reached Power 14.
3/6 17:00 – After a calm night (UTC), very light movements began at 3 UTC which almost cyclically brought the amplitude to Power 13 around 7 am UTC, the maximum value of today, which was repeated at 9 UTC. After these last light isolated peaks, the very slight background movements continued.
3/5 17:00 – After the last isolated peak at Power 22 happened at 13 UTC, the movements quickly subsided and we are now in a calm condition.
3/5 13:00 – The activity in today’s chart occurred in three distinct periods: from 18 to 20 UTC (yesterday) when we had the strongest peak so far at Power 36; around 1 UTC with the maximum of 29 Power; from 9 to 11 UTC with various movements that had the maximum at Power 22. If we analyze the three line graphs we see that the strongest peak, in terms of ECC, was that at 8 where we see significant variations in quality and in frequency, the value is 59.
3/4 20:30 – The slight movements that we saw at the passage of the new chart were the preamble to a series of significant spikes that started around 18 and in a few minutes brought the amplitude to Power 26, which was followed, about an hour later at 19:30 UTC, by a further increase to Power 36.
3/4 17:00 – Minor movements around Power 10 continue.
3/4 09:00 – The calm period lasted about 20 hours, from little after midnight UTC some slight movements started and reached the maximum at Power 9, from 5 UTC the values slightly increased up to Power 11. Looking at the frequency graph we see that it is actually in a downward peak, possible indicator of more powerful activity.
3/4 00:00 – The total calm in which we are in has lasted for more than 12 hours.
3/3 17:00 – The last two isolated movements, before the calm, occurred at 9 and 11 UTC reaching Power 9.
3/3 10:00 – In the new main graph we see a series of very close vertical thin lines that begin shortly after midnight UTC and from 6 am start to fade out. The peaks have been of moderate values, so far the maximum has been Power 13 just before 4 UTC. It can be noted, once again, how the movements that have the most ‘chromatic’ impact on the graph are those that have seen changes also in the Quality.
3/2 17:00 – Other minor movements in the latter part of the day around Power 10 occurred between 9 and 12 UTC, after which it was calm.
3/2 09:00 – Today’s chart shows a calm condition until 1 UTC when few slight isolated movements started, they occurred over a 8 hours hours period, until 9 UTC. The maximum value reached was Power 21 at 5 UTC, this specific movement saw frequency and quality oscillations, in addition to the amplitude, and the ECC value was 43.
3/1 17:00 – Today’s graphs show two different types of activity, one given only by the Amplitude, identified by the isolated white lines, and one given by the other parameters, with various colors of green yellow and red. Today’s periods of greatest activity do not correspond to the maximum amplitude peaks, which reached Power 10 just before 1 UTC. The most intense, relatively speaking, part instead took place from 20 to 21 UTC yesterday.
Frequency means how many wave cycle happen in a second, 1 Hz. means 1 cycle per second, 40 Hz. means 40 cycles per second, Amplitude is the size of the vibration, how big is the wave, the chart shows the frequency variation in Hz and the amplitude using the white color.
Note
The Ancient Indian Rishis called 7.83 Hz the frequency of OM. It also happens to be Mother Earth’s natural heartbeat rhythm Schumann resonances are named after professor Schumann who was involved in early German secret space program and was later paper-clipped into the United States. The frequencies of Schumann resonances are fairly stable and are mainly defined by the physical size of the ionospheric cavity. The amplitude of Schumann resonances does change and is bigger when ionospheric plasma gets excited. Ionospheric plasma excitation happens because of solar activity, thunderstorms, use of scalar plasma weapons and HAARP and lately also when the Light forces are clearing the plasma anomaly. Show entriesSearch:
All the SR daily images in one single page See the Images
Explanation of The Chart
The Schumann Resonance Spectrogram Chart
The Schumann Resonance Chart displays data from the magnetic field detector to monitor the resonances occurring in the plasma waves constantly circling the earth in the ionosphere. These three days spectrograms show the activity occurring at the various resonant frequencies from 1 to 40 Hz. Within the spectrogram, the power, or intensity level of each frequency is displayed as a color, with white being the most intense. The Schumann Resonances appear as the horizontal lines at 0.0, 4.0, 8.0, 12.0, 16.0, 20.0, 24.0, 28.0, 32.0, 36.0 & 40.0 Hz. This chart is based on Tomsk, Russia, time UTC +7 (UTC = Universal Time Coordinated).
What is a Spectrogram?
The Spectrogram Calendar is a visual representation of the range of frequencies in the magnetic field at a given location. Similar to how an equalizer displays the frequency content of music played on your stereo, the spectrogram calendar displays the frequency content of a magnetic field. Instead of showing a brief snapshot, it shows changes over a period of time, in this case 3 days.
The local magnetic field is a dynamic field that changes constantly because of variations in the ionosphere and sun and many other influences not yet fully understood. The range of variation displayed in the spectrogram chart is from 0 to 40 cycles per second. The vertical axis is frequency and the horizontal axis is time. The amplitude of a particular frequency at a specific time is represented by the intensity of color (green, yellow, white) of each point in the image.
Schumann Resonance Today. We will try to keep you updated about the variations of the Resonance with this page. The great variations that nobody can explain but that give us a clear sign that the planet is changing. The Earth is vibration higher and higher, just like us!
The Chart time is based on Tomsk – Russia – UTC (Universal Time Coordinated) +7Source
RS Base Frequency 7.83 Hz.
Schumann Resonance Today Peaks:
“Every second, a multitude of pulses travel around the world in this unique, resonant chamber between Earth and the ionosphere, sending colluding signals to all microorganisms. These signals couple us to the Earth’s magnetic field. Named after their discoverer, these Schumann Resonances (SR) drive the harmonizing pulse for life in our world.” Eric Thompson
3/29 14:30 – Today’s new activity began very gently after midnight UTC when the amplitude very slowly started a steady increase. The maximum values were of medium intensity, Power 20 was reached at 10 UTC and at 13 the situation returned to calm. The Quality Q4, which has graphically generated a sort of ‘Morse Code’, also appears to be in the subsidence phase.
3/28 23:00 – The new graphs show what apparently seems calm, in reality the dotted line continues on the 25 Hz line due to the dense and continuous variations of the Quality Q4. The intense green coloring on the 8 Hz line seems to be due to the A4 amplitude.
3/28 17:00 – A last isolated movement at Power 29 at 13:40 closes the today’s graph (local timeline) but not the slight movements of the Quality.
3/28 14:00 – What graphically seems to have been the period of the “bands”, from around 1 UTC on 26 March, is apparently closing with the latter peak at Power 45 at 12 UTC today, so just under 3 days when the activity, between ups and downs, it has been practically continuous.
3/28 11:00 – Another day of significant activity, given the situation on the planet, it seems obvious that this could be the case. The first movement, as previously reported, reached Power 30 between 18 and 19 UTC yesterday; the second occurred at midnight UTC, from 11 pm to 1 am, and was the maximum value reached so far, Power 47. The latter was followed by a period of relative calm until 10 UTC when a new leap brought the amplitude at Power 33. A purely personal interpretation of these movements could be the updating of the Etheric DNA, 9 strands are involved which have had one of the many “firmware updates”, this first group was completed at 12; the second group of 8 was completed at 18 and the filament 5, at 7.83 Hz, was done powerfully at midnight UTC. It appears that there are now 4 left.
3/27 21:00 – The activity has steadily and slowly increased since 13 UTC yesterday, with the new charts we see a strong peak that has brought amplitude to Power 30, the movement started at 18 UTC and lasted about 1 hour.
3/27 17:00 – There was a drop in the highs reached but the activity remained significant. A series of variations between 11 and 13 UTC, accompanied by a dive in the frequency, reached Power 20 once again but in this period of time we have been for about an hour and 30 minutes above Power 15. The horizontal bands continue even if with less intensity. Has anyone tried to decipher the Morse Code formed by lines and dots on the Frequency of 25 Hz in the main graph?
3/27 11:00 – No calm today, after the series of “stripes” which have remained at an amplitude around Power 10 some significant movements have interrupted this peculiar “graphic”. The first movements beyond the 10 threshold occurred at 5 UTC with what is the strongest peak so far, Power 26, correlated with a discreet leap in frequency, an increase. Between 7 and 8 UTC it reached Power 20 but even if the amplitude was smaller a strong oscillation of the frequency, a decrease this time, brought the ECC close to the value of the previous peak.
3/26 22:30 – In the new chart we see a rather particular graphic representation consisting of a series of horizontal lines, instead of the usual vertical ones, spaced by a few Hz in the lower part of the frequency band while the distance increases slightly as the frequency increases, the last line corresponds to 14. Difficult to give an explanation with the data shown in the graphs.
3/26 17:00 – Today we had two peaks at Power 17, at 1 am and 2 am UTC, these were followed by a very light activity that touched Power 10 on several occasions, always keeping the light movements constant. Note the strong Quality peak that occurred at 1 UTC when it reached 17×2, Power 34, which, together with a sudden drop in frequency to 7.27 Hz, brought the ECC to 78 as shown in the table below. From 14 UTC it seems that a more intense period has started. The dotted line in the main chart si continuing, generated by the values of Quality 4.
3/26 01:30 – After about 13 hours of calm we had this isolated peak at Power 17 at 1 am UTC.
3/25 17:00 – Today’s activity took place in a time span of 8 hours, from 2 to 10 UTC, the maximum value reached was Power 41 at 8:15 within a period of about 2 hours, from 7 to 9 UTC, with greater intensity. From 14 UTC, a calm situation seems to have returned.
3/25 08:30 – We had about 12 hours of almost calm until 2 UTC when new movements suddenly brought the amplitude around Power 35 with two peaks at 2:30 and 4 UTC. From 7 UTC it seems that the intensity is increasing towards Power 41 and beyond at 8 UTC.
3/24 17:00 – The last 24 hours have been characterized by an initial part of calm, from 17 to 2 am UTC. All the parameters in the graphs show minimum values, even the dotted line generated by the Quality has stopped. Just before 2 UTC, slight variations began with Amplitude between Power 10 and 15, also Quality and Frequency have resumed the movements. Around 9 UTC in the main graph we can see a more intense coloring due to the decreasing movements of Frequency and increase of Quality value. The highest peak in Amplitude was at 4:30 UTC at Power 17 while the combination of all parameters gave an ECC peak at 36 at 9 UTC, compared to 24 of the previous peak.
3/23 17:00 – The activity decreased gradually, the last peak in time order was at about 13 UTC and reached Power 15, however there are still variations especially in the Quality which with “rhythmic” movements is apparently “drawing” the dotted line on the 24 Hz in the main graph.
3/23 11:30 – Moar movements occurred with another series between 8 and 10 UTC, here the maximum reached was Power 30 at 8 am and Power 20 at 9:30 UTC.
3/23 04:30 – We are on the move again, after about 4 hours in which the variations have reduced, since after midnight UTC we see a gradual increase, Power 15 has been exceeded at 2:30 and for about 1 hour we have remained on that value until a strong peak has brought the SR back to Power 46.
3/22 17:00 – Let’s summarize the activity shown in today’s chart. The movements lasted 12 hours, from 5 to 17 UTC. The most important part started at 10 UTC and is still ongoing. The peaks were initially Power 50 and then moved to Power 60 around 13 UTC. At the time of this update there are strong isolated peaks but very close to each other that reach between Power 40 and 45.
3/22 15:00 – This wave of very strong activity has reduced fro now, started at 10 UTC went above Power 40 at 11 and has returned below the threshold of 40 at 14 UTC, 3 hours of very strong activity in which the average was Power 50.
3/22 12:30 – Big movements in progress, after the ‘opening’ at Power 50 a much more powerful activity started at 9 UTC and brought the maximum to Power 56. The changes have been significant in all parameters and at the time of this update Gaia is still telling us something.
3/22 08:30 – We’re back to a condition of strong activity, at 5 UTC we had a first movement and within 40 minutes we had a powerful peak at Power 50 for the duration of 20 minutes until 6 UTC. This initial spike has been followed by another, Power 23 at 7 UTC. The movements seem to continue.
3/21 17:00 – Today was a mild activity day, the slight variations that colored the main graph were of the Quality and Frequency. A line around 24 Hz can be seen in the primary graph, it started at 9 UTC yesterday and stopped almost exactly 24 hours later at 9 UTC today. The detector that generated this line seems to be that of the Frequency, the F4 detector has measured almost the same value for 24 hours.
3/20 17:00 – After the maximum peaks occurred during the UTC night, the movements continued with ups and downs but never stopped. At 9 UTC a surge in amplitude reached Power 34 and then lowered around Power 10, and so it remained practically until this update. In the last hours of the main graph a “colored” activity is shown, in this regard the cause of this “coloring” is due to the wide variations both in Quality and Frequency, the latter increasing. In this regard, although the variations in frequency may seem minor, these have a strong impact on the main graph and consequently on the Energy of the Collective Consciousness.
3/20 09:30 – Even today strong activity, for three days the movements have been almost continuous and at the time of this update we are above Power 30. The most massive part so far has started just after midnight UTC, the changes have brought the amplitude gradually to Power 44, this value was practically maintained for almost two consecutive hours, from about 2 am to 3:30 UTC. Thereafter there wasn’t a real pause, but only a decrease in the amplitude of these movements which once again reached a significant peak at 9 UTC with Power 34.
3/19 22:00 – As anticipated, after a series of slight movements straddling the change of graphs, from 21 UTC there has been about an hour of activity that brought the amplitude of the SR first to Power 22 and then to Power 32 just before 22 UTC.
3/19 17:00 – The activity has decreased in the period from 12 to 17 UTC but in the last two hours there are fluctuations in the Quality which, together with a slight increase in the Amplitude, suggest a restart of the movements.
3/19 11:00 – Even today we are having some activity, isolated peaks with increasing amplitude started from 1 UTC, the most significant movements were at 7:30 UTC with Power 28 and at 9:30 UTC with Power 32.
3/18 17:00 – The activity lasted about 20 hours, from 19 UTC yesterday to 15 UTC today. Now the movements have decreased significantly.
3/18 09:30 – A day of strong activity, Gaia is responding to the moment of strong impact. The strongest peaks so far have occurred in the UTC night when at midnight the amplitude reached Power 50, they were not isolated movements but a set of variations of all the values reported. From 7 UTC to now, even if the amplitude fluctuates around Power 40, both the Quality and Frequency are having very strong movements, bringing the ECC to 85.
3/18 00:00 – The new graphs started with a bang, after a first peak at Power 36 at 19:30 UTC the activity continued as predicted and continued to increase, from 21 UTC the movements increased in intensity to reach Power 45 at 22 UTC, from what we can see it seems that there will be be further activity.
3/17 21:00 – The new charts, of March 18 but technically still on 17 in UTC time, show a moderate activity that started shortly after 18 UTC and that in about 1 hour brought the amplitude to Power 36. The activity seems to continue.
3/17 17:00 – Calm.
3/17 10:30 – Another day of light activity, so far the maximum has been reached at 00 UTC today with Power 14.
3/16 17:00 – Today we saw quite significant movements started at 3 UTC and continued until 14. The maximum values did not reach high peaks but the variations of all three parameters gave a much more intense coloring than yesterday. Now it seems that we have entered a period of calm, we shall see if “Coincidence 17” will be repeated with the new graphs.
3/16 07:30 – Today’s activity has become more relevant but not so much for the variations in amplitude but rather for the movements that we can see in the line graph of the Quality and the drop in that of Frequency. This series of movements is highlighted in the main graph in the period from 3 to 7 UTC. The activity is continuing.
3/15 17:00 – No changes, slight background activity.
3/15 11:00 – The activity continued with slight movements as yesterday but with a slight increase, the strongest peak in the new charts occurred shortly after 19 UTC yesterday and reached Power 32. Subsequently, the background hum remained with variations of both Quality and Frequency, from these the lively coloring of the main graph.
3/14 17:00 – Today’s, shown in the graphs, is divided into two parts, the first characterized by calm, the second by slight movements around Power 10 that seem to continue.
3/14 11:30 – Today’s graphs show that from 2 UTC the light movements are almost continuous, the amplitude of these variations is moderate reaching several times the maximum of Power 13.
3/13 17:00 – After the peak previously reported at Power 42, which was the strongest of the day, light movements continued until 11 UTC with a final jump to Power 13 and since then it has been calm.
3/13 10:30 – In the new graphs we can see that from just after midnight UTC slight movements began which, up to 7 UTC, had oscillations of amplitude around Power 10. From 7 to 8 UTC there was a strong peak that led the amplitude at Power 42, after this movement we went back to a slight background activity.
3/12 17:00 – After the strong peak at Power 57 between 8 and 9 UTC, the activity completely and suddenly subsided returning to a calm state.
3/12 9:00 – March 12 is a special day, we would have liked to make a prediction… In any case, the activity had a small surge in yesterday’s UTC evening, between 19 and 22, with variations in amplitude that reached Power 20. These were followed by relative calm until 6 UTC when we had an isolated peak at Power 24. At 7 UTC the strongest activity so far began, and brought amplitude to Power 57 between 8 and 8:30 UTC. The ECC for this peak turns out to be 90, see table below.
3/11 22:00 – As anticipated, with the new charts we see that the activity has returned with a crescendo that, from 19 UTC, has led the amplitude to reach Power 20 at 21 UTC. The activity seems to continue.
3/11 17:00 – Slight movements continued after 7 UTC reaching a maximum of Power 8 at 14 UTC. Not much after, just at the time of this update seems like new movements are starting.
3/11 13:00 – The latest updated graphs show a period of calm that lasted from 10 UTC yesterday until 1 am when a series of very light movements around Power 10 started, these oscillations continued until 7 UTC, from that moment calm seems to have returned.
3/10 17:00 – Always and only 17, after the peaks at Power 17 the calm began at 17 local timeline, 10 UTC.
3/10 09:30 – The activity continued even if all along at moderate levels, the peaks continued around Power 17. We got it, 17… 5:5 🙂
3/9 17:00 – Power 17 remained the highest value on today’s chart but there is still a slight background activity.
3/9 13:00 – The new graphs show that a slight activity has always been present for almost 48 hours. The most significant movements, so far, have started around 1 UTC when the amplitude has exceeded Power 10. Around 6 UTC there was a further increase in Power 13 and at 10 UTC we had Power 16. The crescendo is continuing and at the time of this update we are at Power 17.
3/8 17:00 – From 13 UTC the activity started to subside.
3/8 15:00 – The last 24 hours have been characterized by an average activity with the most intense part in the hours preceding midnight UTC. For the remaining part, the movements were continuous but limited around Power 10, shortly after 17 of the local timeline (10:30 UTC) there was a movement that reached Power 17.
3/7 22:00 – We had anticipated that we could have a significant activity and so it is. The rise was constant until 21 UTC when a powerful peak reached Power 41.
3/7 17:00 – Around 15 UTC started what appears to be the beginning of an activity that could become significant, the amplitude exceeded Power 10 just before 17 UTC.
3/7 13:00 – Not much to report except that the very light background movements have continued, in today’s graph we can note two isolated peaks, one at 18 UTC yesterday that reached Power 13, and one at 11 UTC today that reached Power 14.
3/6 17:00 – After a calm night (UTC), very light movements began at 3 UTC which almost cyclically brought the amplitude to Power 13 around 7 am UTC, the maximum value of today, which was repeated at 9 UTC. After these last light isolated peaks, the very slight background movements continued.
3/5 17:00 – After the last isolated peak at Power 22 happened at 13 UTC, the movements quickly subsided and we are now in a calm condition.
3/5 13:00 – The activity in today’s chart occurred in three distinct periods: from 18 to 20 UTC (yesterday) when we had the strongest peak so far at Power 36; around 1 UTC with the maximum of 29 Power; from 9 to 11 UTC with various movements that had the maximum at Power 22. If we analyze the three line graphs we see that the strongest peak, in terms of ECC, was that at 8 where we see significant variations in quality and in frequency, the value is 59.
3/4 20:30 – The slight movements that we saw at the passage of the new chart were the preamble to a series of significant spikes that started around 18 and in a few minutes brought the amplitude to Power 26, which was followed, about an hour later at 19:30 UTC, by a further increase to Power 36.
3/4 17:00 – Minor movements around Power 10 continue.
3/4 09:00 – The calm period lasted about 20 hours, from little after midnight UTC some slight movements started and reached the maximum at Power 9, from 5 UTC the values slightly increased up to Power 11. Looking at the frequency graph we see that it is actually in a downward peak, possible indicator of more powerful activity.
3/4 00:00 – The total calm in which we are in has lasted for more than 12 hours.
3/3 17:00 – The last two isolated movements, before the calm, occurred at 9 and 11 UTC reaching Power 9.
3/3 10:00 – In the new main graph we see a series of very close vertical thin lines that begin shortly after midnight UTC and from 6 am start to fade out. The peaks have been of moderate values, so far the maximum has been Power 13 just before 4 UTC. It can be noted, once again, how the movements that have the most ‘chromatic’ impact on the graph are those that have seen changes also in the Quality.
3/2 17:00 – Other minor movements in the latter part of the day around Power 10 occurred between 9 and 12 UTC, after which it was calm.
3/2 09:00 – Today’s chart shows a calm condition until 1 UTC when few slight isolated movements started, they occurred over a 8 hours hours period, until 9 UTC. The maximum value reached was Power 21 at 5 UTC, this specific movement saw frequency and quality oscillations, in addition to the amplitude, and the ECC value was 43.
3/1 17:00 – Today’s graphs show two different types of activity, one given only by the Amplitude, identified by the isolated white lines, and one given by the other parameters, with various colors of green yellow and red. Today’s periods of greatest activity do not correspond to the maximum amplitude peaks, which reached Power 10 just before 1 UTC. The most intense, relatively speaking, part instead took place from 20 to 21 UTC yesterday.
Frequency means how many wave cycle happen in a second, 1 Hz. means 1 cycle per second, 40 Hz. means 40 cycles per second, Amplitude is the size of the vibration, how big is the wave, the chart shows the frequency variation in Hz and the amplitude using the white color.
Note
The Ancient Indian Rishis called 7.83 Hz the frequency of OM. It also happens to be Mother Earth’s natural heartbeat rhythm Schumann resonances are named after professor Schumann who was involved in early German secret space program and was later paper-clipped into the United States. The frequencies of Schumann resonances are fairly stable and are mainly defined by the physical size of the ionospheric cavity. The amplitude of Schumann resonances does change and is bigger when ionospheric plasma gets excited. Ionospheric plasma excitation happens because of solar activity, thunderstorms, use of scalar plasma weapons and HAARP and lately also when the Light forces are clearing the plasma anomaly. Show entriesSearch:
All the SR daily images in one single page See the Images
Explanation of The Chart
The Schumann Resonance Spectrogram Chart
The Schumann Resonance Chart displays data from the magnetic field detector to monitor the resonances occurring in the plasma waves constantly circling the earth in the ionosphere. These three days spectrograms show the activity occurring at the various resonant frequencies from 1 to 40 Hz. Within the spectrogram, the power, or intensity level of each frequency is displayed as a color, with white being the most intense. The Schumann Resonances appear as the horizontal lines at 0.0, 4.0, 8.0, 12.0, 16.0, 20.0, 24.0, 28.0, 32.0, 36.0 & 40.0 Hz. This chart is based on Tomsk, Russia, time UTC +7 (UTC = Universal Time Coordinated).
What is a Spectrogram?
The Spectrogram Calendar is a visual representation of the range of frequencies in the magnetic field at a given location. Similar to how an equalizer displays the frequency content of music played on your stereo, the spectrogram calendar displays the frequency content of a magnetic field. Instead of showing a brief snapshot, it shows changes over a period of time, in this case 3 days.
The local magnetic field is a dynamic field that changes constantly because of variations in the ionosphere and sun and many other influences not yet fully understood. The range of variation displayed in the spectrogram chart is from 0 to 40 cycles per second. The vertical axis is frequency and the horizontal axis is time. The amplitude of a particular frequency at a specific time is represented by the intensity of color (green, yellow, white) of each point in the image.
Over 600 movie theaters across China were given the green light to reopen their doors over the past week, but Beijing’s Film Bureau put out a notice late Friday ordering all theaters to go back into shutdown. No official explanation for the sudden reversal was provided. Industry insiders instantly began speculating that the government was worried about a potential second wave of coronavirus infections.
The John F. Kennedy Center for the Performing Arts informed members of the National Symphony Orchestra that they would no longer be paid just hours after President Trump signed a $25 million taxpayer bailout for the cultural center, according to an email obtained by the Washington Free Beacon. Nearly 100 musicians will no longer receive paychecks after April 3, according to an email from the orchestra’s Covid-19 Advisory Committee. The email went out to members on Friday evening, shortly after President Trump signed the $2 trillion CARES Act, a stimulus package intended to provide relief to people left unemployed by the coronavirus pandemic. Congress included $25 million in taxpayer funding for the Kennedy Center, a provision that raised eyebrows from both Democrats and Republicans, but ultimately won support from President Trump. The bailout was designed to “cover operating expenses required to ensure the continuity of the John F. Kennedy Center for the Performing Arts and its affiliates, including for employee compensation and benefits, grants, contracts, payments for rent or utilities, fees for artists or performers,” according to the law’s text. The arts organization decided that the relief did not extend to members of the National Symphony Orchestra, its house orchestra.
Residents in Riyadh, KSA reported multiple blasts followed by sirens in the northern districts of the capital. At least two rockets were intercepted in the sky above the Saudi Arabian capital of Riyadh, local media reported. According to the Al-Arabiya broadcaster, citing sources, alongside the two rockets intercepted above the Saudi capital, another was intercepted over the southern city of Jazan. The first explosions in Riyadh were reported around 11:20 p.m. by residents of the capital’s northern districts, according to Al-Arabiya.
The Russian oil company’s operations in Venezuela, where it was extracting the heaviest mix of crude in the world, have been complicated since Washington initiated a campaign to oust democratically elected President Nicolas Maduro. The US namely introduced sanctions on companies working in the Venezuelan oil sector. Russia’s Rosneft oil company has announced that it is selling 100% of its rights in all Venezuelan oil projects to a company owned solely by the Russian government. Rosneft will receive 9.6% of its shares, currently held by the government, in exchange for these rights. The sale means that Rosneft will cease all of its operations in the Latin American country.
Thousands of ash urns have been delivered to a funeral home in the virus epicenter Wuhan in recent days, as relatives start picking up the remains of loved ones, further calling into question the true scale of the outbreak in China. At one of those facilities, the Hankou Funeral Home, trucks delivered about 2,500 urns on both Wednesday and Thursday, Chinese financial magazine Caixin reported. Officially, Chinese authorities have reported over 2,000 deaths in Wuhan, where the virus first emerged. This is 1 of 7 funeral homes in Wuhan.
On Thursday, Brazil’s lower house approved an emergency salary of BRL 600 (USD 120) for informal workers and disabled people. That’s three times the amount the government had proposed a week ago. Lawmakers also passed a BRL 1,200 monthly payment for single-parent households, catering to a demand from the Women’s Caucus in Congress. The bill, which now heads to the Senate, establishes that a maximum of two people in a single household may receive the benefit. In its current terms, the project should cost the government BRL 43 billion in three months.
Authorities at Machu Picchu yesterday closed the Inca Trail network temporarily, following mud and rock slides caused by heavy rainfall at different sections of the trail within the historic sanctuary. Two days ago, a landslide trapped three people working with a travel agency near the Pacaymayo Alto camp area. One of the workers died, the others sustained injuries. Seasonal rains will continue through to March.
The legendary Bolshoi Theatre in Moscow has announced it will broadcast its best classic performances online for free in response to new restrictions to slow the spread of coronavirus. The Bolshoi’s announcement came after the Moscow mayor on Thursday ordered the closure of all non-essential services and encouraged residents to stay home. The ballet and opera house said it will show six of its most popular productions on its YouTube channel beginning Friday with the Swan Lake ballet.LINK
Amid the Wuhan Virus crisis, millions of Moroccan merchants and small store owners are living in a state of uncertainty, anxiously awaiting the government’s solution to their imminent financial challenges. In the handicraft sector, an industry that employs about 2.3 million Moroccans and contributes to 7% of Morocco’s GDP, the situation is alarming. While cash is the norm in commercial transactions across the country, traditional craftsmen and workers in the handicraft sector employ a different method of transaction: Commercial papers. Commercial papers are an unsecured promissory note with a maturity period that could vary between six months and a year, it continues to circulate, from supplier to artisan, from artisan to merchant, until they reach maturity and transform into cash. However, workers in the handicraft sector fear that commercial papers will lose their value during the crisis.
Sun Activity
A minor stream of solar wind is approaching Earth. Estimated time of arrival: March 30-31. Flowing from a southern hole in the sun’s atmosphere, the incoming stream could spark springtime auroras around the Arctic Circle.
Strongest EQ in Europe M3.7 Azores Islands Strongest EQ in North America M3.5 Alaska Strongest EQ on the Planet M5.9 Vanuatu Deepest EQ M5.3 597 km Pendolo, Indonesia News Burst 29 March 2020
Share this: Send the word out using these buttons!
Questions are swirling after a $98 million private jet owned by a Saudi billionaire landed in locked-down Christchurch “after dark” last night. As travel bans see virtually all global air traffic grounded, a high-end private jet owned by a Saudi billionaire last night landed in Christchurch. The plane, a $98 million Gulfstream owned by Saudi-based Rashid Engineering, took off from Georgia in the United States, stopping over at Honolulu, before landing last night at Christchurch Airport at 8.11pm local time. The plane’s apparent owner – Nasser Al Rashid – is reported to be a billionaire with close ties to the ruling royal family in Saudi Arabia, the New Zealand Herald reported. Christchurch airport communications manager Yvonne Densem said she was aware of the flight and said it was managed appropriately.
Turkish authorities on Friday morning evacuated several hundreds of migrants and refugees who had been camping for a month at the border with Greece after the government of Recep Tayyip Erdogan announced it would not be stopping anymore those who wanted to travel to the EU. According to Anadolu, the migrants agreed to be taken to a hosting facility in the border province of Edirne, where they will be quarantined to prevent the risk of contagion from coronavirus. After the period of isolation, the migrants will be invited to move to the Turkish provinces that are willing to host them. Over the past few days, several dozens of people had autonomously left the border area after a possible new agreement between Turkey and the EU had stalled, travelling to Istanbul and other cities on their own, without assistance nor preventive measures.
A former Venezuelan general has surrendered to the US Drug Enforcement Administration (DEA) just a day after being indicted by US federal prosecutors and having a $10 million reward posted for his capture. On Friday, Clíver Antonio Alcalá Cordones, a former major general of the Venezuelan Army, surrendered to Colombia’s National Intelligence Directorate in Bogota and is now in the custody of the US DEA. Alcalá left his position in Venezuela’s armed forces in 2013. US federal prosecutors alleged he had been “a leader and manager of the Cartel of the Suns,” a supposed drug smuggling ring inside the Venezuelan government the US government has claimed makes leading Venezuelan officials “narco-terrorists.” Alongside 13 other Venezuelans, Alcalá was indicted in the Southern District Court of New York on Thursday on narco-terrorism charges and the State Department placed a $10 million bounty on his head.
From 18 to 27 October 2019, Wuhan held the 7th edition of the Military World Games with 10,000 athlestes from 140 countries. Italy: A form of “strange pneumonia” appeared in Italy “between mid October and the first half of November 2019.”
Netflix app downloads have exploded across Europe over the last several weeks as “Netflix and quarantine” has been all the rage during countrywide lockdowns in Italy, France, Spain, and the UK. Netflix had to reduce traffic to its European networks by 25% for 30 days to preserve internet functionality as streaming traffic surged among tens of millions of people in quarantine. “If we end up in a situation where worldwide, 850m children start to receive lessons virtually for an extended period of time, then networks might want to start prioritizing video traffic over gaming traffic,” said Matthew Howett, principal analyst at Assembly.
On Wednesday, the Peruvian government issued a statement warning residents to stop killing bats after authorities were forced to intervene when roughly half a thousand of the flying mammals came under attack by gangs of peasants hoping to exterminate what they believed were carriers of the disease. Roughly 300 of the creatures were killed in the arson attacks that took place in a small village after mobs attacked the caves where the bat communities dwelled.
Executive Order by President Trump: The selected reserve and certain members of the individual ready reserve of the armed forces to active duty. To help with the Covid-19 coronavirus emergency, US President Donald Trump has signed an executive order authorizing the call-up of up to a million reserve military personnel in the army, navy, air force and coast guard.
Brazilian President Jair Bolsonaro has waved off the ongoing coronavirus pandemic, insisting that life goes on. He suggested the death toll in his own country has been overstated for political purposes. “I’m sorry, some people will die, they will die, that’s life,” Bolsonaro said in an televised interview on Friday. “You can’t stop a car factory because of traffic deaths.”
Facts Are Facts on the Fed. The Citizens allow the bank to print $500 billion in currency (cash). The bank pays for printing costs, ink, and paper. The Citizens do not charge the bank any interest for use of the $500 billion in printed currency. The bank uses the $500 billion cash to buy a $500 billion government bond which pays the bankers interest. The bank keeps some of the bonds and sells, for a fee (10%), some of the bonds to the public. The bank can buy back the bonds from the public simply by printing more money. The bankers can create inflation and depressions by manipulating the amount of currency in circulation. The FED operates exactly like this today. It also prints money (through the U.S. Treasury) and uses this printed money to buy loans from other banks. This money has created our inflation. We give the bank cash interest-free, then they charge us interest on our own currency.
In the 1930s, a back door was installed in the Fed, so the elites could easily and secretly steal money from it. What is the back door? It is the Exchange Stabilization Fund (ESF), which is attached to the New Yorkj branch of the Fed. On paper, the ESF was to maintain the value of the dollar, and to that end, was authorized to requisition money in virtually any amount from the Fed, and not have to account for where the money went. And guess what – the ESF is under the direct control of the Secretary of the Treasury (currently Mnuchin). In the past, this has been used to funnel untold billions to the world banking elites. But now, the Treasury is taking the money. No previous president dared to do this, because they were all members of The Club, or at least under The Club’s thumb. But Trump is not a part of The Club, which has be vigorously opposing him since he announced his candidacy. And now Trump has taken their cash cow, and is letting the Treasury milk it. And there is little the Fed can do about it.
Sun Activity
Sunspot number: 0 Spotless Days Current Stretch: 17 days 2020 total: 67 days (77%) 2019 total: 281 days (77%)
Strongest EQ in Europe M3.4 Iceland Strongest EQ in North America M3.7 Texas Strongest EQ on the Planet M5.6 Indonesia Deepest EQ M5.2 590 km Argentina News Burst 28 March 2020
Share this: Send the word out using these buttons!