An archived episode of CNN’s “Larry King Live” featuring a call from an anonymous caller later identified as the mother of Biden accuser Tara Reid appears to have been scrubbed from the Google Play catalog.
The “potentially hazardous” Apollo category space rocks, dubbed 2009 XO or 438908, are believed to be the most dangerous intruders as they intersect our planet’s orbit with theirs, prompting NASA’s tracking system to closely monitor their movements. An almost 500-metre asteroid is currently hurling towards our planet, and will come particularly close on 7 May. [2016 HP6 2020-May-07 Passage at 4.3 Lunar Distance (1 LD = 384,401 km) Velocity 5.7 km/s Diameter 31 m. — 388945 2020-May-10 7.3 LD 8.8 km/s Diameter 295 m. — 438908 (2009 XO) 2020-May-07 8.8 LD 13 km/s Diameter 350 m.]
US President Donald Trump and his French counterpart Emmanuel Macron agreed on the need to reform the World Health Organization, White House Deputy Press Secretary Judd Deere said after the phone call of the presidents. The two leaders expressed hopes to convene the five permanent members of the UN Security Council soon to discuss the response to the coronavirus pandemic. Besides, Trump and Macron talked about “critical regional and bilateral issues”, Deer noted. The sides also discussed “positive developments in combating the coronavirus pandemic and progress toward reopening world economies”.
A medical team sent from a prestigious hospital in China to North Korea has raised questions over the reason for the visit, as speculation simmers over the health of leader Kim Jong Un. The Chinese Communist Party dispatched the team of about 50 experts on or before April 23, but it is unclear if it is related to Kim’s health, sources in the party said on April 25.
Hong Kong riot police armed with shields dispersed a crowd of 300 pro-democracy activists holding a singing protest in an upmarket shopping mall on Sunday, despite a ban on public gatherings of more than four people. Chanting popular protest slogans, mostly young activists clad in black swarmed the Cityplaza mall shouting “Liberate Hong Kong, revolution of our times!” while others called for the release of pro-democracy activists. The protest was the first sizable gathering since the government imposed the ban on public meetings at the end of March to curb a spike in coronavirus infections.
Russia’s President Vladimir Putin and his US counterpart Donald Trump have released a rare joint statement, marking the 75th anniversary of the historic meeting between Soviet and American troops on the Elbe River. The meeting that occurred on April 25, 1945 “heralded the decisive defeat of the Nazi regime,” which was ultimately destroyed a couple weeks after. But most importantly, it clearly showed how the two nations can cooperate, the statement reads. “The ‘Spirit of the Elbe’ is an example of how our countries can put aside differences, build trust, and cooperate in pursuit of a greater cause.”
Anime News! Gundam fans brace for impact. Japan’s very first official cafe devoted to the anime is about to get a whole lot bigger. Ten years after it debuted in the capital’s sanctuary for anime fans, Gundam Cafe Akihabara is undergoing a major facelift that will leave it four times larger when it reopens in July.
All the latest talk is centered on testing. Besides this being another obstacle to getting the country open, what testing are these pundits talking about? Are we testing people who we believe currently have the virus or administering the antibody test to find out who has had the virus? The more antibody tests we do, the lower the mortality rate will decline towards levels usually seen during a severe flu season. Dr. Anthony Fauci was publishing a paper in the New England Journal of Medicine dated Mar. 26, 2020 that suggested this would be the case. However at the same time he was telling Trump to shut down the US economy. For instance, in New York state Governor Andrew Cuomo announced on Thursday that a 3,000 person study showed 14% had tested positive for antibodies with higher levels in New York City. This study translates to a mortality rate of 0.5%, which is much lower than previously believed. Another important point on the antibody test results. Who is receiving these results? Are the test results anonymous or are they tied to you personally? What will happen a year from now when insurance companies use this antibody test data to say you are uninsurable because its discovered that a certain percentage of the infected have long-term organ damage? I would like to hear that the social tracing programs will comply with Hipaa laws. However by using social tracing tools like your smartphone, it appears many agencies will need your identity to track the spread of the Covid-19 virus. This is uncharted territory and safeguards should be put in to protect people against future harm.
Ukrainian police have raided a private reproductive clinic that has been allegedly “selling babies” to China. While the suspects are accused of “human trafficking,” surrogate motherhood is a legal gray area in Ukraine. The scandalous case was brought to light by the country’s interior ministry late on Saturday. The police broke up a “human-trafficking” ring that was centered at a private reproductive clinic in Kiev. Further details on the case were shared by the Deputy Interior Minister Anton Gerashenko on his Facebook page. The ring involved the head of the clinic, her son, as well as two other Ukrainian and three Chinese nationals. They were charged with human trafficking that may lead to 12 years in prison with property confiscation.
Airlines are turning to governments for rescue money – but bailing out the massive capitalist ventures makes about as much sense as leaving the middle row empty to avoid the virus. With the world in a tailspin from the China Virus, airlines are in for a bumpy ride – and some of them are inevitably going to crash and burn. Everything may be up in the air but one thing is for certain: flying will never be the same again. Air travel will be a much different beast when this lockdown nightmare is over. Some airlines and EU states now want to introduce in-flight social distancing with the middle seats left vacant, as part of a set of new rules to be announced next month. There’s also talk about airlines cancelling or reducing their in-flight food and beverages service to reduce interaction.
Sun Activity
Just south of the sun’s equator, a sunspot is growing: AR2760. Its magnetic polarity identifies it as a member of old Solar Cycle 24. This is probably one of the last old-cycle sunspots we will see as the sun continues tipping toward Solar Cycle 25.
Active Weather
The National Hurricane Center is issuing advisories on Tropical Depression One-E, located over the central portion of the eastern North Pacific basin. Tropical cyclone formation is not expected during the next 5 days.
Strongest EQ in Europe M4.3 Crete, Greece Strongest EQ in North America M3.2 Oklahoma Strongest EQ on the Planet 5.2 Papua New Guinea Deepest EQ M4.6 616 km Ndoi Island, Fiji News Burst 27 April 2020
Share this: Send the word out using these buttons!
China has decided to donate additional $30 million in cash to WHO to support its global fight against #COVID19, in particular strengthening developing countries’ health systems. China already donated $20 million in cash to WHO on March 11.
A study published in the journal The Lancet on Tuesday suggests that the numbers of COVID-19 cases in China provided by the CCP is total BS.
The commander of the nuclear-powered submarine HMS Trenchant is under investigation by the UK Royal Navy for violating coronavirus lockdown restrictions, they held a BBQ and DJ party for his crew after arriving to the UK following two months at sea. Following the party, which took place dockside at the Devonport naval base, all 150 crew members of the MS Trenchant have been forced into self-isolation for two weeks due to coronavirus concerns. They had previously undergone the procedure before the submarine docked at the base.
Tom Hanks and Rita Wilson’s blood will be used by medical researchers who are developing a vaccine for coronavirus after they won their battle with the illness.
[Apr 20] CNNanon here. Been lurking for a while. Before you all accuse me of trolling, please know there are some of us here who have families to support and we have no other job prospects right now, so we put up with fucktards like Cuomo and Stelter. Just wanted to let you know that major news is coming soon about network management. Big. BIG. Changes in personnel. BOMBSHELL type information will go public soon. Some of our “leaders” have been enjoying themselves on the weekend doing things that “Krafty” types got busted for. Watch the news. Spoiler: The story will not be covered by CNN. Footnote: I have a dick so unless you want to see it, keep the Tits or GTFO comments to yourselves faggots. [AT&T CEO resigned – AT&T owns CNN]
Cambodian Ministry of Environment officials have warned it will take legal action against Prey Lang Community Network (PLCN) and several other organisations if they continue to collect deforestation data in the area. The ministry’s warning comes after PLCN suggested a new programme that would use satellite imagery to monitor and collect information on forest clearance in Prey Lang after the ministry banned the group from patrolling it. But the ministry’s secretary of state and spokesman Neth Pheaktra said that the activities of the PLCN are now against the law.
Chinese officials demolished a building under construction which was built for housing 16 monks in Langdi monastery in Markham, Tibet. On Apr. 2, Chinese police arrived with a bulldozer to strike off the building which was being built by the local people in the traditional style by using collective labour. The officials arrived at the monastery a day before and told monks that the building was not allowed. As the abbot of the monastery appealed against the demolition, he was beaten and was threatened with imprisonment along with two other monks. The report details the images prior to the demolition sent from Tibet depicting local people singing as they work on the building in a tiny monastery. The image also showed the monastery displaying two red Chinese flags, compulsory for monasteries in Tibet, while Tibetan prayer flags fluttered in the breeze beside them.
China has included parts of Arunachal Pradesh within its boundaries, in an updated map issued by Sky Map, an authority on digital maps which is a unit operated under Beijing’s National Surveying and Mapping Geographic Information Bureau. Users discovered that the new map has updated China’s borders that included India’s Arunachal Pradesh, a region it claims as part of Southern Tibet.
The CEO of Ryanair, one of the world’s largest airlines, said his planes wouldn’t fly if the airline had to keep the middle seat empty to comply with what he described as an “idiotic” social-distancing proposal during the coronavirus pandemic. Michael O’Leary told that such action would be “entirely ineffective” — even as experts proposed it and some airlines have agreed to it at least temporarily as a way to keep social distancing in place as countries start to reopen and more flights resume. O’Leary said the Irish airline’s plans to start flying more would be ruined by “some entirely ineffective social-distancing measures like having middle seats empty — because if middle seats are empty, we’re not returning to flying at all.” He said the airline had told the Irish government that if it tried to impose such a rule, then “either the government pays for the middle seat or we won’t fly.”
For weeks, the United Nations, International Monetary Fund, and World Bank have stated the only solution for emerging market economies severely damaged by the coronavirus outbreak is a “debt jubilee.” The United Nations Conference on Trade and Development (UNCTAD) published a note on Thursday morning that said about $1 trillion in debt owed by developing countries should be canceled to avoid an emerging market debt crisis. “This is a world where defaults by developing nations on their debt is inevitable,” warned Richard Kozul-Wright, director of UNCTAD’s Division on Globalization and Development Strategies.
Another grim milestone was reached this week. Human rights monitors have recorded that Saudi Arabia has carried out its 800th execution since King Salman bin Abdulaziz (and by extension MbS) began his rule five years ago — most being in the form of the kingdom’s ‘favored’ beheadings.
Iran ended the social distancing, officials are considering the re-opening of cinemas and religious centers.
In a recent highly targeted BEC attack, hackers managed to trick three British private equity firms into wire-transferring a total of $1.3 million to the bank accounts fraudsters have access to — while the victimized executives thought they closed an investment deal with some startups.
The government of Jair Bolsonaro just lost its biggest star, Sergio Moro, the Brazilian Justice Minister who rose to fame as the lead judge in the infamous Petrobras ‘Car Wash’ investigations; investigations that ultimately led to the arrest of ex-president Luiz Inacio Lula da Silva and, arguably, the election of Bolsonaro. Moro is leaving the government over a disagreement that stems from the head of the Federal Police, Brazil’s version of the FBI, stepping down. Bolsonaro wants more control over that division, and Moro doesn’t like the idea. He wants the Federal Police to be independent of politics and signaled that Bolsonaro was interfering with investigations by messing with leadership.
Fifty-eight 105mm artillery shells were removed from a cornfield by the Cambodian Mine Action Centre (CMAC) in Battambang province on Wednesday. The owner of the field, Chhun Hoeub, said he was in a state of shock and panic when his plough tractor unearthed three shells, although it didn’t cause an explosion. According to the technical specifications, cluster bombs can weigh up to 340kg and have a length of 3.22m and a width of 401mm. They are dropped from jets and inside the body is a cluster of 444 bombs, each weighing 500g, which are smaller sub-munitions that are ejected and scattered. This type of cluster bomb is an American product.
Sun Activity
Sunspot number: 0 Spotless Days Current Stretch: 19 days 2020 total: 89 days (77%) 2019 total: 281 days (77%)
Strongest EQ in Europe M4.9 Rodhos, Greece Strongest EQ in North America M3.3 Idaho Strongest EQ on the Planet 5.5 Off the Coast of Mexico/Guatemala Deepest EQ M5.0 531 km South of Fiji Islands News Burst 24-25 April
Share this: Send the word out using these buttons!
Editor’s Note: Ok…let’s do it again! Well, at least in regards to allowing incoming energies to change our lives for the better. Stimulus money, anyone? 🙂
In the graph above, we see short sparks of intensely dense and high amplitude Schumann Resonance energies at 8pm, 10pm (far a 30 minute spike), and a lower amplitude burst at 11pm. Other energies low amplitude, moderate density energies appeared from 4am through 7am on 4/25. (All times EST, USA)
Please join me in understanding how incoming energies cause the Earth to create waves of Schumann Resonance energy (the Earth rings like a bell!) which aids us all in BEing in…
Schumann Resonance Today. We will try to keep you updated about the variations of the Resonance with this page. The great variations that nobody can explain but that give us a clear sign that the planet is changing. The Earth is vibration higher and higher, just like us!
The Chart time is based on Tomsk – Russia – UTC (Universal Time Coordinated) +7 –Source
SR Base Frequency 7.83 Hz. – Schumann Resonance Today’s Peaks
53
Amplitude
6.32
Quality
7.94
Frequency Max
7.18
Frequency Min
“Every second, a multitude of pulses travel around the world in this unique, resonant chamber between Earth and the ionosphere, sending colluding signals to all microorganisms. These signals couple us to the Earth’s magnetic field. Named after their discoverer, these Schumann Resonances (SR) drive the harmonizing pulse for life in our world.” Eric Thompson
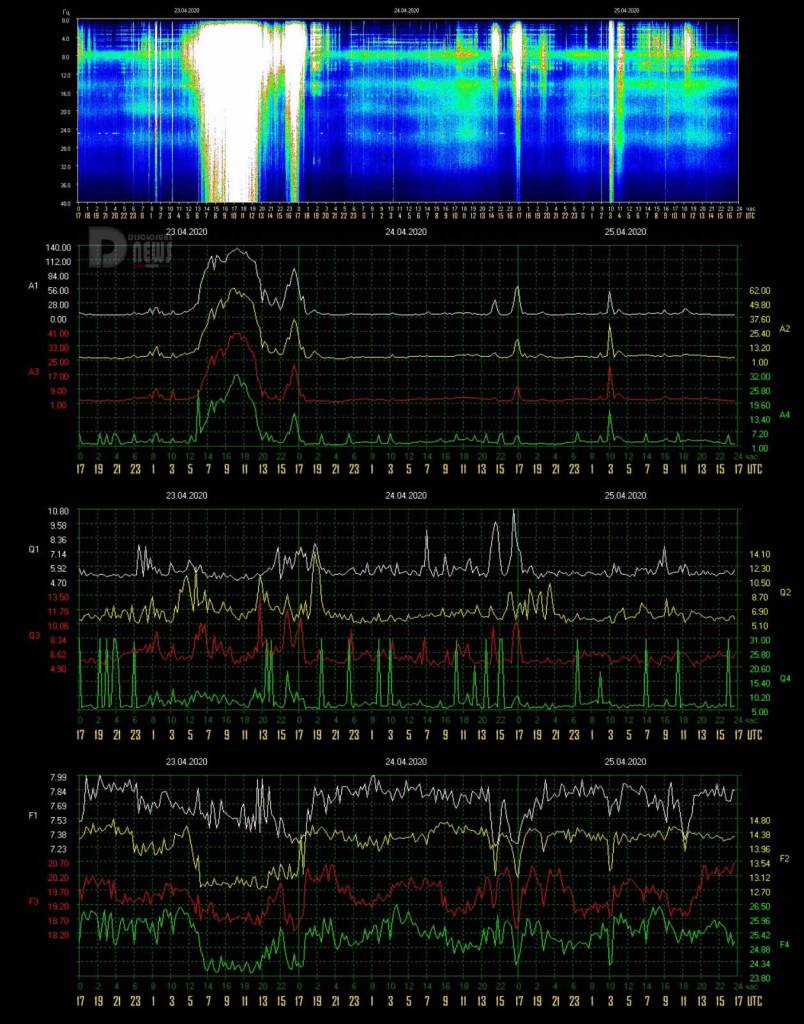
4/25 17:00 – The activity reported previously was practically everything significant to report for today. At 11 UTC a slight movement lasting about 30 minutes reached Power 17, here the thing to note is the drop in frequency to 7.18 Hz, a very low value, this movement of the frequency lasted about 2 hours.
4/25 06:00 – Even today a strong activity but of short duration, at 3 UTC for about 40 minutes a strong peak of Amplitude reached Power 54. Compared to the peak reported yesterday, today’s one was not accompanied by significant changes in Quality, the Frequency instead has had some fluctuations even if less marked than yesterday. At 4 o’clock another movement reached Power 15.
4/24 21:30 – The activity at the turn of the local midnight, 17 UTC, was a short but intense, it lasted about an hour. After this only very light activity.
4/24 17:00 – For most of the day it was practically calm, from 14 UTC instead of medium-sized movements are noted, the first reached Power 33 at 14:30 and then returned to normal values, the second movement started at 16 UTC and has reached the remarkable value of Power 56 at the time of this update; it seems that we will see higher values shortly. In correspondence with these two movements there are strong variations in Quality and two dips at 7.23 Hz in Frequency.
4/24 10:00 – The new charts present a calm situation, a slight movement at Power 11 occurred at 7 UTC when the Quality also reached today’s maximum value at 9.10.
4/23 22:00 – The activity seems to have ended, 12 hours straight from 5 to 17 UTC, all values are back to normal and also the frequency has risen to base value.
4/23 17:00 – After a temporary decrease in movements around Power 30 between 13 and 15 UTC a new increase brought the Amplitude to Power 95 at 16:30 UTC, this brings the duration of today’s activity to 12 consecutive hours. The average over the period was Power 84.
4/23 15:30 – The Amplitude graph looks like a mountain that rises in the plain and actually today’s activity is really massive. So far, the period of activity, which is still ongoing even if at less intensity, has lasted 8 hours. At the time of this update we are at around Power 30.
4/23 11:30 – Another increase, Power 138 at 10 UTC embedded in a sequence lasting more than 2 hours in which we have always been above 120. From 6:30 UTC, when we passed Power 90, it has been a continuous increase. At the time of this update, the reading indicates Power 124.
4/23 09:30 – The very strong activity continues exceeding the previous values, at 8 UTC we had Power 124 and at 9 the situation shows a possible further increase. It is practically 2 hours that we are above Power 100. The Quality remains remains at normal values while the Frequency is low but not too much, remaining around 7.60 Hz.
4/23 08:00 – Shortly after 7:30 UTC we have reached the maximum value so far of Power 120.
4/23 07:30 – Still elevating, at 7:30 UTC we are above Power 100. The Frequency keeps dropping below 7,40 Hz.
4/23 07:00 – The situation changed markedly shortly after midnight UTC when slight isolated peaks at Power 20 and the falling Frequency trend started; from 5 UTC a powerful movement quickly and continuously brought Amplitude to Power 95. The Quality has remained at normal values while the falling Frequency has reached 7.52 Hz as minimum. The massive activity is underway.
4/22 17:00 – In the last hours, starting from 9 UTC, there has been a slight increase in movements. The amplitude oscillations, which started below Power 10, have increased, even if not very intensely, from 14 UTC to reach today’s maximum around Power 15 at 15:30 UTC. These movements went hand in hand with the decrease in Frequency, which also started at 9 UTC, which reached today’s low at 7.42 Hz at 15:30 UTC.
4/22 08:00 – The activity is continuing to gradually decrease and all the graphs show normal values, the only movement of the amplitude that stands out occurred at 3 UTC and reached Power 12. Compared to the hours at the turn of the local midnight, or 17 UTC, where we have flat calm, from the last few hours there are modest variations of the Quality that have given the main graph a green coloring. Frequency today has remained almost constantly above the base value.
4/21 17:00 – The movements previously reported have been all of today’s activity, since the last few hours we are in a calm condition.
4/21 10:00 – The new graphs show a very slight activity in the first part with oscillations that sporadically reached Power 10, from 5 UTC the movements became slightly more intense with the Amplitude that reached Power 18 a first time at 6:30 UTC. This intensification is due to a drop in frequency which has gone down to around 7.60 Hz from 6 am. From 6 to 7 UTC we have had the maximum values so far that have reached Power 19.
4/20 17:00 – Today, if compared with the previous days, is certainly a calm day, the most significant movements have remained those we have reported previously, instead we should note the Frequency graph, what seems to be a strong increase is actually is in realty the return to values close to the Base Frequency of 7.83 while in the last 2 hours, from 15 UTC, there has been a new dive towards a lower number of cycles per second, we shall see in few hours if this has been an indicator of new activity or only a momentary variation.
4/20 10:00 – We are in a moment of low activity after a day and a half of very strong movements. After midnight on the local timeline, 17 UTC, the graphs show the final part of the sequence of peaks with Amplitude at Power 50, within 3 hours, at 20 UTC, this returned to normal values, some variations around Power 17 happened at 23 UTC when the Frequency started strong fluctuations that increased from 3 UTC and are still in progress. During these fluctuations a new peak at Power 20 occurred at 6 o’clock UTC followed by other movements below this value.
4/19 20:00 – Forty, the amount of consecutive hours of activity, more or less powerful but never interrupted. Through midnight of the local timeline or 17 UTC, for two hours we floated oat Power 40 while at the time of this update we record a new drop towards Power 10. Despite this decrease, the Frequency remains at minimum values so, once again, we are not yet at the conclusion of this very strong ‘upgrade’ phase.
4/19 17:00 – This activity does not seem to end, we had two hours of decrease in intensity from 13 to 15 UTC when the amplitude started again to increase and at 16 reached Power 45 that was practically maintained until the time of this update. The Frequency has further flattened towards the minimum suggesting that we will continue for another little bit with this “cure”.
4/19 12:30 – We know where to look during this prolonged activity, we can see that the Frequency is still very low and therefore we can expect other movements. At the time of this update we are around Power 50 with a strong increase in Quality.
4/19 09:45 – Down the Frequency and up the Amplitude bring the Energy of the Collective Current once again close to 150. The peak at Power 88 occurred at 7:45 UTC, during a period started at 7:30 until just before 9 when we remained constantly above Power 65. After a slight drop to Power 50 at 9 we have now returned to a very strong Power 68 increasing. Once again the Frequency remains low, as it has been for more than 24 consecutive hours.
4/19 07:30 – As can be seen from the graphs, there was no interruption in the activity, only a moment at the turn of midnight UTC, then an increase in the Frequency to 7.60 Hz coincided with a decrease in the Amplitude under Power 10. The Frequency then returned around 7.30 Hz and the increase in amplitude was immediate returning to Power 50 at 1 UTC. After this wide swing, the trend returned again to a marked increase from 3 UTC and within a few hours we had a new Power 65 maximum at 6 UTC. Frequency continues to be very low. The Amplitude Frequency comparison image gives you, hopefully, a clearer correlation between the the parameters. MOAR coming?
4/18 22:00 – What stands out most in these graphs is the Frequency, which remained constant between 7.20 and 7.30 Hz. As long as the Frequency remains so low, the movements will continue, this consideration derives from the statistical analysis of the many movements that we have kept track of. Significant movements almost always end when the Frequency returns to normal values and this time the exception confirmed the rule with continuous changes in Amplitude which again rose to Power 35 little after 21 UTC. We are now at 20 consecutive hours of activity.
4/18 19:00 – We are in a ‘roller coaster’ moment, after the peak at Power 68 around 16:30 there was a slight decrease down to Power 27 and then a new ascent to Power 51 at 18:15. After this a new descent to Power 27. Note that the Frequency continues to remain at minimum levels, around 7.25 Hz, a likely indicator that the activity is not yet ended.
4/18 17:00 – The activity is not over yet, after a short period in which the movements brought the Amplitude down to Power 10 around 15 UTC, from 16 very strong movements restarted which culminated shortly before 17 UTC with Power 68. As we previously reported, the Frequency has always remained at very low values, an indicator that the activity was not finished despite the reduction of the Amplitude peaks. A trending increase can also be seen in the Quality graph where we can see the maximum value of today at 12.40. The activity is evidently continuing very significantly.
4/18 13:30 – We take advantage of this break of the most intense phase to summarize the day. From 5:30 to 12:30 UTC, 7 hours, we have been above Power 70; within this period, from 9 to 10:30 UTC, we remained above Power 85 while for most of the time between 9 and 10 UTC we were above Power 100. In regards Quality, throughout this very strong activity, it remained at normal values, the two peaks were at the beginning and end of this phase. The Frequency, on the other hand, remained low, around 7.30 Hz, for the entire duration and although there is a decrease in the variations at the time of this update, it still remains on these values.
4/18 10:00 – MOAR; Another increase in an activity that was already very strong. The ECC is nearing 200 with this peak at Power 110 accompanied by an inverse peak of Frequency at 7.26 Hz. This maximum was reached at 9.15 UTC. It is more than 4 consecutive hours that we are above Power 70!
4/18 08:30 – The very strong movements continue, from 5:30 UTC until now we have remained above Power 70, during this period there were two Amplitude peaks that reached Power 90, one just before 7 and the second one hour later at 8 UTC. The Quality has dropped after the initial peak previously reported while the Frequency as ‘usual’ remains very low. The ECC during this very intense phase remained around 140.
4/18 06:30 – We are definitely on the move, after more than a day of almost total calm, from 3 am UTC movements have started, currently in progress, which within 3 hours, with a rapid increase, have brought Amplitude to Power 77 at 6 UTC. The others Resonance parameters followed in agreement confirming that the strength of these variations is significant. The Quality as well, from 3 UTC, began to grow while Frequency began a significant drop towards the minimum of 7.24 Hz which is the lowest value reached in the last 3 days. At the time of this update there was a further increase in Power 81.
4/17 17:00 – The situation has not changed, still almost total calm. The only relevant figure is a lowering of the Frequency towards the minimum value reached today of 7.45 Hz.
4/17 10:30 – Not much to report so far, the situation is almost complete calm after the moderate movement previously reported. A slight variation at 1 UTC reached Power 10 after which it has been calm.
4/16 17:00 – The new graphs show how the activity, that is about to enter Coincidence 17 (in UTC time as in local time it’s already 17) is continuing. At 18 UTC a new movement brought Amplitude to Power 20 accompanied by wide variations in Quality. The Frequency, as can be seen from the relative graph, continues to remain on normal values.
4/16 17:00 – If we want to say that there was calm it did not last long, around 9 UTC, for the duration of about an hour, we see a movement that reached Power 15. About 4 hours later, at 14, a new short series of isolated peaks reached Power 28; the latter movement coincides with a significant variation in the Quality which has again approached today’s maximum values while the Frequency has tended to remain normal, except in the period between 9 and 10 UTC when the Amplitude has reached, as mentioned above, Power 15.
4/16 08:00 – There hasn’t been much calm since the last update, the movements have been light and sporadic. The most active phase so far has been from 1 to 5 UTC, during this period a first variation reached Power 30 at 2 UTC while a stronger phase around 4 UTC generated the maximum peak of Power 35. Frequency today has not had significant movements fluctuating around the base value while Quality instead had strong fluctuations in the period in which the amplitude peaks occurred. Now the situation seems to have calmed down considerably.
4/15 17:00 – After 14 UTC, when there was a movement at Power 20, the situation returned calm and it’s still calm.
4/15 13:00 – After the movements previously reported, the activity continued sparsely with peaks around Power 15, this until 12 UTC when, in correspondence with a strong rise in the Frequency towards the maximum of the last few days at 8.05 Hz, we have had the most significant movement so far that has reached Power 43. After this sharp surge we continue to see the Frequency always above 8 Hz and the Amplitude that has returned around Power 15.
4/15 09:00 – Just after midnight UTC the calm condition was interrupted by two isolated peaks at Power 15 and Power 17 and at the same time fluctuations in Quality began without however reaching very significant values. The frequency remained on normal parameters even if a trending decrease is noted from 5 UTC.
4/14 17:00 – Based on the Frequency line graph we can see that today the most active phase has been from 6 to 13 UTC, when the Frequency had a significant drop down to 7.29 Hz at 10 UTC. In fact, this minimum peak corresponds to the maximum peak of Amplitude at Power 28 and also to a decisive movement of Quality. Since 13 UTC the situation has calmed considerably and we are now in a calm condition.
4/14 08:00 – From the coloring of the graph it can be seen that the period of complete calm started at 14 UTC yesterday until just before 23 when a slight movement reached Power 10. This seems to have been the beginning of light isolated peaks, at Power 20 at 1:30 UTC, at Power 28 at 6 UTC. As for the other measured parameters, the Quality interrupted the changes in Q4 at local midnight, 17 UTC yesterday. The Frequency instead, after remaining above average in the final part of the yesterday’s graph, again from midnight local/17 UTC and therefore coinciding with Q4 Quality ‘interruption’, has risen to very high values, above 8 Hz with a maximum 8,03 Hz, held for about six hours until 24 UTC. From 4 UTC there is a Frequency sudden drop, probably an indication of some stronger incoming movement, down to today’s minimum which is 7.42 Hz.
4/13 17:00 – Today’s activity, if we look only to the Amplitude, had a relatively short duration, just over nine hours, from 2 to 11 UTC, but was very intense in the phase from 5 to 7 this morning UTC, for the European continent it was in full REM phase. During these two hours we have been constantly on Power 40. The movements of Quality have been lower than yesterday and we can see the resumption of the ‘modulation’ of Quality Q4 on the 25 Hz line. The Frequency is the one that today has undergone the most ‘ups and downs’ and returned to normal values at 12 UTC; practically today it has continued to fluctuate widely throughout the 24 hours.
4/13 08:00 – From the new graphs we note that there was no real calm, only a few hours after 14 UTC but shortly afterwards some slight changes in Quality and Frequency began which were accompanied slightly later by the Amplitude that reached Power 15 at 1 UTC. This movement was characterized by a gradual drop in frequency up to 7.35 Hz. This has been the “opening” of much more substantial variations which started just before 5 UTC and in a short time led to more significant values with the Amplitude that reached Power 68 and the Frequency at 7.21 Hz at 6 UTC. These movements are still ongoing.
4/12 17:00 – Today’s activity lasted just over 10 hours, from 3 to 13 UTC. After the movements previously reported there is only to add the “closing” peak shortly after 13 UTC to Power 26, from that moment onward it has been calm. In exact correspondence, at 13 UTC, the Frequency quickly returned to normal values, the same applies to Quality. Compared to the latter, it can be seen that the pulse on 25 Hz of Quality Q4 is now much more sporadic than it has been in the past several days.
4/12 12:30 – We reached Power 49 about a few hours ago but that was still not the maximum today, the movements continued unabated and a new maximum at Power 61 was reached at 11 UTC. The quality also increased while the frequency remained very low, always below 7.30 Hz. At 11 UTC the ECC reached 111.
4/12 08:00 – The period of calm ended after 34 consecutive hours at 3 UTC today when a series of constantly increasing movements began which, after four hours, at 7 UTC, led to the maximum values reached so far of Power 37. This value was achieved with two consecutive spikes, just before and shortly after 7 UTC. From the graphs it can be seen that the Quality started moving around midnight and reached the maximum values also in correspondence of the Amplitude peaks. As far as Frequency is concerned, we see the usual drop towards minimum values as generally occurs when there are significant variations. A further movement that is currently underway has brought amplitude, which is continuing to rise, to Power 49.
4/11 17:00 – A day of total calm.
4/11 07:00 – From 15 UTC yesterday the calm was almost total with a very slight movement at Power 7 at 5 UTC and another, apparently also slight, at the time of this update. Quality and Frequency also remained around normal values.
4/10 17:00 – Calm.
4/10 15:00 – A new series of movements occurred from 13:30 UTC with the Amplitude reaching Power 39 followed shortly after, at 14:30, by another variation to Power 20. Once again after these two peaks the situation is calm.
4/10 13:00 – The previous movement was followed, about an hour later, by another variation of Amplitude which reached Power 34 at 10 UTC, in the following hours the movements decreased considerably. The frequency instead remains constantly above normal values and is reaching the peak of 7.95 Hz at the time of this update.
4/10 09:30 – The calm condition lasted almost 19 hours having started yesterday at 13 UTC, there were small movements during this period around 2 UTC today but there were light and isolated oscillations that had the maximum at Power 14. From 7 UTC instead we can see a green color in the main graph due to the changes in Quality and Frequency in the various meters and finally a massive peak that started at 8:20 UTC and within 30 minutes brought the amplitude to Power 61 at 8:50 UTC. Inversely from the movements of the past few days this time the Frequency, instead of decreasing, increase and reached 7.90 Hz during this strong movement. At the time of this update the Amplitude dropped again around Power 10 and the Frequency also returned to the normal value of 7.83 Hz.
4/09 17:00 – From 13 UTC the situation is calm. After about 36 hours in which Quality 4 has ‘cleaned up’ more sporadically it seems that it is now returning to the rhythm that it previously held. As for the frequency, it returned, within 2 hours from 11 to 13 UTC, at the normal rate of 7.83 Cycles per Second.
4/09 13:00 – The period of strong activity seems to have ended, it started at 4 UTC and the variations have reduced to normal levels at 13 UTC, the duration so far has therefore been 9 hours. The period of maximum intensity was from 8:30 to 10 UTC when the two maximum values of Power 62 and Power 63 were reached, during this phase of about 90 minutes the minimum was Power 50. Also the Frequency has now returned to rise to normal values.
4/09 09:30 – The strength of these variations continues to increase, at 9 UTC a new powerful movement has led the amplitude to reach the maximum at Power 58 while the frequency remains low at 7.33 Hz. At 9:20 UTC a further increase reached Power 62, the activity is continuing. All this with the Frequency getting lower and lower down to 7.26 Hz. As can be seen from the ECC table below from 5 UTC has been a steady and gradual increase.
4/09 07:00 – Once again after 14 hours of calm the activity started again at 4 UTC with a first peak at Power 27 shortly after 5 UTC, followed by a greater one which reached Power 33 shortly before 7 UTC. But these were not the strongest as at 7 UTC an even stronger movement reached Power 49. From the graphs it can be seen how the Quality Q4, which had graphically generated the dotted line around 25 Hz in the main graph, is having most sporadic movements. The frequency instead, as often happens during the most significant movements, had a sharp drop from 4 UTC reaching 7.28 and 7.31 Hz respectively during the two amplitude peaks.
4/08 17:00 – Today’s activity lasted about 12 hours, from 1 to 13 UTC. The most significant peaks occurred in the first part of the day when there was also a movement in the Frequency. From 13 UTC we returned to a calm situation.
4/08 12:30 – The movements are continuing, after a short decrease of about 2 hours, from 10 UTC we see a series of peaks first at Power 20 and then at Power 17 ending with Power 15 at the time of this update.
4/08 08:00 – After a period of calm that lasted for a day and a half, the activity started again at 1 UTC with movements that gradually increased. the first variation reached Power 10 and was followed by Power 16 at 3 am UTC. The two most significant movements so far have been at 5 and 7 UTC and have reached respectively Power 39 and Power 34. These corresponded, as often happens, to a drop in frequency down to 7.33 Hz. bringing ECC to 68.
4/07 23:30 – The slight movements continued in the first part of the new graphs until 19 UTC and then returned to calm, tending to remain slightly lower than normal, the remaining values are normal.
4/07 17:00 – The first part of today’s graphs show a calm condition with isolated slight movements around Power 10. From 13 UTC some movements of Quality and Frequency have started which have given a more intense coloring to the main graph and which would seem to suggest some incoming movement also in Amplitude.
4/07 08:00 – We are in a condition of almost calm, some isolated movements between 3 and 5 UTC have again reached Power 10
4/06 22:30 – The new charts show an almost calm situation, a slight promontory has brought amplitude to Power 10 at 20 UTC.
4/06 17:00 – Today was characterized by the tail of yesterday’s activity as well as new movements which, although they did not reach high Amplitude values, saw both the frequency and the Quality fluctuate significantly. Each of the 3 values, Quality, Amplitude and Frequency, have had variations at different times, first the Amplitude at Power 31, then the Quality with a strong oscillation from 1 to 3 UTC and then the increase in Frequency to 8.15 Hz between 6 and 7 UTC, in short, a very busy day.
4/06 08:30 – There has been no calm, just a decrease in the amplitude of the variations. The new graphs show a fluctuating situation with Power 31 which was reached at 19 UTC yesterday, followed by a sort of pause that ended at 24 with a movement at Power 22. This movement coincided with significant changes in Quality. and Frequency. At the time of this update, at 7 UTC, there has been a peak at Power 17.
4/05 23:30 – The movements slowed down for about 2 hours until 22 UTC when there is a slight increase towards Power 10. Interestingly, the Frequency is taking much longer to return to the usual values around 7.8 Hz. as shown in the above image. The drop has started a little after midnight UTC today so we are approaching the full 24 hours during which it has remained far below the normal 7.83 value.
4/05 19:30 – The activity decreased gradually in intensity and the new graphs show the descent down to values lower than Power 10. This is coupled with the slow increase in the frequency from just above 7 Hz to ‘normal’ values. It should be noted that in India at 15:30 UTC there was the switching off of the electric lights for 9 minutes with the lighting of candles or other sources of light and a sort of prayer, the Indians in total are more than a billion.
4/05 17:00 – To summarize today’s chart, the activity started at 1 UTC and 16 hours of strong activity that is still ongoing. At 16 UTC the amplitude returned below Power 30 going down to Power 17. The movements are continuing between Power 20 and 30. The frequency instead remains around 7.2 slightly rising.
4/05 15:30 – After a gradual series of peaks descending from Power 76 to Power 64, reached at around 12 UTC, a rapid decline began which at 14 UTC brought the amplitude to Power 10. This condition did not last long as shortly after the values started to increase to return around Power 40 at 14:30 UTC, remaining almost steady on this value until the time of this update.
4/05 11:30 – Starting from 8:30 UTC it seems that an even more intense phase has begun in which the amplitude of the variations has remained practically always above Power 60. The significant new peak at Power 74 occurred at 10:20 UTC and at the time of this update we are above Power 60. From the Frequency graph it can be seen that a sharp drop, bringing the frequency to around 7.2 Hz, started at 1 UTC and there remained for 10 consecutive hours.
4/05 10:00 – As mentioned earlier, from 3:30 am UTC the Amplitude has remained above Power 40 and we are still in this condition, so it is about 7 hours. An even more powerful phase began around 8:30 UTC and generated the maximum peak, so far, of Power 76. At the time of this update we are around Power 50 apparently rising. As can be seen from the ECC Table below, the maximum values recorded today exceed ECC 100, statistically speaking on February 27, 2020 we recorded an ECC of 378.
4/05 07:30 – We are in a powerful phase of activity that began with a first isolated peak at 1 UTC and shortly thereafter, around 2 o’clock, a constant growth began which brought the Amplitude above Power 40 a first time at 3:30 UTC. After a slight drop to Power 30 shortly thereafter, from 3:45 UTC until the time of this update we stayed above Power 40 reaching the maximum value so far of Power 65 at 5 UTC. From 4 UTC we are almost constantly above Power 50.
4/04 17:00 – The slight activity of today occurred from 6 to 13 UTC, the maximum peak was the one previously reported. From 1pm it was calm, apart from the usual dotted line of Q4 Quality.
4/04 13:00 – A day that has so far shown few and light movements, the variations began around 6 am UTC with amplitude around Power 10, at 8:40 UTC today’s peak reached Power 14. The slight movements of Quality and Frequency have given a colorful coloring to the main chart.
4/03 17:00 – Today’s strong activity lasted 6 hours, from 7 to 13 UTC. Now we are in a calm condition.
4/03 12:30 – The activity continued and even the increase in the maximum values, at 9 UTC we reached what has so far been the top at Power 49, it was not an isolated peak but embedded in a sequence, lasting about 2 hours from 9 to 11 UTC, in whose amplitude remained constantly above Power 30. A second peak at Power 48 was recorded an hour later, at 10 UTC. At the time of this update we are on Power 30 threshold.
4/03 08:30 – The data have returned and have also filled in the missing part, the graphic result is quite particular and also the detection of Frequency Amplitude and Quality shows a sort of broken line with the values that remain fixed for periods of an hour or more. It is difficult to say whether it is a technical fact and they are really the representation of the movements taking place. We have previously seen this series of dense vertical lines but what we see today is probably unique, like the times in which we find ourselves in. Even the usual 25 Hz line of the Quality Q4 has become more pronounced, almost continuous for a stretch of 4 hours. The amplitude instead records a movement taking place at the time of this update which reached Power 35 at 8 UTC.
4/02 17:00 – There appears to be an interruption in the flow of data that are stuck at 14 UTC, the TSU site works. When they will become available again we will immediately update the situation and the graphs.
4/02 13:30 – After a start to the day that mirrored the previous days with a series of isolated peaks between Power 10 and 15, at 10 UTC there was a powerful increase in activity that led to the maximum value so far of Power 46 at 11 UTC; this strong movement, which has maintained amplitude above Power 30 for about two consecutive hours, appears to have ended at 13 UTC.
4/01 17:00 – Today was characterized by moderate isolated peaks and by the ‘usual’ hatching on 25 Hz, the values were on average between Power 10 and 15, one last movement reached Power 17 at 12:30 UTC.
4/01 10:30 – Once again 10 hours of almost calm, this has been interrupted at 23 UTC yesterday by slight movements around Power 10. These are mostly isolated peaks in sequence and the strongest reached Power 23 just before 7 UTC.
Frequency means how many wave cycle happen in a second, 1 Hz. means 1 cycle per second, 40 Hz. means 40 cycles per second, Amplitude is the size of the vibration, how big is the wave, the chart shows the frequency variation in Hz and the amplitude using the white color.
Note
The Ancient Indian Rishis called 7.83 Hz the frequency of OM. It also happens to be Mother Earth’s natural heartbeat rhythm Schumann resonances are named after professor Schumann who was involved in early German secret space program and was later paper-clipped into the United States. The frequencies of Schumann resonances are fairly stable and are mainly defined by the physical size of the ionospheric cavity. The amplitude of Schumann resonances does change and is bigger when ionospheric plasma gets excited. Ionospheric plasma excitation happens because of solar activity, thunderstorms, use of scalar plasma weapons and HAARP and lately also when the Light forces are clearing the plasma anomaly. Show entriesSearch:
All the SR daily images in one single page See the Images
Explanation of The Chart
The Schumann Resonance Spectrogram Chart
The Schumann Resonance Chart displays data from the magnetic field detector to monitor the resonances occurring in the plasma waves constantly circling the earth in the ionosphere. These three days spectrograms show the activity occurring at the various resonant frequencies from 1 to 40 Hz. Within the spectrogram, the power, or intensity level of each frequency is displayed as a color, with white being the most intense. The Schumann Resonances appear as the horizontal lines at 0.0, 4.0, 8.0, 12.0, 16.0, 20.0, 24.0, 28.0, 32.0, 36.0 & 40.0 Hz. This chart is based on Tomsk, Russia, time UTC +7 (UTC = Universal Time Coordinated).
What is a Spectrogram?
The Spectrogram Calendar is a visual representation of the range of frequencies in the magnetic field at a given location. Similar to how an equalizer displays the frequency content of music played on your stereo, the spectrogram calendar displays the frequency content of a magnetic field. Instead of showing a brief snapshot, it shows changes over a period of time, in this case 3 days.
The local magnetic field is a dynamic field that changes constantly because of variations in the ionosphere and sun and many other influences not yet fully understood. The range of variation displayed in the spectrogram chart is from 0 to 40 cycles per second. The vertical axis is frequency and the horizontal axis is time. The amplitude of a particular frequency at a specific time is represented by the intensity of color (green, yellow, white) of each point in the image.
A group of over 100 MPs and Peers have called on the UK government to prepare some form of recovery Universal Basic Income (UBI) to protect citizens from the impending financial crisis resulting from the coronavirus pandemic. The group, which includes signatories from Labour, Liberal Democrats, Green Party, Scottish National Party, Plaid Cymru (the party of Wales), and Northern Ireland’s Social Democratic and Labour Party, claims that “84% of the public now support the introduction of a UBI” in addition to “support from seven parties across all four nations.”
Having gone through three months of tense testing for exceptional precision, ESA (European Space Agency) planet hunter CHEOPS, which stands for Characterising ExOPlanet Satellite, is ready to comb outer space for heavenly bodies outside – and far away from – our solar system. In March, the cutting-edge space telescope began looking at well-known star systems: for instance, the last two weeks were spent observing two stars that are known to host exoplanets.
Kim Jong-un’s younger sister, who is currently first vice-department director of the ruling Workers’ Party is believed to have been slowly but surely ascending through the party ranks for the past few years, and has recently been seen by her brother’s side at key political gatherings. Rumors say that North Korea has been drawing up a contingency plan overseeing the transfer of power to Kim Jong-un’s younger sister, Kim Yo-jong, in the event of an emergency. The report said that the North Korean Workers’ Party Central Committee had decided at an internal plenary meeting late last year that should Kim Jong-un die or be rendered unable to govern the country, Kim Yo-jong should take over.
Spanish security services have arrested a top-tier Islamic State militant, who’d sneaked into the country after waging jihad in Syria and Iraq. The fugitive and his accomplices tried to blend in by wearing compulsory face masks. Police and intelligence agents forced entry into an apartment rented by the terrorism suspect and two of his accomplices in the province of Andalusia on Wednesday, Spain’s interior ministry revealed. The militant, said to be of Egyptian nationality, had somehow managed to illegally cross into Spain by sea, it emerged. Without disclosing his name, the ministry said he was “one of the most wanted terrorists in Europe, both because of his criminal record in Daesh [Arabic acronym for Islamic State/ISIL] and for the high danger he posed.”
The CIA had a shot at taking down former Al Qaeda leader Osama bin Laden back in the 1990s, but was prohibited from doing so by order of then US President Bill Clinton, former agency station chief Bob Grenier revealed in the Showtime documentary “The Longest War”. According to him, “lethal activity” against bin Laden was sanctioned only on the condition that it wouldn’t result in his death, the former CIA agent clarified. “Our tribal contacts came to us and said, ‘Look, he’s in this location now. When he leaves, he’s going to have to go through this particular crossroads’. [… T]hey proposed to bury a huge cache of explosives underneath those crossroads so that when his convoy came through they could simply blow it up. And we said absolutely not. We were risking jail if we didn’t tell them that”, Grenier said.
Having analysed the public appearances of US President hopeful Joe Biden, Norwegian psychiatrist Fred Heggen has noted an obvious congitive failure in his mental health, which may be a sign of worsening dementia. What began as minor episodes when Biden started his election campaign to become the Democratic presidential candidate – “forgetfulness, mischief, confusions, gaffes, and aggression” – has worsened “at galloping speed”, Heggen noted in an opinion piece published by Nettavisen. In the piece called “Why Democrats are rallying behind a possibly demented candidate?” Heggen pointed out that Biden is now largely screened from contact with the media and the public. When he appears, the speech lasts a maximum of 10 minutes. Biden is either instructed via an earpiece or reads the text on a teleprompter. No questions from the press are allowed. The few times Biden took part in an actual debate, he struggled with impaired concentration, memory loss, and sudden blocks of thought, he said. [Think HRC]
The default mailing app pre-installed on millions of iPhones and iPads has been found vulnerable to two critical flaws that attackers are exploiting in the wild, at least, from the last two years to spy on high-profile victims. The flaws could eventually let remote hackers secretly take complete control over Apple devices just by sending an email to any targeted individual with his email account logged-in to the vulnerable app. According to the researchers, both flaws existed in various models of iPhone and iPad for the last 8 years since the release of iOS 6 and, unfortunately, also affect the current iOS 13.4.1 with no patch yet update available for the regular versions.
Afghanistan says it has released another 71 Taliban prisoners in a further step toward bringing the two sides together to negotiate a peace settlement.
Afghan officials say 19 pro-government forces have been killed in Taliban attacks in the northern province of Takhar. The Taliban militants attacked local forces operating under the command of the Afghan National Army in Khwaja Ghar district from several directions overnight. The Defense Ministry said the attacks had been repulsed and that the Taliban had suffered casualties. The Taliban did not immediately comment on the assaults.
The prices of actual barrels of multiple crude streams in Europe, Asia and Africa have plunged to as little as $5 a barrel, dragging down the entire physical oil market and increasingly distressing major producers. The slide is a sign of how far refinery demand has fallen. Plants from Portugal to Italy and the U.S. have shut down since the crisis began as their storage tanks are full. Consumption of some oil products in France as fallen by as much as 95% since the coronavirus pandemic began. Total SA said recently that it might not be able to keep its refineries open for another month.
The Mekong River Commission has said that a new study blaming the drought which struck Mekong countries last year on Chinese dams is ‘premature,’ and that more evidence is necessary. “Our preliminary analysis, using rainfall data from 2008 to 2019 and observed water flows, showed that the 2019 drought was due largely to very low rainfall during the wet season with a delayed arrival and earlier departure of monsoon rains, and an El Nino event that created an abnormally higher temperature and higher evapotranspiration,” the commentary note reads. “In 2019, the monsoon rains began almost two weeks late and stopped about three weeks earlier than usual,” it added. “The basin lost about five weeks of rain and only received about 75% of rainfall as compared to previous years.”
Attorney General William Barr said there is nothing stopping the Justice Department from announcing indictments from U.S. Attorney John Durham’s investigation during the election season, as none of the presidential candidates are under review. Barr made the comments during a radio interview where he was asked about potential guidelines affecting Durham’s investigation that required the U.S. attorney to announce indictments or close his investigation prior to the 2020 presidential election. “As far as I’m aware, none of the key people that, whose actions are being reviewed at this point by Durham, are running for president,” Barr said.
President Donald Trump responded to reports on North Korean dictator Kim Jong Un’s health. On Tuesday, reports citing anonymous sources claimed Kim was gravely ill following surgery. “We don’t know” his status, Trump told reporters during a daily briefing on the CCP virus pandemic. “I wish him well, because if he’s in the kind of condition the reports say, that’s a very serious condition,” Trump said, without confirming recent reports about his health.
Sun Activity
Solar wind remains fast but the density of the stream has dropped out. Geomagnetic conditions remain calm amidst the weaker solar wind condition.
Sunspot number: 0 Spotless Days Current Stretch: 17 days 2020 total: 87 days (77%) 2019 total: 281 days (77%)
Strongest EQ in Europe M3.3 Rodhos, Greece Strongest EQ in North America M3.7 California Strongest EQ on the Planet 5.0 Gulf of Aden Deepest EQ M4.4 416 km Izu Islands, Japan News Burst 23 April 2020
Share this: Send the word out using these buttons!
Editor’s Note: Well, well…the Schumann Resonance energy graph was quiet again today and perhaps this is in keeping with something I have just learned of… the Festival of Ridvan (a major Baih’i time of celebration) which curiously enough, will end on May 1.
You may want to research a bit about this faith, and keep a watch on the Schumann Resonance chart. I personally envision some pretty great things happening on this world on May 1, when we may all very well BE in…
Schumann Resonance Today. We will try to keep you updated about the variations of the Resonance with this page. The great variations that nobody can explain but that give us a clear sign that the planet is changing. The Earth is vibration higher and higher, just like us!
The Chart time is based on Tomsk – Russia – UTC (Universal Time Coordinated) +7 –Source
SR Base Frequency 7.83 Hz. – Schumann Resonance Today’s Peaks
15
Amplitude
6.80
Quality
8.10
Frequency Max
7.43
Frequency Min
“Every second, a multitude of pulses travel around the world in this unique, resonant chamber between Earth and the ionosphere, sending colluding signals to all microorganisms. These signals couple us to the Earth’s magnetic field. Named after their discoverer, these Schumann Resonances (SR) drive the harmonizing pulse for life in our world.” Eric Thompson
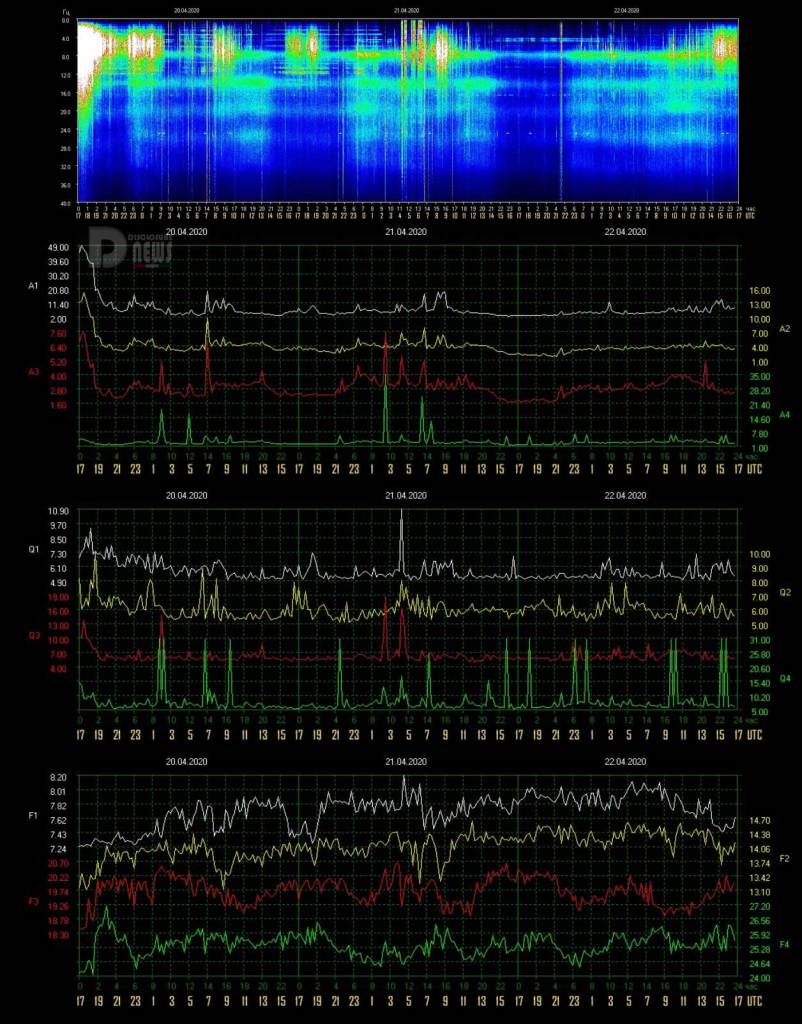
4/22 17:00 – In the last hours, starting from 9 UTC, there has been a slight increase in movements. The amplitude oscillations, which started below Power 10, have increased, even if not very intensely, from 14 UTC to reach today’s maximum around Power 15 at 15:30 UTC. These movements went hand in hand with the decrease in Frequency, which also started at 9 UTC, which reached today’s low at 7.42 Hz at 15:30 UTC.
4/22 08:00 – The activity is continuing to gradually decrease and all the graphs show normal values, the only movement of the amplitude that stands out occurred at 3 UTC and reached Power 12. Compared to the hours at the turn of the local midnight, or 17 UTC, where we have flat calm, from the last few hours there are modest variations of the Quality that have given the main graph a green coloring. Frequency today has remained almost constantly above the base value.
4/21 17:00 – The movements previously reported have been all of today’s activity, since the last few hours we are in a calm condition.
4/21 10:00 – The new graphs show a very slight activity in the first part with oscillations that sporadically reached Power 10, from 5 UTC the movements became slightly more intense with the Amplitude that reached Power 18 a first time at 6:30 UTC. This intensification is due to a drop in frequency which has gone down to around 7.60 Hz from 6 am. From 6 to 7 UTC we have had the maximum values so far that have reached Power 19.
4/20 17:00 – Today, if compared with the previous days, is certainly a calm day, the most significant movements have remained those we have reported previously, instead we should note the Frequency graph, what seems to be a strong increase is actually is in realty the return to values close to the Base Frequency of 7.83 while in the last 2 hours, from 15 UTC, there has been a new dive towards a lower number of cycles per second, we shall see in few hours if this has been an indicator of new activity or only a momentary variation.
4/20 10:00 – We are in a moment of low activity after a day and a half of very strong movements. After midnight on the local timeline, 17 UTC, the graphs show the final part of the sequence of peaks with Amplitude at Power 50, within 3 hours, at 20 UTC, this returned to normal values, some variations around Power 17 happened at 23 UTC when the Frequency started strong fluctuations that increased from 3 UTC and are still in progress. During these fluctuations a new peak at Power 20 occurred at 6 o’clock UTC followed by other movements below this value.
4/19 20:00 – Forty, the amount of consecutive hours of activity, more or less powerful but never interrupted. Through midnight of the local timeline or 17 UTC, for two hours we floated oat Power 40 while at the time of this update we record a new drop towards Power 10. Despite this decrease, the Frequency remains at minimum values so, once again, we are not yet at the conclusion of this very strong ‘upgrade’ phase.
4/19 17:00 – This activity does not seem to end, we had two hours of decrease in intensity from 13 to 15 UTC when the amplitude started again to increase and at 16 reached Power 45 that was practically maintained until the time of this update. The Frequency has further flattened towards the minimum suggesting that we will continue for another little bit with this “cure”.
4/19 12:30 – We know where to look during this prolonged activity, we can see that the Frequency is still very low and therefore we can expect other movements. At the time of this update we are around Power 50 with a strong increase in Quality.
4/19 09:45 – Down the Frequency and up the Amplitude bring the Energy of the Collective Current once again close to 150. The peak at Power 88 occurred at 7:45 UTC, during a period started at 7:30 until just before 9 when we remained constantly above Power 65. After a slight drop to Power 50 at 9 we have now returned to a very strong Power 68 increasing. Once again the Frequency remains low, as it has been for more than 24 consecutive hours.
4/19 07:30 – As can be seen from the graphs, there was no interruption in the activity, only a moment at the turn of midnight UTC, then an increase in the Frequency to 7.60 Hz coincided with a decrease in the Amplitude under Power 10. The Frequency then returned around 7.30 Hz and the increase in amplitude was immediate returning to Power 50 at 1 UTC. After this wide swing, the trend returned again to a marked increase from 3 UTC and within a few hours we had a new Power 65 maximum at 6 UTC. Frequency continues to be very low. The Amplitude Frequency comparison image gives you, hopefully, a clearer correlation between the the parameters. MOAR coming?
4/18 22:00 – What stands out most in these graphs is the Frequency, which remained constant between 7.20 and 7.30 Hz. As long as the Frequency remains so low, the movements will continue, this consideration derives from the statistical analysis of the many movements that we have kept track of. Significant movements almost always end when the Frequency returns to normal values and this time the exception confirmed the rule with continuous changes in Amplitude which again rose to Power 35 little after 21 UTC. We are now at 20 consecutive hours of activity.
4/18 19:00 – We are in a ‘roller coaster’ moment, after the peak at Power 68 around 16:30 there was a slight decrease down to Power 27 and then a new ascent to Power 51 at 18:15. After this a new descent to Power 27. Note that the Frequency continues to remain at minimum levels, around 7.25 Hz, a likely indicator that the activity is not yet ended.
4/18 17:00 – The activity is not over yet, after a short period in which the movements brought the Amplitude down to Power 10 around 15 UTC, from 16 very strong movements restarted which culminated shortly before 17 UTC with Power 68. As we previously reported, the Frequency has always remained at very low values, an indicator that the activity was not finished despite the reduction of the Amplitude peaks. A trending increase can also be seen in the Quality graph where we can see the maximum value of today at 12.40. The activity is evidently continuing very significantly.
4/18 13:30 – We take advantage of this break of the most intense phase to summarize the day. From 5:30 to 12:30 UTC, 7 hours, we have been above Power 70; within this period, from 9 to 10:30 UTC, we remained above Power 85 while for most of the time between 9 and 10 UTC we were above Power 100. In regards Quality, throughout this very strong activity, it remained at normal values, the two peaks were at the beginning and end of this phase. The Frequency, on the other hand, remained low, around 7.30 Hz, for the entire duration and although there is a decrease in the variations at the time of this update, it still remains on these values.
4/18 10:00 – MOAR; Another increase in an activity that was already very strong. The ECC is nearing 200 with this peak at Power 110 accompanied by an inverse peak of Frequency at 7.26 Hz. This maximum was reached at 9.15 UTC. It is more than 4 consecutive hours that we are above Power 70!
4/18 08:30 – The very strong movements continue, from 5:30 UTC until now we have remained above Power 70, during this period there were two Amplitude peaks that reached Power 90, one just before 7 and the second one hour later at 8 UTC. The Quality has dropped after the initial peak previously reported while the Frequency as ‘usual’ remains very low. The ECC during this very intense phase remained around 140.
4/18 06:30 – We are definitely on the move, after more than a day of almost total calm, from 3 am UTC movements have started, currently in progress, which within 3 hours, with a rapid increase, have brought Amplitude to Power 77 at 6 UTC. The others Resonance parameters followed in agreement confirming that the strength of these variations is significant. The Quality as well, from 3 UTC, began to grow while Frequency began a significant drop towards the minimum of 7.24 Hz which is the lowest value reached in the last 3 days. At the time of this update there was a further increase in Power 81.
4/17 17:00 – The situation has not changed, still almost total calm. The only relevant figure is a lowering of the Frequency towards the minimum value reached today of 7.45 Hz.
4/17 10:30 – Not much to report so far, the situation is almost complete calm after the moderate movement previously reported. A slight variation at 1 UTC reached Power 10 after which it has been calm.
4/16 17:00 – The new graphs show how the activity, that is about to enter Coincidence 17 (in UTC time as in local time it’s already 17) is continuing. At 18 UTC a new movement brought Amplitude to Power 20 accompanied by wide variations in Quality. The Frequency, as can be seen from the relative graph, continues to remain on normal values.
4/16 17:00 – If we want to say that there was calm it did not last long, around 9 UTC, for the duration of about an hour, we see a movement that reached Power 15. About 4 hours later, at 14, a new short series of isolated peaks reached Power 28; the latter movement coincides with a significant variation in the Quality which has again approached today’s maximum values while the Frequency has tended to remain normal, except in the period between 9 and 10 UTC when the Amplitude has reached, as mentioned above, Power 15.
4/16 08:00 – There hasn’t been much calm since the last update, the movements have been light and sporadic. The most active phase so far has been from 1 to 5 UTC, during this period a first variation reached Power 30 at 2 UTC while a stronger phase around 4 UTC generated the maximum peak of Power 35. Frequency today has not had significant movements fluctuating around the base value while Quality instead had strong fluctuations in the period in which the amplitude peaks occurred. Now the situation seems to have calmed down considerably.
4/15 17:00 – After 14 UTC, when there was a movement at Power 20, the situation returned calm and it’s still calm.
4/15 13:00 – After the movements previously reported, the activity continued sparsely with peaks around Power 15, this until 12 UTC when, in correspondence with a strong rise in the Frequency towards the maximum of the last few days at 8.05 Hz, we have had the most significant movement so far that has reached Power 43. After this sharp surge we continue to see the Frequency always above 8 Hz and the Amplitude that has returned around Power 15.
4/15 09:00 – Just after midnight UTC the calm condition was interrupted by two isolated peaks at Power 15 and Power 17 and at the same time fluctuations in Quality began without however reaching very significant values. The frequency remained on normal parameters even if a trending decrease is noted from 5 UTC.
4/14 17:00 – Based on the Frequency line graph we can see that today the most active phase has been from 6 to 13 UTC, when the Frequency had a significant drop down to 7.29 Hz at 10 UTC. In fact, this minimum peak corresponds to the maximum peak of Amplitude at Power 28 and also to a decisive movement of Quality. Since 13 UTC the situation has calmed considerably and we are now in a calm condition.
4/14 08:00 – From the coloring of the graph it can be seen that the period of complete calm started at 14 UTC yesterday until just before 23 when a slight movement reached Power 10. This seems to have been the beginning of light isolated peaks, at Power 20 at 1:30 UTC, at Power 28 at 6 UTC. As for the other measured parameters, the Quality interrupted the changes in Q4 at local midnight, 17 UTC yesterday. The Frequency instead, after remaining above average in the final part of the yesterday’s graph, again from midnight local/17 UTC and therefore coinciding with Q4 Quality ‘interruption’, has risen to very high values, above 8 Hz with a maximum 8,03 Hz, held for about six hours until 24 UTC. From 4 UTC there is a Frequency sudden drop, probably an indication of some stronger incoming movement, down to today’s minimum which is 7.42 Hz.
4/13 17:00 – Today’s activity, if we look only to the Amplitude, had a relatively short duration, just over nine hours, from 2 to 11 UTC, but was very intense in the phase from 5 to 7 this morning UTC, for the European continent it was in full REM phase. During these two hours we have been constantly on Power 40. The movements of Quality have been lower than yesterday and we can see the resumption of the ‘modulation’ of Quality Q4 on the 25 Hz line. The Frequency is the one that today has undergone the most ‘ups and downs’ and returned to normal values at 12 UTC; practically today it has continued to fluctuate widely throughout the 24 hours.
4/13 08:00 – From the new graphs we note that there was no real calm, only a few hours after 14 UTC but shortly afterwards some slight changes in Quality and Frequency began which were accompanied slightly later by the Amplitude that reached Power 15 at 1 UTC. This movement was characterized by a gradual drop in frequency up to 7.35 Hz. This has been the “opening” of much more substantial variations which started just before 5 UTC and in a short time led to more significant values with the Amplitude that reached Power 68 and the Frequency at 7.21 Hz at 6 UTC. These movements are still ongoing.
4/12 17:00 – Today’s activity lasted just over 10 hours, from 3 to 13 UTC. After the movements previously reported there is only to add the “closing” peak shortly after 13 UTC to Power 26, from that moment onward it has been calm. In exact correspondence, at 13 UTC, the Frequency quickly returned to normal values, the same applies to Quality. Compared to the latter, it can be seen that the pulse on 25 Hz of Quality Q4 is now much more sporadic than it has been in the past several days.
4/12 12:30 – We reached Power 49 about a few hours ago but that was still not the maximum today, the movements continued unabated and a new maximum at Power 61 was reached at 11 UTC. The quality also increased while the frequency remained very low, always below 7.30 Hz. At 11 UTC the ECC reached 111.
4/12 08:00 – The period of calm ended after 34 consecutive hours at 3 UTC today when a series of constantly increasing movements began which, after four hours, at 7 UTC, led to the maximum values reached so far of Power 37. This value was achieved with two consecutive spikes, just before and shortly after 7 UTC. From the graphs it can be seen that the Quality started moving around midnight and reached the maximum values also in correspondence of the Amplitude peaks. As far as Frequency is concerned, we see the usual drop towards minimum values as generally occurs when there are significant variations. A further movement that is currently underway has brought amplitude, which is continuing to rise, to Power 49.
4/11 17:00 – A day of total calm.
4/11 07:00 – From 15 UTC yesterday the calm was almost total with a very slight movement at Power 7 at 5 UTC and another, apparently also slight, at the time of this update. Quality and Frequency also remained around normal values.
4/10 17:00 – Calm.
4/10 15:00 – A new series of movements occurred from 13:30 UTC with the Amplitude reaching Power 39 followed shortly after, at 14:30, by another variation to Power 20. Once again after these two peaks the situation is calm.
4/10 13:00 – The previous movement was followed, about an hour later, by another variation of Amplitude which reached Power 34 at 10 UTC, in the following hours the movements decreased considerably. The frequency instead remains constantly above normal values and is reaching the peak of 7.95 Hz at the time of this update.
4/10 09:30 – The calm condition lasted almost 19 hours having started yesterday at 13 UTC, there were small movements during this period around 2 UTC today but there were light and isolated oscillations that had the maximum at Power 14. From 7 UTC instead we can see a green color in the main graph due to the changes in Quality and Frequency in the various meters and finally a massive peak that started at 8:20 UTC and within 30 minutes brought the amplitude to Power 61 at 8:50 UTC. Inversely from the movements of the past few days this time the Frequency, instead of decreasing, increase and reached 7.90 Hz during this strong movement. At the time of this update the Amplitude dropped again around Power 10 and the Frequency also returned to the normal value of 7.83 Hz.
4/09 17:00 – From 13 UTC the situation is calm. After about 36 hours in which Quality 4 has ‘cleaned up’ more sporadically it seems that it is now returning to the rhythm that it previously held. As for the frequency, it returned, within 2 hours from 11 to 13 UTC, at the normal rate of 7.83 Cycles per Second.
4/09 13:00 – The period of strong activity seems to have ended, it started at 4 UTC and the variations have reduced to normal levels at 13 UTC, the duration so far has therefore been 9 hours. The period of maximum intensity was from 8:30 to 10 UTC when the two maximum values of Power 62 and Power 63 were reached, during this phase of about 90 minutes the minimum was Power 50. Also the Frequency has now returned to rise to normal values.
4/09 09:30 – The strength of these variations continues to increase, at 9 UTC a new powerful movement has led the amplitude to reach the maximum at Power 58 while the frequency remains low at 7.33 Hz. At 9:20 UTC a further increase reached Power 62, the activity is continuing. All this with the Frequency getting lower and lower down to 7.26 Hz. As can be seen from the ECC table below from 5 UTC has been a steady and gradual increase.
4/09 07:00 – Once again after 14 hours of calm the activity started again at 4 UTC with a first peak at Power 27 shortly after 5 UTC, followed by a greater one which reached Power 33 shortly before 7 UTC. But these were not the strongest as at 7 UTC an even stronger movement reached Power 49. From the graphs it can be seen how the Quality Q4, which had graphically generated the dotted line around 25 Hz in the main graph, is having most sporadic movements. The frequency instead, as often happens during the most significant movements, had a sharp drop from 4 UTC reaching 7.28 and 7.31 Hz respectively during the two amplitude peaks.
4/08 17:00 – Today’s activity lasted about 12 hours, from 1 to 13 UTC. The most significant peaks occurred in the first part of the day when there was also a movement in the Frequency. From 13 UTC we returned to a calm situation.
4/08 12:30 – The movements are continuing, after a short decrease of about 2 hours, from 10 UTC we see a series of peaks first at Power 20 and then at Power 17 ending with Power 15 at the time of this update.
4/08 08:00 – After a period of calm that lasted for a day and a half, the activity started again at 1 UTC with movements that gradually increased. the first variation reached Power 10 and was followed by Power 16 at 3 am UTC. The two most significant movements so far have been at 5 and 7 UTC and have reached respectively Power 39 and Power 34. These corresponded, as often happens, to a drop in frequency down to 7.33 Hz. bringing ECC to 68.
4/07 23:30 – The slight movements continued in the first part of the new graphs until 19 UTC and then returned to calm, tending to remain slightly lower than normal, the remaining values are normal.
4/07 17:00 – The first part of today’s graphs show a calm condition with isolated slight movements around Power 10. From 13 UTC some movements of Quality and Frequency have started which have given a more intense coloring to the main graph and which would seem to suggest some incoming movement also in Amplitude.
4/07 08:00 – We are in a condition of almost calm, some isolated movements between 3 and 5 UTC have again reached Power 10
4/06 22:30 – The new charts show an almost calm situation, a slight promontory has brought amplitude to Power 10 at 20 UTC.
4/06 17:00 – Today was characterized by the tail of yesterday’s activity as well as new movements which, although they did not reach high Amplitude values, saw both the frequency and the Quality fluctuate significantly. Each of the 3 values, Quality, Amplitude and Frequency, have had variations at different times, first the Amplitude at Power 31, then the Quality with a strong oscillation from 1 to 3 UTC and then the increase in Frequency to 8.15 Hz between 6 and 7 UTC, in short, a very busy day.
4/06 08:30 – There has been no calm, just a decrease in the amplitude of the variations. The new graphs show a fluctuating situation with Power 31 which was reached at 19 UTC yesterday, followed by a sort of pause that ended at 24 with a movement at Power 22. This movement coincided with significant changes in Quality. and Frequency. At the time of this update, at 7 UTC, there has been a peak at Power 17.
4/05 23:30 – The movements slowed down for about 2 hours until 22 UTC when there is a slight increase towards Power 10. Interestingly, the Frequency is taking much longer to return to the usual values around 7.8 Hz. as shown in the above image. The drop has started a little after midnight UTC today so we are approaching the full 24 hours during which it has remained far below the normal 7.83 value.
4/05 19:30 – The activity decreased gradually in intensity and the new graphs show the descent down to values lower than Power 10. This is coupled with the slow increase in the frequency from just above 7 Hz to ‘normal’ values. It should be noted that in India at 15:30 UTC there was the switching off of the electric lights for 9 minutes with the lighting of candles or other sources of light and a sort of prayer, the Indians in total are more than a billion.
4/05 17:00 – To summarize today’s chart, the activity started at 1 UTC and 16 hours of strong activity that is still ongoing. At 16 UTC the amplitude returned below Power 30 going down to Power 17. The movements are continuing between Power 20 and 30. The frequency instead remains around 7.2 slightly rising.
4/05 15:30 – After a gradual series of peaks descending from Power 76 to Power 64, reached at around 12 UTC, a rapid decline began which at 14 UTC brought the amplitude to Power 10. This condition did not last long as shortly after the values started to increase to return around Power 40 at 14:30 UTC, remaining almost steady on this value until the time of this update.
4/05 11:30 – Starting from 8:30 UTC it seems that an even more intense phase has begun in which the amplitude of the variations has remained practically always above Power 60. The significant new peak at Power 74 occurred at 10:20 UTC and at the time of this update we are above Power 60. From the Frequency graph it can be seen that a sharp drop, bringing the frequency to around 7.2 Hz, started at 1 UTC and there remained for 10 consecutive hours.
4/05 10:00 – As mentioned earlier, from 3:30 am UTC the Amplitude has remained above Power 40 and we are still in this condition, so it is about 7 hours. An even more powerful phase began around 8:30 UTC and generated the maximum peak, so far, of Power 76. At the time of this update we are around Power 50 apparently rising. As can be seen from the ECC Table below, the maximum values recorded today exceed ECC 100, statistically speaking on February 27, 2020 we recorded an ECC of 378.
4/05 07:30 – We are in a powerful phase of activity that began with a first isolated peak at 1 UTC and shortly thereafter, around 2 o’clock, a constant growth began which brought the Amplitude above Power 40 a first time at 3:30 UTC. After a slight drop to Power 30 shortly thereafter, from 3:45 UTC until the time of this update we stayed above Power 40 reaching the maximum value so far of Power 65 at 5 UTC. From 4 UTC we are almost constantly above Power 50.
4/04 17:00 – The slight activity of today occurred from 6 to 13 UTC, the maximum peak was the one previously reported. From 1pm it was calm, apart from the usual dotted line of Q4 Quality.
4/04 13:00 – A day that has so far shown few and light movements, the variations began around 6 am UTC with amplitude around Power 10, at 8:40 UTC today’s peak reached Power 14. The slight movements of Quality and Frequency have given a colorful coloring to the main chart.
4/03 17:00 – Today’s strong activity lasted 6 hours, from 7 to 13 UTC. Now we are in a calm condition.
4/03 12:30 – The activity continued and even the increase in the maximum values, at 9 UTC we reached what has so far been the top at Power 49, it was not an isolated peak but embedded in a sequence, lasting about 2 hours from 9 to 11 UTC, in whose amplitude remained constantly above Power 30. A second peak at Power 48 was recorded an hour later, at 10 UTC. At the time of this update we are on Power 30 threshold.
4/03 08:30 – The data have returned and have also filled in the missing part, the graphic result is quite particular and also the detection of Frequency Amplitude and Quality shows a sort of broken line with the values that remain fixed for periods of an hour or more. It is difficult to say whether it is a technical fact and they are really the representation of the movements taking place. We have previously seen this series of dense vertical lines but what we see today is probably unique, like the times in which we find ourselves in. Even the usual 25 Hz line of the Quality Q4 has become more pronounced, almost continuous for a stretch of 4 hours. The amplitude instead records a movement taking place at the time of this update which reached Power 35 at 8 UTC.
4/02 17:00 – There appears to be an interruption in the flow of data that are stuck at 14 UTC, the TSU site works. When they will become available again we will immediately update the situation and the graphs.
4/02 13:30 – After a start to the day that mirrored the previous days with a series of isolated peaks between Power 10 and 15, at 10 UTC there was a powerful increase in activity that led to the maximum value so far of Power 46 at 11 UTC; this strong movement, which has maintained amplitude above Power 30 for about two consecutive hours, appears to have ended at 13 UTC.
4/01 17:00 – Today was characterized by moderate isolated peaks and by the ‘usual’ hatching on 25 Hz, the values were on average between Power 10 and 15, one last movement reached Power 17 at 12:30 UTC.
4/01 10:30 – Once again 10 hours of almost calm, this has been interrupted at 23 UTC yesterday by slight movements around Power 10. These are mostly isolated peaks in sequence and the strongest reached Power 23 just before 7 UTC.
Frequency means how many wave cycle happen in a second, 1 Hz. means 1 cycle per second, 40 Hz. means 40 cycles per second, Amplitude is the size of the vibration, how big is the wave, the chart shows the frequency variation in Hz and the amplitude using the white color.
Note
The Ancient Indian Rishis called 7.83 Hz the frequency of OM. It also happens to be Mother Earth’s natural heartbeat rhythm Schumann resonances are named after professor Schumann who was involved in early German secret space program and was later paper-clipped into the United States. The frequencies of Schumann resonances are fairly stable and are mainly defined by the physical size of the ionospheric cavity. The amplitude of Schumann resonances does change and is bigger when ionospheric plasma gets excited. Ionospheric plasma excitation happens because of solar activity, thunderstorms, use of scalar plasma weapons and HAARP and lately also when the Light forces are clearing the plasma anomaly. Show entriesSearch:
All the SR daily images in one single page See the Images
Explanation of The Chart
The Schumann Resonance Spectrogram Chart
The Schumann Resonance Chart displays data from the magnetic field detector to monitor the resonances occurring in the plasma waves constantly circling the earth in the ionosphere. These three days spectrograms show the activity occurring at the various resonant frequencies from 1 to 40 Hz. Within the spectrogram, the power, or intensity level of each frequency is displayed as a color, with white being the most intense. The Schumann Resonances appear as the horizontal lines at 0.0, 4.0, 8.0, 12.0, 16.0, 20.0, 24.0, 28.0, 32.0, 36.0 & 40.0 Hz. This chart is based on Tomsk, Russia, time UTC +7 (UTC = Universal Time Coordinated).
What is a Spectrogram?
The Spectrogram Calendar is a visual representation of the range of frequencies in the magnetic field at a given location. Similar to how an equalizer displays the frequency content of music played on your stereo, the spectrogram calendar displays the frequency content of a magnetic field. Instead of showing a brief snapshot, it shows changes over a period of time, in this case 3 days.
The local magnetic field is a dynamic field that changes constantly because of variations in the ionosphere and sun and many other influences not yet fully understood. The range of variation displayed in the spectrogram chart is from 0 to 40 cycles per second. The vertical axis is frequency and the horizontal axis is time. The amplitude of a particular frequency at a specific time is represented by the intensity of color (green, yellow, white) of each point in the image.