AG Barr made it clear that he had held over Mr Rosenstein to use him
during the release of the Mueller Report. That being done, he’s free
once again to remove himself post haste…
For all large gatherings this is a good reminder! Be vigilant at all times. See Something. Say Something. Narrative change needed.QAnon April 19 2019 – Next
Schumann Resonance Today. We will try to keep you updated about
the variations of the Resonance with this page. The great variations
that nobody can explain but that give us a clear sign that the planet is
changing. The Earth is vibration higher and higher, just like us! RS Base Frequency 7.83 Hz.
Schumann Resonance Today Peaks:
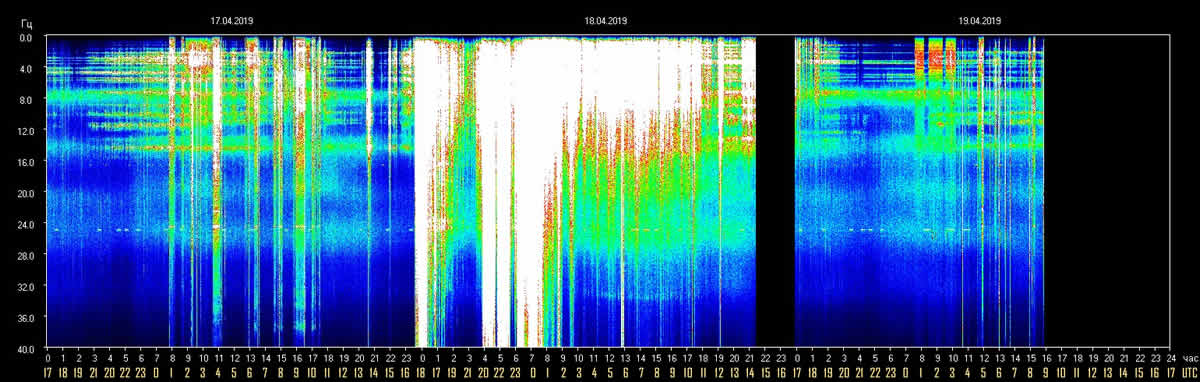
4/19 09:00 UTC – From today’s graph we see that
yesterday from 14 to 17 UTC no data were detected, could there have been
another significant peak? Today the situation has returned almost calm.
4/18 17:00 UTC – The TSU site seems to be frozen 3 hours ago. After
the powerful peaks of this morning the graph shows a decrease in
amplitude even if the activity has been continuous. We will make a new
update when the charts will be available.
4/18 07:30 UTC – After the maximum peak previously reported, others
have continued, it is not “total white” but it is a very strong
activity. The peaks followed one another between 50 and 60 Hz until 2
UTC and then dropped slightly with the minimum at around 20 Hz at 4 UTC,
then returned to the 40 again.
4/17 22:30 UTC – It start looking as another day in the 17 pattern,
after the previous spike at 76 now a even more stronger peak reached 84
Hz. We are probably going to see again some major activity as predicted…
will it be again a full 24 hrs?
4/17 22:00 UTC – A second powerful spike happened at about 22 UTC at
an amplitude just little lower than the previous, probably 76 Hz. We
wait now for the spike at 71 Hz.
4/17 19:00 UTC – A quick update to report the on the 17th of April
at 17:00 UTC the spike reached 78 Hz. Would have been nicer 71 Hz. More
precision needed
4/17 17:00 UTC – We haven’t, for now, had the powerful usual
activity of the 17 but in any case it has not been a calm day, the peaks
have followed one another starting from 1 UTC with amplitude between 20
and 25 Hz. The most significant peaks at 30 and 65 Hz occurred at 13
and just before 17 UTC. Is this the start?
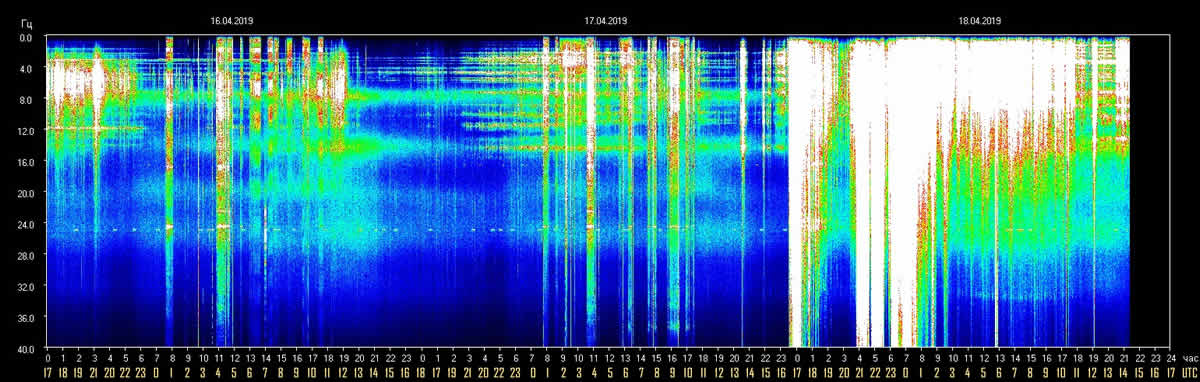
4/16 – The peak of today’s graph has reached around 30 Hz and
occurred at 20 UTC yesterday, the rest of the graph shows continuous
movements at 15-20 Hz. For the previous two months, on each 17th the Q
letter of the alphabet, we had massive activity and led someone saying
that the SR could be influenced in some ways, let see if this pattern
will continue tomorrow.
4/15 – Given the previous days, this can be considered a calm day. Today’s peaks reached 25 Hz and were at 7, 10 and 13 UTC.
4/17 17:00 UTC – Calm.
4/14 12:30 UTC – The movements have now become practically
continuous. The chart shown indicates about 5 hours of “almost calm”
after which the variations started again, at 17 UTC, with a series of
oscillations lasted 4 hours that reached 40 Hz until to 21 UTC. These
were followed by a period of about 4 hours in which the peaks were
slight and then started to widen again until they exceed 40 Hz at 8 UTC.
4/13 17:00 UTC – Calm for now, we shall see the next few hours if there will be another movement.
4/13 13:00 UTC – It seems that today’s movements are coming to an
end. The activity started at 2 UTC to return to almost calm at 12 UTC,
the maximum peak was at 63 Hz at 5 UTC and the second, in order of
magnitude, reached 57 Hz at 9 UTC.
4/13 08:00 UTC – After few hours of calm we are back again into
moderate strong activity with a significant peak at 63 Hz happened just
after 5 am UTC (noon local time in Tomsk). After this the amplitude
remained mostly between 20 and 40 Hz with one more peak at 50 Hz at 7:30
UTC.
4/12 18:00 UTC – It seems that the powerful activity is continuing,
the white continued for the last hour, the amplitude of the Resonance
remained at relevant levels and than it started to fall initially below
50 Hz and lastly below 30 Hz to regain momentum and go back to 50 Hz and
above.
4/12 17:00 UTC – The variation did not end with the previous peak,
after about 2 hours where it has been above 55 Hz, at 15:30 UTC the
amplitude went to 60 Hz to continue for the time until this update into
very high values.
4/12 14:40 UTC – Minor activity started at 2:30 UTC with peak at
10-15 Hz. at 8:00 UTC there have been a slight increase and the average
amplitude remained between 15 and 20 Hz. At 14 UTC we are seeing a
strong increase with a spike that reached 54 Hz.
4/11 17:00 UTC – After four hours from the peak reported previously,
in which the amplitude has continued in the variations, the situation
has returned to complete calm.
4/11 12:30 UTC – After a period of about 10-11 hours of calm, new
mild activity started to emerge with peaks moving towards 10 Hz shortly
after midnight UTC. At 7 UTC amplitude oscillations became slightly more
intense at around 15 Hz to culminate, shortly after 9 UTC in a powerful
spike that reached 62 Hz.
4/10 – Even today no calm, the light activity started just before
midnight UTC with peaks that reached 10 Hz. It continued on this average
amplitude until the publication of this update, at 17 UTC. The only
peak that stood out occurred at 4:30 UTC and reached 22 Hz.
4/9 17:00 UTC – Calm.
4/9 10:00 UTC – The activity of these first hours indicates slight
movements with the amplitude that has reached 11 Hz several times.
Nothing relevant.
4/8 17:00 UTC – Today’s amplitude remained above 15 Hz for about 5
hours, from 5:30 to 10:30 UTC, as previously reported the maximum peaks
were around 25 Hz in the first hours.
4/8 09:00 UTC – Not much calm today, again moderate activity, so far
the amplitude of the frequency, after a few hours without peaks, from 4
am UTC has returned with movements around 25 Hz.
4/7 17:00 UTC – After the two peaks previously reported it would
seem that the Resonance has finally returned to a state of calm.
Difficult, if not impossible, to make predictions but there is a latent
feeling that we will still see strong movements shortly.
4/7 12:30 UTC – The activity is slightly diminished but not
finished. In the last 12 hours two fairly significant peaks stand out,
the first just after yesterday’s 21 UTC that reached almost 40 Hz, the
second at 5:30 UTC today which reached around 47 Hz.
4/6 17:00 UTC – The intense activity continues in this sequence of
days that have seen a constant and gradual increase. In these last hours
there have been 3 strong peaks, 3 white pillars in the chart, which
have all reached the same maximum at around 50 Hz. We will see in the
next hours if the activity will have a break.
4/6 11:30 UTC – We are still above 40 Hz, a spike in today activity
reached 60 Hz at 7:20 UTC. We are seeing medium activity that continued
since yesterday, we had just few hours of calm but mainly the movements
have been continuous.
4/5 17:00 UTC – After the 96 Hz peak the resonance frequency
amplitude slowly started to go down and in about 6 hours it returned to
normal levels.
4/5 11:30 UTC – Increased activity, after the last update in which
there seemed to be a possible drop we are instead back in the “white”
with a powerful spike that reached 96 Hz at about 10:30 UTC.
4/5 09:00 UTC – Even today strong activity, it is not common to see
so many consecutive days of great variations. We’ll see if even in
April, as in March and February we will have a very strong activity on
the 17th (letter Q). Today the activity started with a small
“introductory” peak at 20 Hz around midnight UTC and then suddenly
increased to 30 Hz at 3 UTC and 80 Hz at 5 UTC. After this peak there
was a gradual decrease in the amplitude and, at 9 UTC, it is at 40 HZ.
4/4/ 17:00 UTC – From 11:30 UTC the gradual decrease of the activity began and reached normal values at 12:30 UTC.
4/4 12:00 UTC – The strong activity is continuing, after the peak at
69 Hz at 7:47 UTC the amplitude of the resonance frequency has slightly
decreased but it has practically remained almost always on the 50 Hz
threshold.
4/4 08:00 UTC – New powerful activity now underway, started with a
steady increase at 00 UTC this morning with peaks at 40, 55, 65 to
culminate with a strong peak at 89 Hz just before 8 UTC.
4/3 – Moderate activity today, the copy of yesterday but of shorter
duration. The movements started at 00:30 UTC to finish shortly after
10:00 UTC, within this time frame there were several peaks at 20 Hz
while the two highest peaks reached 25 Hz at 5:30 and at 10:00 UTC.
4/2 17:00 – After the peak reported previously, the activity
continued but has been waning with an amplitude of around 15 Hz down to
the current calm.
4/2 12:30 UTC – Even today there is a fair amount of activity going
on, event though the peak above 40 Hz is still missing, there have been
various movements started at 4 UTC with a maximum peak so far that has
reached 28 Hz at 11 UTC.
4/1 – After the strong peak at the beginning of the last 24 hours
the activity continued but in a moderate way, there were various peaks
from 5 to 11 UTC, the highest of which reached 26 Hz at 8:50 UTC.
We added a new chart below, we’ll try to post it daily to show the actual peaks above 40 Hz.
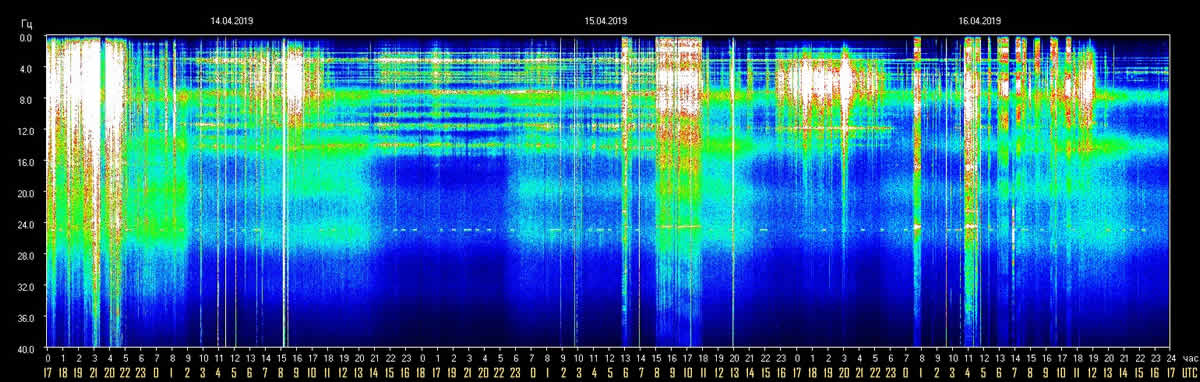
Frequency means how many wave cycle happen in a second, 1 Hz. means 1
cycle per second, 40 Hz. means 40 cycles per second, Amplitude is the
size of the vibration, how big is the wave, the chart shows the
frequency variation in Hz and the amplitude using the white color.
The Chart time is based on Tomsk – Russia – UTC +7Source
Note
The Ancient Indian Rishis called 7.83 Hz the frequency of OM. It also happens to be Mother Earth’s natural heartbeat rhythm
Schumann resonances are named after professor
Schumann who was involved in early German secret space program and was
later paper-clipped into the United States. The frequencies of Schumann resonances are fairly stable and are mainly defined by the physical size of the ionospheric cavity.
The amplitude of Schumann resonances does
change and is bigger when ionospheric plasma gets excited. Ionospheric
plasma excitation happens because of solar activity, thunderstorms, use
of scalar plasma weapons and HAARP and lately also when the Light forces
are clearing the plasma anomaly.
MARCH 2019
Dependencies Amplitudes Schumann Resonance April 19 2019
Editor’s Note: Felling those energies? Please take a look at the graph above and learn one reason why the vibrational energy of the collective consciousness is indeed on the move…up!
Please read the latest on the vibrations that we encounter on a more and more frequent basis, feel the love, and be…
Schumann Resonance Today. We will try to keep you updated about
the variations of the Resonance with this page. The great variations
that nobody can explain but that give us a clear sign that the planet is
changing. The Earth is vibration higher and higher, just like us! RS Base Frequency 7.83 Hz.
Schumann Resonance Today Peaks:
4/18 17:00 UTC – The TSU site seems to be frozen 3 hours
ago. After the powerful peaks of this morning the graph shows a
decrease in amplitude even if the activity has been continuous. We will
make a new update when the charts will be available.
4/18 07:30 UTC – After the maximum peak previously reported,
others have continued, it is not “total white” but it is a very strong
activity. The peaks followed one another between 50 and 60 Hz until 2
UTC and then dropped slightly with the minimum at around 20 Hz at 4 UTC,
then returned to the 40 again.
4/17 22:30 UTC – It start looking as another day in the 17 pattern,
after the previous spike at 76 now a even more stronger peak reached 84
Hz. We are probably going to see again some major activity as predicted…
will it be again a full 24 hrs?
4/17 22:00 UTC – A second powerful spike happened at about 22 UTC at
an amplitude just little lower than the previous, probably 76 Hz. We
wait now for the spike at 71 Hz.
4/17 19:00 UTC – A quick update to report the on the 17th of April
at 17:00 UTC the spike reached 78 Hz. Would have been nicer 71 Hz. More
precision needed
4/17 17:00 UTC – We haven’t, for now, had the powerful usual
activity of the 17 but in any case it has not been a calm day, the peaks
have followed one another starting from 1 UTC with amplitude between 20
and 25 Hz. The most significant peaks at 30 and 65 Hz occurred at 13
and just before 17 UTC. Is this the start?
4/16 – The peak of today’s graph has reached around 30 Hz and
occurred at 20 UTC yesterday, the rest of the graph shows continuous
movements at 15-20 Hz. For the previous two months, on each 17th the Q
letter of the alphabet, we had massive activity and led someone saying
that the SR could be influenced in some ways, let see if this pattern
will continue tomorrow.
4/15 – Given the previous days, this can be considered a calm day. Today’s peaks reached 25 Hz and were at 7, 10 and 13 UTC.
4/17 17:00 UTC – Calm.
4/14 12:30 UTC – The movements have now become practically
continuous. The chart shown indicates about 5 hours of “almost calm”
after which the variations started again, at 17 UTC, with a series of
oscillations lasted 4 hours that reached 40 Hz until to 21 UTC. These
were followed by a period of about 4 hours in which the peaks were
slight and then started to widen again until they exceed 40 Hz at 8 UTC.
4/13 17:00 UTC – Calm for now, we shall see the next few hours if there will be another movement.
4/13 13:00 UTC – It seems that today’s movements are coming to an
end. The activity started at 2 UTC to return to almost calm at 12 UTC,
the maximum peak was at 63 Hz at 5 UTC and the second, in order of
magnitude, reached 57 Hz at 9 UTC.
4/13 08:00 UTC – After few hours of calm we are back again into
moderate strong activity with a significant peak at 63 Hz happened just
after 5 am UTC (noon local time in Tomsk). After this the amplitude
remained mostly between 20 and 40 Hz with one more peak at 50 Hz at 7:30
UTC.
4/12 18:00 UTC – It seems that the powerful activity is continuing,
the white continued for the last hour, the amplitude of the Resonance
remained at relevant levels and than it started to fall initially below
50 Hz and lastly below 30 Hz to regain momentum and go back to 50 Hz and
above.
4/12 17:00 UTC – The variation did not end with the previous peak,
after about 2 hours where it has been above 55 Hz, at 15:30 UTC the
amplitude went to 60 Hz to continue for the time until this update into
very high values.
4/12 14:40 UTC – Minor activity started at 2:30 UTC with peak at
10-15 Hz. at 8:00 UTC there have been a slight increase and the average
amplitude remained between 15 and 20 Hz. At 14 UTC we are seeing a
strong increase with a spike that reached 54 Hz.
4/11 17:00 UTC – After four hours from the peak reported previously,
in which the amplitude has continued in the variations, the situation
has returned to complete calm.
4/11 12:30 UTC – After a period of about 10-11 hours of calm, new
mild activity started to emerge with peaks moving towards 10 Hz shortly
after midnight UTC. At 7 UTC amplitude oscillations became slightly more
intense at around 15 Hz to culminate, shortly after 9 UTC in a powerful
spike that reached 62 Hz.
4/10 – Even today no calm, the light activity started just before
midnight UTC with peaks that reached 10 Hz. It continued on this average
amplitude until the publication of this update, at 17 UTC. The only
peak that stood out occurred at 4:30 UTC and reached 22 Hz.
4/9 17:00 UTC – Calm.
4/9 10:00 UTC – The activity of these first hours indicates slight
movements with the amplitude that has reached 11 Hz several times.
Nothing relevant.
4/8 17:00 UTC – Today’s amplitude remained above 15 Hz for about 5
hours, from 5:30 to 10:30 UTC, as previously reported the maximum peaks
were around 25 Hz in the first hours.
4/8 09:00 UTC – Not much calm today, again moderate activity, so far
the amplitude of the frequency, after a few hours without peaks, from 4
am UTC has returned with movements around 25 Hz.
4/7 17:00 UTC – After the two peaks previously reported it would
seem that the Resonance has finally returned to a state of calm.
Difficult, if not impossible, to make predictions but there is a latent
feeling that we will still see strong movements shortly.
4/7 12:30 UTC – The activity is slightly diminished but not
finished. In the last 12 hours two fairly significant peaks stand out,
the first just after yesterday’s 21 UTC that reached almost 40 Hz, the
second at 5:30 UTC today which reached around 47 Hz.
4/6 17:00 UTC – The intense activity continues in this sequence of
days that have seen a constant and gradual increase. In these last hours
there have been 3 strong peaks, 3 white pillars in the chart, which
have all reached the same maximum at around 50 Hz. We will see in the
next hours if the activity will have a break.
4/6 11:30 UTC – We are still above 40 Hz, a spike in today activity
reached 60 Hz at 7:20 UTC. We are seeing medium activity that continued
since yesterday, we had just few hours of calm but mainly the movements
have been continuous.
4/5 17:00 UTC – After the 96 Hz peak the resonance frequency
amplitude slowly started to go down and in about 6 hours it returned to
normal levels.
4/5 11:30 UTC – Increased activity, after the last update in which
there seemed to be a possible drop we are instead back in the “white”
with a powerful spike that reached 96 Hz at about 10:30 UTC.
4/5 09:00 UTC – Even today strong activity, it is not common to see
so many consecutive days of great variations. We’ll see if even in
April, as in March and February we will have a very strong activity on
the 17th (letter Q). Today the activity started with a small
“introductory” peak at 20 Hz around midnight UTC and then suddenly
increased to 30 Hz at 3 UTC and 80 Hz at 5 UTC. After this peak there
was a gradual decrease in the amplitude and, at 9 UTC, it is at 40 HZ.
4/4/ 17:00 UTC – From 11:30 UTC the gradual decrease of the activity began and reached normal values at 12:30 UTC.
4/4 12:00 UTC – The strong activity is continuing, after the peak at
69 Hz at 7:47 UTC the amplitude of the resonance frequency has slightly
decreased but it has practically remained almost always on the 50 Hz
threshold.
4/4 08:00 UTC – New powerful activity now underway, started with a
steady increase at 00 UTC this morning with peaks at 40, 55, 65 to
culminate with a strong peak at 89 Hz just before 8 UTC.
4/3 – Moderate activity today, the copy of yesterday but of shorter
duration. The movements started at 00:30 UTC to finish shortly after
10:00 UTC, within this time frame there were several peaks at 20 Hz
while the two highest peaks reached 25 Hz at 5:30 and at 10:00 UTC.
4/2 17:00 – After the peak reported previously, the activity
continued but has been waning with an amplitude of around 15 Hz down to
the current calm.
4/2 12:30 UTC – Even today there is a fair amount of activity going
on, event though the peak above 40 Hz is still missing, there have been
various movements started at 4 UTC with a maximum peak so far that has
reached 28 Hz at 11 UTC.
4/1 – After the strong peak at the beginning of the last 24 hours
the activity continued but in a moderate way, there were various peaks
from 5 to 11 UTC, the highest of which reached 26 Hz at 8:50 UTC.
We added a new chart below, we’ll try to post it daily to show the actual peaks above 40 Hz.
Frequency means how many wave cycle happen in a second, 1 Hz. means 1
cycle per second, 40 Hz. means 40 cycles per second, Amplitude is the
size of the vibration, how big is the wave, the chart shows the
frequency variation in Hz and the amplitude using the white color.
The Chart time is based on Tomsk – Russia – UTC +7Source
Note
The Ancient Indian Rishis called 7.83 Hz the frequency of OM. It also happens to be Mother Earth’s natural heartbeat rhythm
Schumann resonances are named after professor
Schumann who was involved in early German secret space program and was
later paper-clipped into the United States. The frequencies of Schumann resonances are fairly stable and are mainly defined by the physical size of the ionospheric cavity.
The amplitude of Schumann resonances does
change and is bigger when ionospheric plasma gets excited. Ionospheric
plasma excitation happens because of solar activity, thunderstorms, use
of scalar plasma weapons and HAARP and lately also when the Light forces
are clearing the plasma anomaly.
MARCH 2019
Dependencies Amplitudes Schumann Resonance April 18 2019
QAnon has taught us there exists an alternative history to many
of the narratives promoted in our textbooks: the true reason the Titanic
sunk, the truth behind 9/11, the rise of ISIS, who was funding WW2…
think about how many other stories there are we have not yet been told.
Many asking about the Titanic. Here’s the run down. Q post 142.
This is analysis from Qanon post 142 pertaining to the Titanic and
the history behind it and why the banking cabal wanted to sink it.QAnon Titanic – Why Is This Relevant?
Q !ITPb.qbhqo ID: 99LpGawB No.149122955 Nov 12 2017 17:16:24 (UTC)
How did Soros replace family ‘y’? Who is family ‘y’? Trace the bloodlines of these (3) families. What happened during WWII? Was Hitler a puppet? Who was his handler? What was the purpose? What was the real purpose of the war? What age was GS? What is the Soros family history? What has occurred since the fall of N Germany? Who is A. Merkel? What is A. Merkel’s family history? Follow the bloodline. Who died on the Titanic? What year did the Titanic sink?
Why is this relevant?
What ‘exactly’ happened to the Titanic?
What ‘class of people’ were guaranteed a lifeboat?
Why did select ‘individuals’ not make it into the lifeboats?
Why is this relevant?
How do we know who was on the lifeboats (D or A)?
How were names and bodies recorded back then?
When were tickets purchased for her maiden voyage?
Who was ‘specifically’ invited?
Less than 10.
What is the FED? What does the FED control? Who controls the FED? Who approved the formation of the FED? Why did H-wood glorify Titanic as a tragic love story?
Who lived in the movie (what man)?
Why is this relevant?
Opposite is true. What is brainwashing? What is a PSYOP? What happened to the Hindenburg? What really happened to the Hindenburg? Who died during the ‘accident’? Why is this relevant? What are sheep? Who controls the narrative? The truth would put 99% of people in the hospital. It must be controlled. Snow White. Iron Eagle. Jason Bourne (CIA/Dream). Q
What year did the Titanic sink?
1912
Why is this relevant?
It occurred before the creation of the FED
Who died on the Titanic?
John Jacob Astor IV (richest man on the ship) Benjamin Guggenheim
Captain Edward John Smith Isidor and Ida Straus (co-owner of Macy’s)
Thomas Andrews Lady Duff Gordon Lady Countess Rothes (Lucy Noël Martha
Dyer-Edwards) Millvina Dean.
What ‘exactly’ happened to the Titanic?
What ‘class of people’ were guaranteed a lifeboat?
Women and children, first class.
Why did select ‘individuals’ not make it into the lifeboats?
John Jacob Astor IV, Benjamin Guggenheim, Isidor and Ida Straus were all opposed to the creation of a central bank.
Boat A was allowed to drift off after it was partially Submerged; It
was recovered a month later, by RMS Oceanic, another White Star Line
ship. 3 bodies where left in the boat and 12-13 survivors made it to
Boat D. 25 people were on board boat D excluding boat A’s survivors.
Known People to survive of Boat A and D are Michel Marcel Navratil,
Edmond Marcel Navratil, Caroline Brown,Hugh Woolner, Mauritz Håkan
Björnström-Steffansson, Frederick Maxfield Hoyt and Rhoda Abbott.
How were names and bodies recorded back then?
According to Wikipedia: Upon recovery, each body retrieved by the
Mackay-Bennett was numbered and given as detailed a description as
possible to help aid in identification. The physical appearance of each
body—height, weight, age, hair and eye colour, visible birthmarks, scars
or tattoos, was catalogued and any personal effects on the bodies were
gathered and placed in small canvas bags corresponding to their number.
(It was decided to preserve all bodies of First Class passengers because
of the need to visually identify wealthy men to resolve any disputes
over large estates).
When were tickets purchased for her maiden voyage?
In July of 1911, White Star and Harland & Wolff announced a date for Titanic’s maiden voyage – March 20, 1912.
September 20, 1911: Titanic’s maiden voyage delayed due to necessary diversion of workers and materials to repair Olympic.
October 11, 1911: White Star officially announces new date for Titanic’s maiden voyage in the London Times – April 10, 1912.
This information leads me to believe that tickets would not have
been sold before July, 1911 (when the first date was announced). It
seems to make sense, also, that ticket sales would slow or stop when
construction was interrupted; then ticket sales might pick up again
after the Oct. 11, 1911, announcement of the new launch date.
According to the second link I have given below, Joseph Laroche purchased tickets for his family in March, 1912.
According to the third link below, one family was transferred to the
Titanic when the ship they were ticketed for was cancelled. This
transfer happened “in the spring of 1912,” which at least tells us that
the Titanic was not sold out by spring.
The 4th link shows what a first class ticket looked like.
Emilio Portaluppi well-respected stonemason received a telegram from
the Astors inviting him to join them on Titanic as they returned from a
holiday in Egypt. He was given first class travel and it appears, wanted
him to use his skills on statues outside their Newport villa.
Bill Müller served as secretary to a Dutch traffic inspector whose
job was to inspect ships for insurance and investment firms and was an
invited guest aboard the Titanic from the ship’s owners.
Mott was an influential evangelist and longtime YMCA official, who
shared the Nobel Peace Prize in 1946. He and a colleague were supposedly
offered free passage on the Titanic by a White Star Line official
interested in their work but declined and instead took the more humble
liner Lapland.
The Italian inventor, wireless telegraphy pioneer and winner of the
1909 Nobel Prize in Physics was offered free passage on Titanic but had
taken the Lusitania three days earlier.
Less than 10.
Alfred Gwynne Vanderbilt I also, Someone in their family objected to
their sailing aboard the new ship, “because so many things can go wrong
on a maiden voyage.”
Why did H-wood glorify Titanic as a tragic love story?
To hide history / distract from the fact the last 3 major opponents of the FED died that night.
Who lived in the movie (what man)?
This line of questions suggest someone famous was shown to have
survived in the movie but in reality died that night and his identity
was stolen. Possible list Jack Thayer William Ernest Carter George
Dunton Widener Harry Elkins Widener J. Bruce Ismay
Why is this relevant?
He’s a rich guy that kills himself after losing all his money in the crash
Their Narrative changes the history, or so they’d like it to.
Schumann Resonance Today. We will try to keep you updated about
the variations of the Resonance with this page. The great variations
that nobody can explain but that give us a clear sign that the planet is
changing. The Earth is vibration higher and higher, just like us! RS Base Frequency 7.83 Hz.
Schumann Resonance Today Peaks:
4/16 – The peak of today’s graph has reached around 30
Hz and occurred at 20 UTC yesterday, the rest of the graph shows
continuous movements at 15-20 Hz. For the previous two months, on each
17th the Q letter of the alphabet, we had massive activity and led
someone saying that the SR could be influenced in some ways, let see if
this pattern will continue tomorrow.
4/15 – Given the previous days, this can be considered a calm day. Today’s peaks reached 25 Hz and were at 7, 10 and 13 UTC.
4/17 17:00 UTC – Calm.
4/14 12:30 UTC – The movements have now become practically
continuous. The chart shown indicates about 5 hours of “almost calm”
after which the variations started again, at 17 UTC, with a series of
oscillations lasted 4 hours that reached 40 Hz until to 21 UTC. These
were followed by a period of about 4 hours in which the peaks were
slight and then started to widen again until they exceed 40 Hz at 8 UTC.
4/13 17:00 UTC – Calm for now, we shall see the next few hours if there will be another movement.
4/13 13:00 UTC – It seems that today’s movements are coming to an
end. The activity started at 2 UTC to return to almost calm at 12 UTC,
the maximum peak was at 63 Hz at 5 UTC and the second, in order of
magnitude, reached 57 Hz at 9 UTC.
4/13 08:00 UTC – After few hours of calm we are back again into
moderate strong activity with a significant peak at 63 Hz happened just
after 5 am UTC (noon local time in Tomsk). After this the amplitude
remained mostly between 20 and 40 Hz with one more peak at 50 Hz at 7:30
UTC.
4/12 18:00 UTC – It seems that the powerful activity is continuing,
the white continued for the last hour, the amplitude of the Resonance
remained at relevant levels and than it started to fall initially below
50 Hz and lastly below 30 Hz to regain momentum and go back to 50 Hz and
above.
4/12 17:00 UTC – The variation did not end with the previous peak,
after about 2 hours where it has been above 55 Hz, at 15:30 UTC the
amplitude went to 60 Hz to continue for the time until this update into
very high values.
4/12 14:40 UTC – Minor activity started at 2:30 UTC with peak at
10-15 Hz. at 8:00 UTC there have been a slight increase and the average
amplitude remained between 15 and 20 Hz. At 14 UTC we are seeing a
strong increase with a spike that reached 54 Hz.
4/11 17:00 UTC – After four hours from the peak reported previously,
in which the amplitude has continued in the variations, the situation
has returned to complete calm.
4/11 12:30 UTC – After a period of about 10-11 hours of calm, new
mild activity started to emerge with peaks moving towards 10 Hz shortly
after midnight UTC. At 7 UTC amplitude oscillations became slightly more
intense at around 15 Hz to culminate, shortly after 9 UTC in a powerful
spike that reached 62 Hz.
4/10 – Even today no calm, the light activity started just before
midnight UTC with peaks that reached 10 Hz. It continued on this average
amplitude until the publication of this update, at 17 UTC. The only
peak that stood out occurred at 4:30 UTC and reached 22 Hz.
4/9 17:00 UTC – Calm.
4/9 10:00 UTC – The activity of these first hours indicates slight
movements with the amplitude that has reached 11 Hz several times.
Nothing relevant.
4/8 17:00 UTC – Today’s amplitude remained above 15 Hz for about 5
hours, from 5:30 to 10:30 UTC, as previously reported the maximum peaks
were around 25 Hz in the first hours.
4/8 09:00 UTC – Not much calm today, again moderate activity, so far
the amplitude of the frequency, after a few hours without peaks, from 4
am UTC has returned with movements around 25 Hz.
4/7 17:00 UTC – After the two peaks previously reported it would
seem that the Resonance has finally returned to a state of calm.
Difficult, if not impossible, to make predictions but there is a latent
feeling that we will still see strong movements shortly.
4/7 12:30 UTC – The activity is slightly diminished but not
finished. In the last 12 hours two fairly significant peaks stand out,
the first just after yesterday’s 21 UTC that reached almost 40 Hz, the
second at 5:30 UTC today which reached around 47 Hz.
4/6 17:00 UTC – The intense activity continues in this sequence of
days that have seen a constant and gradual increase. In these last hours
there have been 3 strong peaks, 3 white pillars in the chart, which
have all reached the same maximum at around 50 Hz. We will see in the
next hours if the activity will have a break.
4/6 11:30 UTC – We are still above 40 Hz, a spike in today activity
reached 60 Hz at 7:20 UTC. We are seeing medium activity that continued
since yesterday, we had just few hours of calm but mainly the movements
have been continuous.
4/5 17:00 UTC – After the 96 Hz peak the resonance frequency
amplitude slowly started to go down and in about 6 hours it returned to
normal levels.
4/5 11:30 UTC – Increased activity, after the last update in which
there seemed to be a possible drop we are instead back in the “white”
with a powerful spike that reached 96 Hz at about 10:30 UTC.
4/5 09:00 UTC – Even today strong activity, it is not common to see
so many consecutive days of great variations. We’ll see if even in
April, as in March and February we will have a very strong activity on
the 17th (letter Q). Today the activity started with a small
“introductory” peak at 20 Hz around midnight UTC and then suddenly
increased to 30 Hz at 3 UTC and 80 Hz at 5 UTC. After this peak there
was a gradual decrease in the amplitude and, at 9 UTC, it is at 40 HZ.
4/4/ 17:00 UTC – From 11:30 UTC the gradual decrease of the activity began and reached normal values at 12:30 UTC.
4/4 12:00 UTC – The strong activity is continuing, after the peak at
69 Hz at 7:47 UTC the amplitude of the resonance frequency has slightly
decreased but it has practically remained almost always on the 50 Hz
threshold.
4/4 08:00 UTC – New powerful activity now underway, started with a
steady increase at 00 UTC this morning with peaks at 40, 55, 65 to
culminate with a strong peak at 89 Hz just before 8 UTC.
4/3 – Moderate activity today, the copy of yesterday but of shorter
duration. The movements started at 00:30 UTC to finish shortly after
10:00 UTC, within this time frame there were several peaks at 20 Hz
while the two highest peaks reached 25 Hz at 5:30 and at 10:00 UTC.
4/2 17:00 – After the peak reported previously, the activity
continued but has been waning with an amplitude of around 15 Hz down to
the current calm.
4/2 12:30 UTC – Even today there is a fair amount of activity going
on, event though the peak above 40 Hz is still missing, there have been
various movements started at 4 UTC with a maximum peak so far that has
reached 28 Hz at 11 UTC.
4/1 – After the strong peak at the beginning of the last 24 hours
the activity continued but in a moderate way, there were various peaks
from 5 to 11 UTC, the highest of which reached 26 Hz at 8:50 UTC.
We added a new chart below, we’ll try to post it daily to show the actual peaks above 40 Hz.
Frequency means how many wave cycle happen in a second, 1 Hz. means 1
cycle per second, 40 Hz. means 40 cycles per second, Amplitude is the
size of the vibration, how big is the wave, the chart shows the
frequency variation in Hz and the amplitude using the white color.
The Chart time is based on Tomsk – Russia – UTC +7Source
Note
The Ancient Indian Rishis called 7.83 Hz the frequency of OM. It also happens to be Mother Earth’s natural heartbeat rhythm
Schumann resonances are named after professor
Schumann who was involved in early German secret space program and was
later paper-clipped into the United States. The frequencies of Schumann resonances are fairly stable and are mainly defined by the physical size of the ionospheric cavity.
The amplitude of Schumann resonances does
change and is bigger when ionospheric plasma gets excited. Ionospheric
plasma excitation happens because of solar activity, thunderstorms, use
of scalar plasma weapons and HAARP and lately also when the Light forces
are clearing the plasma anomaly.
MARCH 2019
Dependencies Amplitudes Schumann Resonance April 16 2019