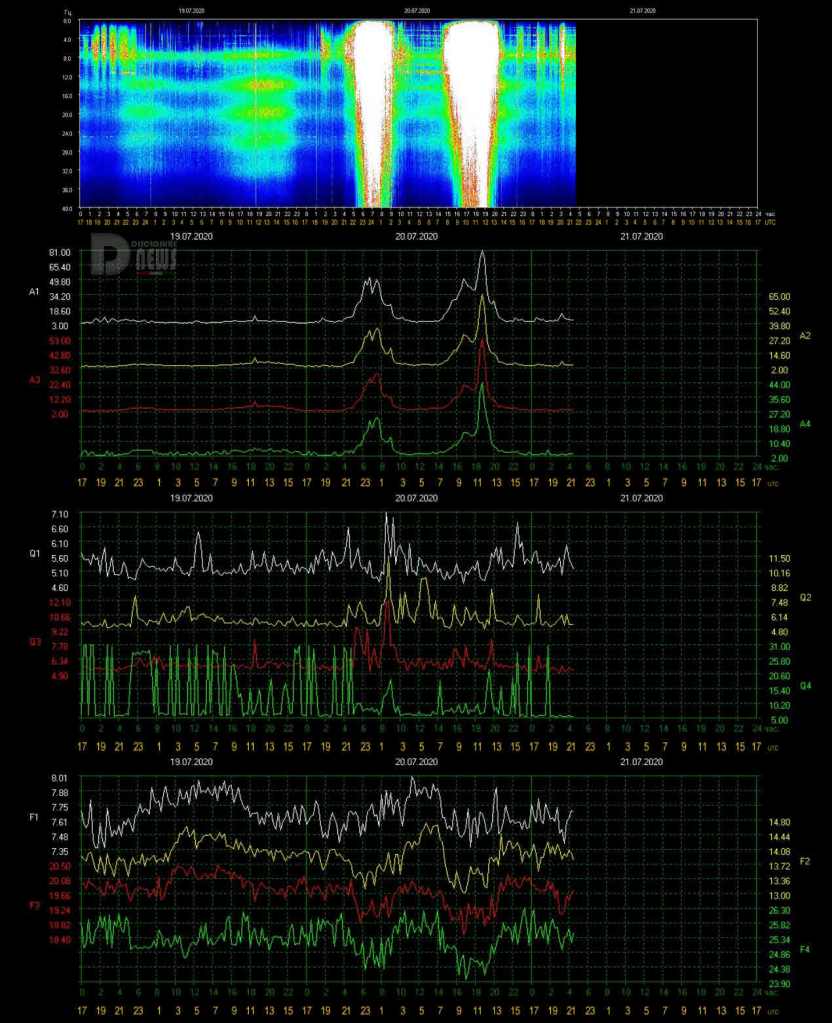
Editor’s Note: Well, well, well…the dry spell for the Schumann Resonance energy has ended with two strong blasts of energy released by the Earth in the past 24 hours. The first barrage of high density/high amplitude energies occurred from 4pm through 9pm on 7/19 .
This was followed a mere 6 hours later by a slightly longer high density/high amplitude energy event happening from 3am through 9am on 7/20. Gee… this is two significant energy events happening worldwide on 7/20 regardless of time zone…makes you wonder!
Remember, the Schumann Resonance are released from Mother Earth as a response as she receives defined (and undefined) comic energies. So…thanks for keeping watch on why you may be feeling the way you feel, understand your bodies positive response to energies is based on pure water and adequate rest, preparing you to BE in…
Quantum Joy!
___________________________________________________________________________________________
Schumann Resonance Today. We will try to keep you updated about the variations of the Resonance with this page. The great variations that nobody can explain but that give us a clear sign that the planet is changing. The Earth is vibration higher and higher, just like us!
The Chart time is based on Tomsk – Russia – UTC (Universal Time Coordinated) +7 – Source
SR Base Frequency 7.83 Hz. – Schumann Resonance Today’s Peaks
81
Amplitude
6.60
Quality
7.78
Frequency Max
7.35
Frequency Min
65
Ampltude A2
53
Ampltude A3
44
Ampltude A4
“Every second, a multitude of pulses travel around the world in this unique, resonant chamber between Earth and the ionosphere, sending colluding signals to all microorganisms. These signals couple us to the Earth’s magnetic field. Named after their discoverer, these Schumann Resonances (SR) drive the harmonizing pulse for life in our world.” Eric Thompson


1/72/73/74/75/76/77/78/79/710/711/712/713/714/715/716/717/718/719/720/7020406080100
| x | Amplitude | Average |
|---|---|---|
| 1/7 | 85 | 85 |
| 2/7 | 75 | 80 |
| 3/7 | 18 | 59 |
| 4/7 | 68 | 62 |
| 5/7 | 41 | 57 |
| 6/7 | 99 | 64 |
| 7/7 | 35 | 60 |
| 8/7 | 23 | 56 |
| 9/7 | 69 | 57 |
| 10/7 | 82 | 58 |
| 11/7 | 12 | 55 |
| 12/7 | 58 | 55 |
| 13/7 | 10 | 52 |
| 14/7 | 44 | 51 |
| 15/7 | 21 | 49 |
| 16/7 | 70 | 51 |
| 17/7 | 23 | 49 |
| 18/7 | 8 | 47 |
| 19/7 | 52 | 47 |
| 20/7 | 81 | 49 |
Amplitude Max Values and Average – Schumann Resonance Today
More ChartsTell Us What You Feel! How to Read the Graphs


| 7/20 17:00 | The frequency continues to remain around 7.60 Hz so it is not a completely calm situation with amplitude and quality have small oscillations. |
| 7/20 15:30 | After several days of calm, today the activity has returned in a powerful way, the first period lasted about 6 hours, from 21 to 3 am UTC, touching Power 50 three times; the second period started after 4 hours of calm, at 7 UTC, and lasted just over 6 hours, after a steep initial climb to Power 52 and an hour of strong intensity at 50, the amplitude started to increase again until topping to Power 81. The drop after the peak was sudden and at 14 UTC the amplitude was back to normal values. In all this, the frequency, excluded the calm part from 3 to 7, has had wide variations around 7.60 Hz. |
| 7/20 12:30 | From 11 UTC there was a further rapid increase that brought the Amplitude to Power 81 shortly before 12 UTC. The frequency remains oscillating around 7.60 Hz. |
| 7/20 11:45 | The Freuency remains very low and more Amplitude movements reached again Power 52 at 11:20 UTC. |
| 7/20 11:30 | Another powerful period of activity started at 7 UTC, just under four hours after the previous one and, like that one, reached Power 51 quite quickly just before 10 UTC. During this second movement there was a further drop in frequency which reached 7.35 Hz as a minimum value around 10 UTC. |
| 7/20 8:30 | Today’s first movement lasted about 6 hours straddling midnight UTC, from 21 to 2 am. From 23 to 2 it was a succession of very strong peaks, Power 48, Power 52 and Power 50. One last move at Power 23 occurred at 2 UTC during the rapid drop in Amplitude towards normal values. The frequency during this phase remained at 7.50 Hz and then returned to the base value from 4 UTC. From 7 the frequency started again a rapid drop towards 7.50 Hz, once again setting the Amplitude in motion that at the time of this update is passing Power 20. |
| 7/20 00:00 | The strong movement started at 21 UTC was not anticipated by any particular signal, the Frequency was in a cycle of wide oscillations from 17 UTC. The amplitude started to increase suddenly at 22 UTC and reached the maximum value of Power 52 at 23:40. |
| 7/19 17:00 | Not much to report if not the cyclical ripple of the frequency values which did not produced any significant movement. |
| 7/19 15:00 | From 9 UTC the Frequency started the cycle down again, reaching 7.50 Hz at 2 pm UTC. Previously, during this descent, at 11:30 a peak was recorded at Power 11. |
| 7/19 09:00 | Calm is continuing, the Frequency has started to rise towards the base value at 21 UTC yesterday where it stabilized from 3 UTC today, currently the Amplitude is around Power 5. |
| 7/18 20:30 | A downward fluctuation in Frequency that between 18 and 20 UTC reached 7.35 Hz, slightly moved the amplitude that reached Power 10 at 19:30 UTC. |
| 7/18 17:00 | Total calm throughout the day, in the last few hours the frequency gradually began to decrease to reach 7.60 Hz at the time of this update. Power 8 is the minum value registered during July 2020 until now. |
| 7/18 14:00 | Total calm, maximum value reached was Power 8 at 11 UTC. |
| 7/17 17:00 | Today’s activity, which reached its maximum at Power 23 at 10:30 UTC, lasted about 10 hours, from the first movements at 4 UTC to the calm which returned at 14. The most intense period was from 9 am at 12 UTC when also also Frequency had a sharp drop to 7.30 Hz. |
| 7/17 10:00 | Slight movements started around 4 UTC, with a gradual increase the Amplitude reached and exceeded Power 17 at 9 UTC when the Frequency had a sudden drop towards 7.43 Hz. The Amplitude max value so far is Power 19 at 9:30. Quality also peaked during these more intense variations. |
| 7/16 17:00 | Today’s activity lasted only 4 hours, from 5 to 9 UTC and during this period the highest peak was recorded at Power 70 at 7:30 UTC. |
| 7/16 08:30 | Today’s movements began shortly after 5 UTC when the Frequency, Quality and Amplitude moved from the basic values. The Quality peaked first at 6 UTC, at 7 the Frequency started to decrease and at 7:30 UTC there was the maximum Amplitude value reached, Power 70. |
| 7/15 17:00 | The frequency oscillates around 7.60 Hz, the amplitude has returned to normal values, only the quality fluctuations remain. |
| 7/15 13:30 | The frequency continued to decrease oscillating around 7.60 Hz from 11 UTC, shortly after there has been the movement of the amplitude that reached Power 21. |
| 7/15 11:00 | A gradual decrease in frequency towards 7.60 Hz led to slight movements at Power 16 at 10 UTC. |
| 7/15 09:00 | Since midnight UTC the frequency has stabilized on the base value of 7.83 Hz and all the other parameters have values reduced to a minimum. The calm began at 15 UTC yesterday, 12 hours ago. |
Frequency means how many wave cycle happen in a second, 1 Hz. means 1 cycle per second, 40 Hz. means 40 cycles per second, Amplitude is the size of the vibration, how big is the wave, the chart shows the frequency variation in Hz and the amplitude using the white color.
Note
The Ancient Indian Rishis called 7.83 Hz the frequency of OM. It also happens to be Mother Earth’s natural heartbeat rhythm. Schumann resonances are named after professor Schumann who was involved in early German secret space program and was later paper-clipped into the United States. The frequencies of Schumann resonances are fairly stable and are mainly defined by the physical size of the ionospheric cavity. The amplitude of Schumann resonances does change and is bigger when ionospheric plasma gets excited. Ionospheric plasma excitation happens because of solar activity, thunderstorms, use of scalar plasma weapons and HAARP and lately also when the Light forces are clearing the plasma anomaly.
Schumann Resonance Today – Energy of Consciousness Currents
Show entriesSearch:
| Time UTC +7 | Amplitude | Quality | A+Q | Freq. | Base Freq. | Delta | ECC Increase | TOTAL ECC |
|---|---|---|---|---|---|---|---|---|
| 04/05/2020 18.00.00 | 91 | 5 | 96 | 7,91 | 7,83 | 0,08 | 8 | 104 |
| 03/05/2020 07:00:00 | 81 | 7 | 88 | 7,28 | 7,83 | 0,55 | 48 | 136 |
| 01/05/2020 07:00:00 | 58 | 8,08 | 66,08 | 7,53 | 7,83 | 0,3 | 20 | 86 |
| 30/04/2020 21:15:00 | 90 | 7,46 | 97,46 | 7,36 | 7,83 | 0,47 | 46 | 143 |
| 29/04/2020 17:00:00 | 76 | 6,91 | 82,91 | 7,31 | 7,83 | 0,52 | 43 | 126 |
| 23/04/2020 10:00:00 | 138 | 4,74 | 142,74 | 7,42 | 7,83 | 0,41 | 59 | 201 |
| 19/04/2020 14:45:00 | 88 | 6,49 | 94,49 | 7,25 | 7,83 | 0,58 | 55 | 149 |
| 18/04/2020 16:15:00 | 110 | 7,21 | 117,21 | 7,26 | 7,83 | 0,57 | 67 | 184 |
| 18/04/2020 14:00:00 | 90 | 7,22 | 97,22 | 7,34 | 7,83 | 0,49 | 48 | 145 |
| 18/04/2020 12:00:00 | 81 | 10,9 | 91,9 | 7,24 | 7,83 | 0,59 | 54 | 146 |
Showing 1 to 10 of 67 entriesPreviousNext
Schumann Resonance Today – Energy of Consciousness Currents Posts

The Super-Charged Lion’s Gate Of 2020

Neowise Streaking Thru The Sacred Skies

Galactic Activation Portal Opens
Schumann Resonance PDF Archives
Images Archive
All the SR daily images in one single page See the Images

Explanation of The Chart
The Schumann Resonance Spectrogram Chart
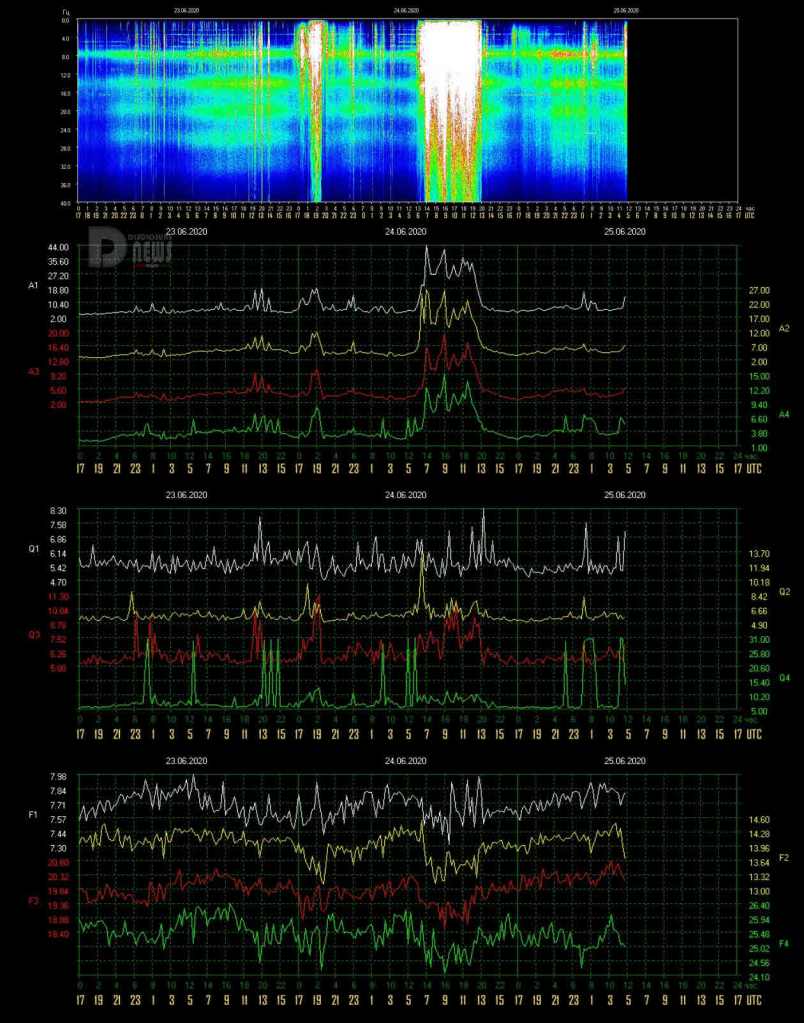
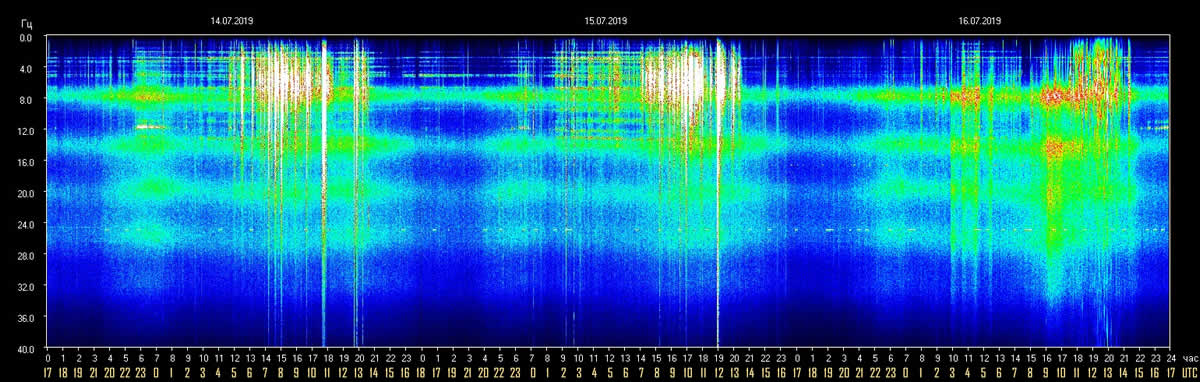
The Schumann Resonance Chart displays data from the magnetic field detector to monitor the resonances occurring in the plasma waves constantly circling the earth in the ionosphere. These three days spectrograms show the activity occurring at the various resonant frequencies from 1 to 40 Hz. Within the spectrogram, the power, or intensity level of each frequency is displayed as a color, with white being the most intense. The Schumann Resonances appear as the horizontal lines at 0.0, 4.0, 8.0, 12.0, 16.0, 20.0, 24.0, 28.0, 32.0, 36.0 & 40.0 Hz. This chart is based on Tomsk, Russia, time UTC +7 (UTC = Universal Time Coordinated).
What is a Spectrogram?
The Spectrogram Calendar is a visual representation of the range of frequencies in the magnetic field at a given location. Similar to how an equalizer displays the frequency content of music played on your stereo, the spectrogram calendar displays the frequency content of a magnetic field. Instead of showing a brief snapshot, it shows changes over a period of time, in this case 3 days.
The local magnetic field is a dynamic field that changes constantly because of variations in the ionosphere and sun and many other influences not yet fully understood. The range of variation displayed in the spectrogram chart is from 0 to 40 cycles per second. The vertical axis is frequency and the horizontal axis is time. The amplitude of a particular frequency at a specific time is represented by the intensity of color (green, yellow, white) of each point in the image.

What is the Schumann Resonance?
The Herathbeat of Planet Earth Read
Clicks on the Ads Keep Us Alive 🙂

Universe
But… if the universe teems with life… Where is everybody?
Enrico Fermi
o wonder!
Schumann Resonance Today. We will try to keep you updated about the variations of the Resonance with this page. The great variations that nobody can explain but that give us a clear sign that the planet is changing. The Earth is vibration higher and higher, just like us!
The Chart time is based on Tomsk – Russia – UTC (Universal Time Coordinated) +7 – Source
SR Base Frequency 7.83 Hz. – Schumann Resonance Today’s Peaks
81
Amplitude
6.60
Quality
7.78
Frequency Max
7.35
Frequency Min
65
Ampltude A2
53
Ampltude A3
44
Ampltude A4
“Every second, a multitude of pulses travel around the world in this unique, resonant chamber between Earth and the ionosphere, sending colluding signals to all microorganisms. These signals couple us to the Earth’s magnetic field. Named after their discoverer, these Schumann Resonances (SR) drive the harmonizing pulse for life in our world.” Eric Thompson
1/72/73/74/75/76/77/78/79/710/711/712/713/714/715/716/717/718/719/720/7020406080100
| x | Amplitude | Average |
|---|---|---|
| 1/7 | 85 | 85 |
| 2/7 | 75 | 80 |
| 3/7 | 18 | 59 |
| 4/7 | 68 | 62 |
| 5/7 | 41 | 57 |
| 6/7 | 99 | 64 |
| 7/7 | 35 | 60 |
| 8/7 | 23 | 56 |
| 9/7 | 69 | 57 |
| 10/7 | 82 | 58 |
| 11/7 | 12 | 55 |
| 12/7 | 58 | 55 |
| 13/7 | 10 | 52 |
| 14/7 | 44 | 51 |
| 15/7 | 21 | 49 |
| 16/7 | 70 | 51 |
| 17/7 | 23 | 49 |
| 18/7 | 8 | 47 |
| 19/7 | 52 | 47 |
| 20/7 | 81 | 49 |
Amplitude Max Values and Average – Schumann Resonance Today
More ChartsTell Us What You Feel! How to Read the Graphs
| 7/20 17:00 | The frequency continues to remain around 7.60 Hz so it is not a completely calm situation with amplitude and quality have small oscillations. |
| 7/20 15:30 | After several days of calm, today the activity has returned in a powerful way, the first period lasted about 6 hours, from 21 to 3 am UTC, touching Power 50 three times; the second period started after 4 hours of calm, at 7 UTC, and lasted just over 6 hours, after a steep initial climb to Power 52 and an hour of strong intensity at 50, the amplitude started to increase again until topping to Power 81. The drop after the peak was sudden and at 14 UTC the amplitude was back to normal values. In all this, the frequency, excluded the calm part from 3 to 7, has had wide variations around 7.60 Hz. |
| 7/20 12:30 | From 11 UTC there was a further rapid increase that brought the Amplitude to Power 81 shortly before 12 UTC. The frequency remains oscillating around 7.60 Hz. |
| 7/20 11:45 | The Freuency remains very low and more Amplitude movements reached again Power 52 at 11:20 UTC. |
| 7/20 11:30 | Another powerful period of activity started at 7 UTC, just under four hours after the previous one and, like that one, reached Power 51 quite quickly just before 10 UTC. During this second movement there was a further drop in frequency which reached 7.35 Hz as a minimum value around 10 UTC. |
| 7/20 8:30 | Today’s first movement lasted about 6 hours straddling midnight UTC, from 21 to 2 am. From 23 to 2 it was a succession of very strong peaks, Power 48, Power 52 and Power 50. One last move at Power 23 occurred at 2 UTC during the rapid drop in Amplitude towards normal values. The frequency during this phase remained at 7.50 Hz and then returned to the base value from 4 UTC. From 7 the frequency started again a rapid drop towards 7.50 Hz, once again setting the Amplitude in motion that at the time of this update is passing Power 20. |
| 7/20 00:00 | The strong movement started at 21 UTC was not anticipated by any particular signal, the Frequency was in a cycle of wide oscillations from 17 UTC. The amplitude started to increase suddenly at 22 UTC and reached the maximum value of Power 52 at 23:40. |
| 7/19 17:00 | Not much to report if not the cyclical ripple of the frequency values which did not produced any significant movement. |
| 7/19 15:00 | From 9 UTC the Frequency started the cycle down again, reaching 7.50 Hz at 2 pm UTC. Previously, during this descent, at 11:30 a peak was recorded at Power 11. |
| 7/19 09:00 | Calm is continuing, the Frequency has started to rise towards the base value at 21 UTC yesterday where it stabilized from 3 UTC today, currently the Amplitude is around Power 5. |
| 7/18 20:30 | A downward fluctuation in Frequency that between 18 and 20 UTC reached 7.35 Hz, slightly moved the amplitude that reached Power 10 at 19:30 UTC. |
| 7/18 17:00 | Total calm throughout the day, in the last few hours the frequency gradually began to decrease to reach 7.60 Hz at the time of this update. Power 8 is the minum value registered during July 2020 until now. |
| 7/18 14:00 | Total calm, maximum value reached was Power 8 at 11 UTC. |
| 7/17 17:00 | Today’s activity, which reached its maximum at Power 23 at 10:30 UTC, lasted about 10 hours, from the first movements at 4 UTC to the calm which returned at 14. The most intense period was from 9 am at 12 UTC when also also Frequency had a sharp drop to 7.30 Hz. |
| 7/17 10:00 | Slight movements started around 4 UTC, with a gradual increase the Amplitude reached and exceeded Power 17 at 9 UTC when the Frequency had a sudden drop towards 7.43 Hz. The Amplitude max value so far is Power 19 at 9:30. Quality also peaked during these more intense variations. |
| 7/16 17:00 | Today’s activity lasted only 4 hours, from 5 to 9 UTC and during this period the highest peak was recorded at Power 70 at 7:30 UTC. |
| 7/16 08:30 | Today’s movements began shortly after 5 UTC when the Frequency, Quality and Amplitude moved from the basic values. The Quality peaked first at 6 UTC, at 7 the Frequency started to decrease and at 7:30 UTC there was the maximum Amplitude value reached, Power 70. |
| 7/15 17:00 | The frequency oscillates around 7.60 Hz, the amplitude has returned to normal values, only the quality fluctuations remain. |
| 7/15 13:30 | The frequency continued to decrease oscillating around 7.60 Hz from 11 UTC, shortly after there has been the movement of the amplitude that reached Power 21. |
| 7/15 11:00 | A gradual decrease in frequency towards 7.60 Hz led to slight movements at Power 16 at 10 UTC. |
| 7/15 09:00 | Since midnight UTC the frequency has stabilized on the base value of 7.83 Hz and all the other parameters have values reduced to a minimum. The calm began at 15 UTC yesterday, 12 hours ago. |
Frequency means how many wave cycle happen in a second, 1 Hz. means 1 cycle per second, 40 Hz. means 40 cycles per second, Amplitude is the size of the vibration, how big is the wave, the chart shows the frequency variation in Hz and the amplitude using the white color.
Note
The Ancient Indian Rishis called 7.83 Hz the frequency of OM. It also happens to be Mother Earth’s natural heartbeat rhythm. Schumann resonances are named after professor Schumann who was involved in early German secret space program and was later paper-clipped into the United States. The frequencies of Schumann resonances are fairly stable and are mainly defined by the physical size of the ionospheric cavity. The amplitude of Schumann resonances does change and is bigger when ionospheric plasma gets excited. Ionospheric plasma excitation happens because of solar activity, thunderstorms, use of scalar plasma weapons and HAARP and lately also when the Light forces are clearing the plasma anomaly.
Schumann Resonance Today – Energy of Consciousness Currents
Show entriesSearch:
| Time UTC +7 | Amplitude | Quality | A+Q | Freq. | Base Freq. | Delta | ECC Increase | TOTAL ECC |
|---|---|---|---|---|---|---|---|---|
| 04/05/2020 18.00.00 | 91 | 5 | 96 | 7,91 | 7,83 | 0,08 | 8 | 104 |
| 03/05/2020 07:00:00 | 81 | 7 | 88 | 7,28 | 7,83 | 0,55 | 48 | 136 |
| 01/05/2020 07:00:00 | 58 | 8,08 | 66,08 | 7,53 | 7,83 | 0,3 | 20 | 86 |
| 30/04/2020 21:15:00 | 90 | 7,46 | 97,46 | 7,36 | 7,83 | 0,47 | 46 | 143 |
| 29/04/2020 17:00:00 | 76 | 6,91 | 82,91 | 7,31 | 7,83 | 0,52 | 43 | 126 |
| 23/04/2020 10:00:00 | 138 | 4,74 | 142,74 | 7,42 | 7,83 | 0,41 | 59 | 201 |
| 19/04/2020 14:45:00 | 88 | 6,49 | 94,49 | 7,25 | 7,83 | 0,58 | 55 | 149 |
| 18/04/2020 16:15:00 | 110 | 7,21 | 117,21 | 7,26 | 7,83 | 0,57 | 67 | 184 |
| 18/04/2020 14:00:00 | 90 | 7,22 | 97,22 | 7,34 | 7,83 | 0,49 | 48 | 145 |
| 18/04/2020 12:00:00 | 81 | 10,9 | 91,9 | 7,24 | 7,83 | 0,59 | 54 | 146 |
Showing 1 to 10 of 67 entriesPreviousNext
Schumann Resonance Today – Energy of Consciousness Currents Posts
The Super-Charged Lion’s Gate Of 2020
Neowise Streaking Thru The Sacred Skies
Galactic Activation Portal Opens
Schumann Resonance PDF Archives
Images Archive
All the SR daily images in one single page See the Images
Explanation of The Chart
The Schumann Resonance Spectrogram Chart
The Schumann Resonance Chart displays data from the magnetic field detector to monitor the resonances occurring in the plasma waves constantly circling the earth in the ionosphere. These three days spectrograms show the activity occurring at the various resonant frequencies from 1 to 40 Hz. Within the spectrogram, the power, or intensity level of each frequency is displayed as a color, with white being the most intense. The Schumann Resonances appear as the horizontal lines at 0.0, 4.0, 8.0, 12.0, 16.0, 20.0, 24.0, 28.0, 32.0, 36.0 & 40.0 Hz. This chart is based on Tomsk, Russia, time UTC +7 (UTC = Universal Time Coordinated).
What is a Spectrogram?
The Spectrogram Calendar is a visual representation of the range of frequencies in the magnetic field at a given location. Similar to how an equalizer displays the frequency content of music played on your stereo, the spectrogram calendar displays the frequency content of a magnetic field. Instead of showing a brief snapshot, it shows changes over a period of time, in this case 3 days.
The local magnetic field is a dynamic field that changes constantly because of variations in the ionosphere and sun and many other influences not yet fully understood. The range of variation displayed in the spectrogram chart is from 0 to 40 cycles per second. The vertical axis is frequency and the horizontal axis is time. The amplitude of a particular frequency at a specific time is represented by the intensity of color (green, yellow, white) of each point in the image.
What is the Schumann Resonance?
The Herathbeat of Planet Earth Read
Clicks on the Ads Keep Us Alive 🙂
Universe
But… if the universe teems with life… Where is everybody?
Enrico Fermi