
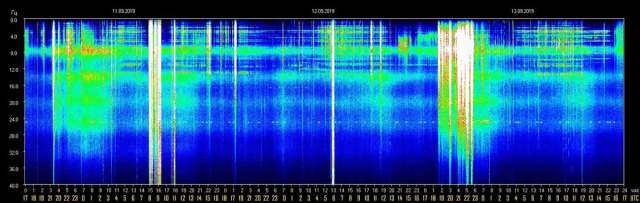
Editor’s Note: Again, we see some significant release of mid-amplitude Schumann Resonance energies on 9/12 from about 1:00 PM until just before 6:00PM (EDT) in America. The chart above shows no significant Schumann Resonance activity for the first 12 hours for Friday, 9/13.
Given the extreme astrological arrangement of planets on this date (9/13) in conjunction with the Full Moon in Pisces, perhaps this moment of not receiving the Schumann Resonance energies is indeed a blessing! Many are now undergoing their own personal emotional awakening and need for other outside energies to be more settled as personal heart-issues are dealt with.
So… please look within yourselves, read the chart above, understand in’s influence on you, and BE…
InJoy!
___________________________________________________________________________________________
38
Schumann Resonance Today. We will try to keep you updated about the variations of the Resonance with this page. The great variations that nobody can explain but that give us a clear sign that the planet is changing. The Earth is vibration higher and higher, just like us!
The Chart time is based on Tomsk – Russia – UTC +7 Source
RS Base Frequency 7.83 Hz.
Schumann Resonance Today Peaks:
- 9/12 21:30 UTC – The activity that started yesterday at 18 UTC lasted 5 hours, until 23 UTC, it has been a powerful movement even if the maximum peak was 38 Hz. For the rest of the day there was a continuous slight background activity.
- 9/12 21:30 UTC – The new graph shows what appears to be the beginning of a significant activity, these movements started at 18 UTC and are in progress, the highest value so far has been 37 Hz.
- 9/12 17:00 UTC – After the solitary spike previously reported, the activity continued but of low entity.
- 9/12 10:00 UTC – The new graph shows a first peak last night at 6 pm UTC which reached 28 Hz, followed by a period of relative calm until 5:30 UTC when a powerful spike reached 49 Hz.
- 9/11 17:00 UTC – Even after previous significant activity the movements continued, but with relatively low peaks, 20 Hz, and are continuing around this magnitude.
- 9/11 10:00 UTC – There was no actual pause after yesterday’s activity, the movements continued with a peak to 29 Hz at 20 UTC while a more powerful activity occurred from 8 UTC with two peaks above 40 Hz the strongest of which to 43 Hz at 9 UTC.
- 9/10 17:00 UTC – Calm. The movements ended at 10 UTC.
- 9/10 10:30 UTC – Today’s chart shows an activity similar to yesterday’s, with isolated peaks, but slightly more continuous. The movements started at 23 UTC yesterday with slight variations. The most significant peaks occurred in rapid succession from 8 UTC with the maximum value 34 Hz at 8:20 UTC.
- 9/9 17:00 UTC – After the two peaks previously reported, another one occurred at 20 Hz at 10:30 UTC after which it was calm.
- 9/9 11:00 UTC – A pair of isolated peaks has been the activity of today until now, the first at 7:30 UTC has reached 27 Hz, the second peak 1 hour later at 8:30 UTC has been at 37 Hz.
- 9/8 17:00 UTC – Even today, looking at the chart, one has the feeling that the activity, in the last four days, is gradually decreasing. Today the movements lasted 6 hours, from 6 to 12 UTC, the maximum peak was 23 Hz at around 7 UTC.
- 9/7 17:00 UTC – Today’s graph shows that in the last 3 days there has been a decline in the intensity of the activity. Today the movements started at 5 and lasted until 11:30 UTC, during this period the maximum peak was 30 Hz at 8:30 UTC.
- 9/6 17:00 UTC – Today’s activity period lasted for about 12 hours, from 23 UTC yesterday to 11 UTC today, now the situation is calm.
- 9/6 10:30 UTC – The activity today started at midnight UTC with small variation on the 15 Hz threshold, from 4 UTC the values increased slightly reaching 20 Hz, at 8 UTC we had the strongest peak until now that reached 44 Hz.
- 9/5 17:00 UTC – The activity after the strong movement described earlier remained calm. The black band is due to lack of data for that time period.
- 9/5 10:00 UTC – The TSU site had some glitches until now, the surprise update shows us a strong activity. The opening was given by an isolated peak at 55 Hz followed by a period of about 2 hours of strong movements culminating with a 67 Hz spike at at 8:30 UTC.
- 9/4 17:00 UTC – Another spike at 27 Hz occurred during a short period of activity lasted 1 hour from 11:30 UTC.
- 9/4 10:00 UTC – The activity continued uninterrupted even today, the most significant part up to now has started at 7 UTC and has led to a peak at 40 Hz just before 8 UTC.
- 9/3 17:00 UTC – Even in today’s chart we can see that there wasn’t a real calm. The periods of most intense activity were two: the first from 7 to 9 UTC which reached the maximum at 20 Hz; the second from 14 to 15 UTC with the maximum at 36 Hz.
- 9/2 17:00 UTC – The situation, after the previous peaks, is in a phase of calm.
- 9/2 11:30 UTC – The variations continued practically without interruption even if with moderate values, at 7 UTC a more significant activity began which led to a peak at 69 Hz at 8 UTC followed by another at 40 Hz about an hour later. This period of elevated activity lasted about 2 hours.
- 9/1 17:00 UTC – There has been no pause, although without excessive values the activity has been continuous and seems to last longer. An isolated peak at 37 Hz occurred at 12:20 UTC.
- 9/1 09:00 UTC – Movements restarted shortly after the midnight shown on the chart, corresponding to 17 UTC. Peaks were moderate with the strongest that reached 36 Hz at 20:30 UTC. After this a period of variations started with the average value being at 20 Hz for 6 continuous hours, from 23 to 5 UTC this morning.
- 8/31 17:00 UTC – Today was a day of continuous light activity. The most active part was from 6 to 10 UTC with two peaks over 30 Hz.
- 8/30 17:00 UTC – The activity is continuing even if the duration of the peaks is lower, at the highest peak of today at 68 Hz others followed, all higher than 55. Since 10:30 UTC today the average has been above 40 Hz.
- 8/30 13:30 UTC – At 8 UTC, quite suddenly, started a powerful activity that after an initial peak at 37 just before 11 UTC led to a powerful 68 Hz around 13 UTC.
- 8/30 09:00 UTC – The activity that we have seen started yesterday in the last part of the chart continued at low but constant levels, so far there has not been a calm period, even if the maximum peaks have only reached 17 Hz.
- 8/29 17:00 UTC – Effectively after the isolated peak of this morning not much happened, just a glimpse of a movement, actually ongoing, that started at 16 UTC.
- 8/29 09:00 UTC – It seems that today will be a day of relative calm, an isolated quick peak occurred just before 6 UTC and reached 19 Hz.
- 8/28 17:00 UTC – After the past strong activity, today, has been a day of relative calm, a light activity occurred from 5 to 11 UTC and the strongest peak was just before 8 UTC at 17 Hz.
- 8/27 17:00 UTC – After the previous peak, the activity continued and seems to be still ongoing. The peaks were slightly lower, at 30 Hz.
- 8/27 13:30 UTC – After 17 hours of calm, at 4 UTC today, a strong increase in activity began, at first gradual then from 10 UTC much more intense. The maximum was reached at 5:20 UTC with 59 Hz.
- 8/26 17:00 UTC – Four isolated peaks today, spaced one from the other from about 2 hours from 4 to 9 UTC with the maximum value at 26 Hz.
- 8/25 17:00 UTC – In total, today’s activity lasted about 9 hours, from 4 to 13 UTC. During this period there were 3 peaks over 40 Hz. From 7 to 10 UTC.
- 8/25 09:30 UTC – This morning at 4 UTC started a consistent activity that seems it could lead to significant peaks. In about 3 hours of constantly increasing values, at 7 UTC it reached 40 Hz.
- 8/24 17:00 UTC – Minor activity today, limited from 7 to 11 UTC, the maximum peak was at 20 Hz at 10:30 UTC.
- 8/23 17:00 UTC – Today’s significant activity was concentrated in about 5 hours, from 4 to 9 UTC, during this period there were 3 peaks 30, 27 and 25 Kek. After this phase of movement, some latency has remained.
- Schumann Resonance Interactive PDF July 2019
- SR Image Archive – July 2019
- 8/22 17:00 UTC – Even today a sort of continuous but scattered activity, shortly after midnight on the chart, 17 UTC, there were variations in amplitude dependencies of a SR frequency of 24 Hz (this for purists who say that the amplitude does not expresses in Hz). A further peak (… … … ….) 34 Hz occurred at 12:30 UTC and marked the beginning of a minor activity that seems to have ended at 17 UTC.
- 8/21 17:00 UTC – After the peaks previously reported, the situation gradually returned to normal, only a small flicker at 14 at 13:30 UTC.
- 8/20 17:00 UTC – The light activity we saw yesterday did not stop and in this new chart we see that it began to intensify since 20 UTC yesterday to then generate a significant first peak at 2 UTC which reached 36 Hz. A few hours later, at 6 UTC, has begun what so far is the strongest activity of the last few days which led immediately to a peak of 46 Hz followed by 44 Hz at 7:45 UTC.
- 8/20 17:00 UTC – Today was characterized by a continuous light background activity that had its isolated peaks at 37 and 26 Hz at 4:45 and 10:30 UTC respectively.
- 8/19 17:00 UTC – Another calm day, there were some variations on 10 Hz around 4 and 9 UTC.
- 8/18 17:00 UTC – Calm.
- 8/17 17:00 UTC – For the 17th of the month, as often happened, there was a bit of entertainment with this representation created by this series of peaks, each lasting about 30 minutes, of a series of bars … Regarding the values , the 57 Hz previously reported remained the highest.
- 8/17 12:00 UTC – Significant activity began this morning at 6 UTC. The variations have been increasing with peaks at 22, 30, 35, 46 and 57 Hz. The latter occurred shortly after 11 UTC.
- 8/16 17:00 UTC – A further modest isolated peak occurred at 11:30 UTC with 15 Hz. This interrupted the calm condition that returned soon after.
- 8/16 11:30 UTC – Today’s activity until now resulted in 3 isolated peaks, all around 23 Hz, occurred at 5, 6 and 7:30 UTC. Apart from these variations it was a condition of calm.
- 8/15 17:00 UTC – After the peak at 33 Hz the amplitude slowly began to decrease with peaks always decreasing until reaching normal values at 13 UTC.
- 8/15 11:00 UTC – Today’s first peak was at 22 Hz at 5:30 UTC and marked the beginning of today’s variations. A second isolated peak reached 33 Hz at 8 UTC.
- 8/14 17:00 UTC – Today’s activity is similar to that of yesterday, only that it was longer, from 2 to 12 UTC. The maximum peaks were 35 and 37 Hz at 6:30 am and 8:30 UTC.
- 8/13 17:00 UTC – After the peaks described previously, the variations in amplitude decreased until calm was reached at 13 UTC.
- 8/13 10:30 UTC – Today is presenting us a medium activity in progress with variations in the amplitude of the Resonance that started at 4 UTC. The first peaks were on 25 Hz while the one that is the highest until now has reached 37 Hz at 7:30 UTC. A further intense peak reached 32 Hz at 9:30 UTC.
- 8/12 17:00 UTC – Today there was a light and sparse activity, in the morning UTC peaks occurred at 15 Hz while at 12 UTC there was a strong isolated peak at 47 Hz.
- 8/11 17:00 UTC – Today’s significant movements began around 7 UTC and soon led to the first of two today’s peaks, 32 Hz at 8 UTC. The second and greatest peak today was 36 Hz at 9:20 UTC. In total this more intense phase lasted about 3 hours.
- 8/10 17:00 UTC – The day continued with rising peaks that after those reported previously continued until reaching today’s high of 35 Hz at 10:45 UTC. From 12:30 UTC the situation is calm.
- 8/10 11:00 UTC – Also today we’re having medium activity, started at 5 UTC. The peaks occurred with amplitude increasing values, from 20 Hz up to what is the highest until now, 30 Hz at 9:20 UTC.
- 8/9 17:00 UTC – Dopo il picco riportato in precedenza l’attività è andata calando fino alla calma.
- 8/9 15:30 UTC – Still light activity, from around 10 UTC very slight variations have started but have led to a peak at 39 Hz at 14 UTC.
- 8/9 11:00 UTC – After the powerful peak yesterday the activity remained calm until 4 UTC today when movements created two consecutive peaks at 20 Hz. After this slight activity the situation became calm again.
- 8/8 17:00 UTC – Today’s activity lasted for about 10 hours, from 6 to 16 UTC. The maximum peak is the one reported previously. Now the situation is calm.
- 8/8 14:00 UTC – Today’s graph shows the sudden start of a strong activity started at 8 UTC, within 30 minutes the maximum peak was reached at 74 Hz. The movements are continuing with other peaks around 30 Hz.
- 8/7 17:00 UTC – Today there are only 3 isolated and moderate peaks, the first at 6:45 UTC at 19 Hz, the second at 7:20 UTC at 15 Hz and the third and last at 8 UTC at 10 Hz. Before and after these peaks was calm .
- 8/6 17:00 UTC – Not much to report today, the activity was concentrated around midnight UTC with a maximum peak at 11 Hz at 00:30 UTC.
- 8/5 17:00 UTC – The resonance remained at a constant level of background, from the amplitude graph we note that there is never really a calm like yesterday. It probably has something to do with the moderate Geomagnetic Storm (see Space Weather) currently underway with KPI 5.
- 8/4 17:00 UTC – Light activity from 9 to 12 UTC with two peaks at 19 and 16 Hz.
- 8/3 17:00 UTC – Calm from 13 UTC.
- 8/3 09:30 UTC – Yesterday’s light activity, which started just before the 24 hours of the chart corresponding to 17 UTC, continued until 19 UTC and the amplitude slightly exceeded 10 Hz. This was followed by another activity from 00 UTC today and the highest peak at 41 Hz occurred soon after, at 00:20 UTC. Another spike at 40 Hz followed at 9 UTC.
- 8/2 17:00 UTC – Today the activity was concentrated in 6 hours, from 2 to 8 UTC, the maximum peak was the one described above. In the last part of the trip reported, from 14 UTC a constant started but for now light activity.
- 8/2 08:30 UTC – Today we are witnessing what appears to be the beginning of a significant phase of activity, it started at 2 UTC and is continuing. After a first peak at 29 Hz at 3:30 UTC, a much higher spike followed reaching 68 Hz at 4:15 UTC.
- 8/1 17:00 UTC – We returned to a light activity, the significant part took place from 6 to 12 UTC with the maximum peak of 27 Hz at 7:40 UTC.
- Frequency means how many wave cycle happen in a second, 1 Hz. means 1 cycle per second, 40 Hz. means 40 cycles per second, Amplitude is the size of the vibration, how big is the wave, the chart shows the frequency variation in Hz and the amplitude using the white color.
Note
The Ancient Indian Rishis called 7.83 Hz the frequency of OM. It also happens to be Mother Earth’s natural heartbeat rhythm Schumann resonances are named after professor Schumann who was involved in early German secret space program and was later paper-clipped into the United States. The frequencies of Schumann resonances are fairly stable and are mainly defined by the physical size of the ionospheric cavity. The amplitude of Schumann resonances does change and is bigger when ionospheric plasma gets excited. Ionospheric plasma excitation happens because of solar activity, thunderstorms, use of scalar plasma weapons and HAARP and lately also when the Light forces are clearing the plasma anomaly.

Dependencies of Amplitudes Schumann Resonance September 13 2019

Dependencies of Quality Schumann Resonance September 13 2019

Dependencies of Frequency Schumann Resonance September 13 2019
Schumann Resonance Differential Peaks
Schumann Resonance PDF Archives
Images Archive
All the SR daily images in one single pageSee the Images

Explanation of The Chart
The Schumann Resonance Spectrogram Chart
The Schumann Resonance Chart displays data from the magnetic field detector to monitor the resonances occurring in the plasma waves constantly circling the earth in the ionosphere. These three days spectrograms show the activity occurring at the various resonant frequencies from 1 to 40 Hz. Within the spectrogram, the power, or intensity level of each frequency is displayed as a color, with white being the most intense. The Schumann Resonances appear as the horizontal lines at 0.0, 4.0, 8.0, 12.0, 16.0, 20.0, 24.0, 28.0, 32.0, 36.0 & 40.0 Hz. This chart is based on Tomsk, Russia, time UTC +7 (UTC = Universal Time Coordinated).
What is a Spectrogram?
The Spectrogram Calendar is a visual representation of the range of frequencies in the magnetic field at a given location. Similar to how an equalizer displays the frequency content of music played on your stereo, the spectrogram calendar displays the frequency content of a magnetic field. Instead of showing a brief snapshot, it shows changes over a period of time, in this case 3 days.
The local magnetic field is a dynamic field that changes constantly because of variations in the ionosphere and sun and many other influences not yet fully understood. The range of variation displayed in the spectrogram chart is from 0 to 40 cycles per second. The vertical axis is frequency and the horizontal axis is time. The amplitude of a particular frequency at a specific time is represented by the intensity of color (green, yellow, white) of each point in the image.

What is the Schumann Resonance?
The Herathbeat of Planet EarthRead

Clicks on the Ads Keep Us Alive

Magic
Magic is a bridge between visible world and invisible world. Always learn teachings of both of the two worlds.
Paulo Coehlo
