37
Schumann Resonance Today. We will try to keep you updated about the variations of the Resonance with this page. The great variations that nobody can explain but that give us a clear sign that the planet is changing. The Earth is vibration higher and higher, just like us!
RS Base Frequency 7.83 Hz.
Schumann Resonance Today Peaks:
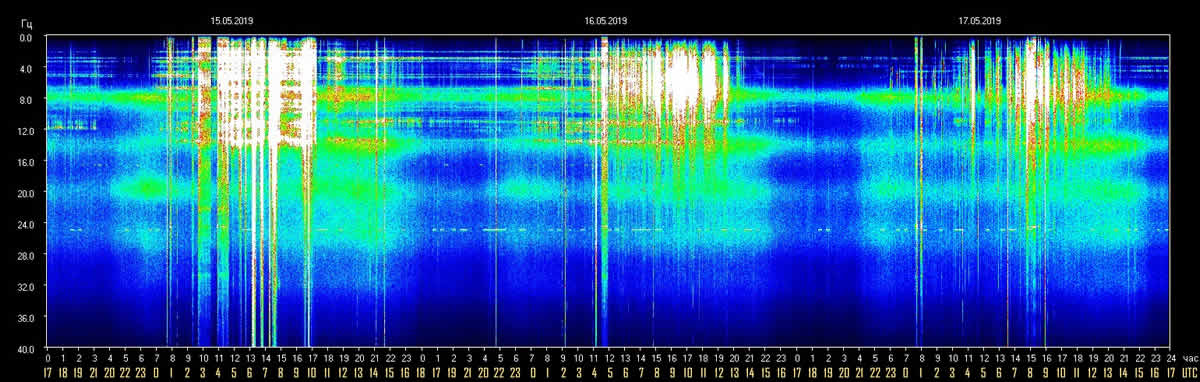
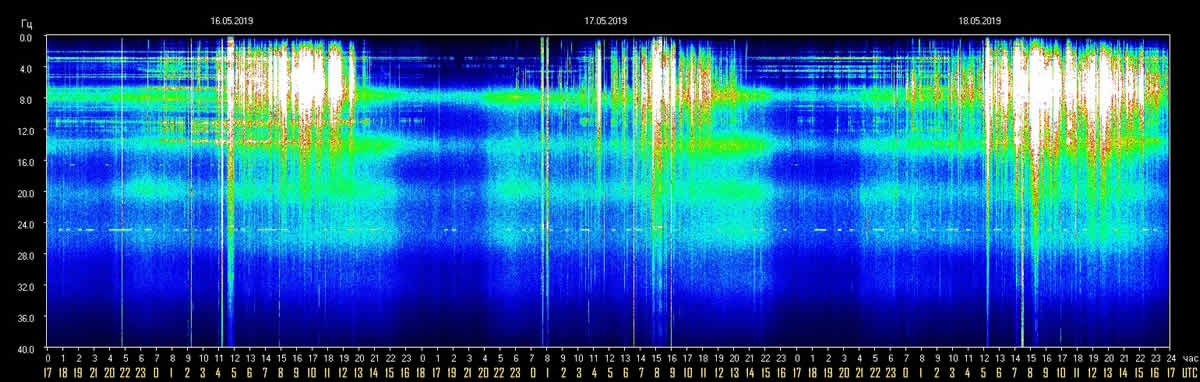
- 5/17 17:00 UTC – Today the activity lasted most of the day, it started with minor peaks at 10 Hz shortly after midnight UTC to then highlight three most significant peaks. The first and most powerful for the day was at 37 Hz at 5 UTC and followed later by two others above 30 Hz. The movements continued between 15 and 30 Hz until 16:30 and then returned to normal values.
- 5/17 17:00 UTC – Today we had an activity similar to that of yesterday even though the peak was slightly higher and reached 29 Hz at 7:30 UTC. The activity took place from 3:30 to 12 UTC, when the amplitude have returned to normal values.
- 5/16 170:00 UTC – Light to moderate activity for today, the peak was at 26 Hz at 9:30 UTC and the range of activity was from 2 to 12:30 UTC.
- 5/15 170:00 UTC – After the peak at 60 Hz the amplitude has suddenly dropped to 15 Hz and then back up to 40 at 9:30 UTC. After this peak the movements finished and the values are back to normal. We are approaching 17 (Q), the day that in the last few months has seen the maximum activity, let’s see if this will be the case this month as well.
- 5/15 10:00 UTC – Today it seems a day with a fairly significant movements, the activity started shortly after midnight UTC with a gradual increase in amplitude values that have so far reached the maximum peak of 60 Hz at 7: 30 UTC.
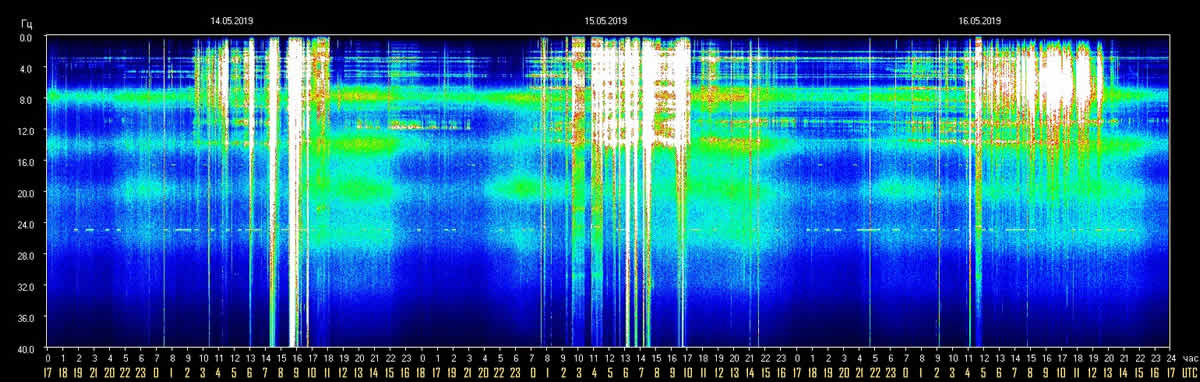
- 5/14 17:00 UTC – After the peak at 50 Hz at 8:30 UTC the amplitude started to decrease, a further movement occurred at 9:45 UTC to 24 Hz after which the values returned normal.
- 5/14 11:30 UTC – Even today a gradual increase in activity that began at 3 UTC with initial peaks at 16 Hz and then increased, approximately every hour, to 44 45 and 50 Hz.
- 5/13 17:00 UTC – Calm.
- 5/13 14:30 UTC – Today’s activity has not been prolonged but shows many quite powerful peaks, the first, fairly rapid and of short duration, reached 74 Hz at 4:30 UTC. It was followed by other peaks at 5:30 am to 43 Hz, at 7:30 am and 10:30 am at 40 Hz. After these powerful movements the amplitude returned to normal levels.
- 5/12 17:00 UTC – 40 Hz was the peak of today, a day of light activity. It occurred at 13:30 UTC, other minor peaks were between 4 and 7:30 UTC with amplitude from 23 to 35 Hz.
- 5/11 17:00 UTC – After the 54 Hz peak reported earlier, the amplitude dropped suddenly to normal values and then rose again just as quickly at 36 Hz. After about 1 hours of activity it is definitively returned to normal values.
- 5/11 08:30 UTC – It seems that today it is proposing itself as a day with strong activity, at least from what we are seeing so far. The first peaks started yesterday’s night UTC but the most significant ones occurred this morning. The first ones were at 30 Hz at 2 and at 3:30 UTC while the one that is most significant for now reached 54 Hz at 6. We are not having the “vertical lines” we have bee used to in the last days, for the ones wondering what causes that we are not able to state what was causing them.
- 5/10 17:00 UTC – Today’s activity was mild with small movements starting shortly after midnight UTC and finished at 13. The highest peak reached 15 Hz at 5:30 UTC. from the graph we note that today there were no “vertical lines” after 2 UTC.
- 5/9 17:00 UTC – Calm.
- 5/9 12:00 UTC – For now we see another day of medium activity in which the amplitude is grazing 40 Hz. The peaks so far have reached 36 Hz at 6:40 am and 8:10 UTC. The “vertical lines” disappeared again from 9 UTC.
- 5/8 17:00 UTC – Calm.
- 5/8 14:00 UTC – The pattern continues, today again the movements started gradually increasing from 4 UTC. Two initial peaks reached about 29 Hz from 7 to 8 UTC. The maximum peak at 36 Hz was at 12:30 UTC, after which the amplitude began the rapid descent towards normal values.
- 5/7 17:00 UTC – The movements between 20 and 35 Hz continued from 10 to 12 UTC after which the amplitude started to decrease to return to normal values at 13 UTC.
- 5/7 11:00 UTC – Also today we are again at 40 Hz. The activity started with increasing peaks from 3 UTC at 15 Hz to continue from 5:30 to 6:15 am with amplitude at 30 Hz and the peak at 40 Hz at 8:30 UTC. The movements above 30 Hz are still in progress.
- 5/6 17:00 UTC – After the peak above 40 Hz the activity decreased to stay for about 1 hour at 20 Hz and then decreased further and reached normal amplitude values.
- 5/6 10:00 UTC – After a period of about 24 hours in which the dense vertical lines were not present in the graph, today they have reappeared, together with the activity that restarted at 5:30 UTC. The peaks were gradually increasing in amplitude with the first at 30, the second at 35 and the third at around 42 Hz.
- 5/5 17:00 UTC – Calm.
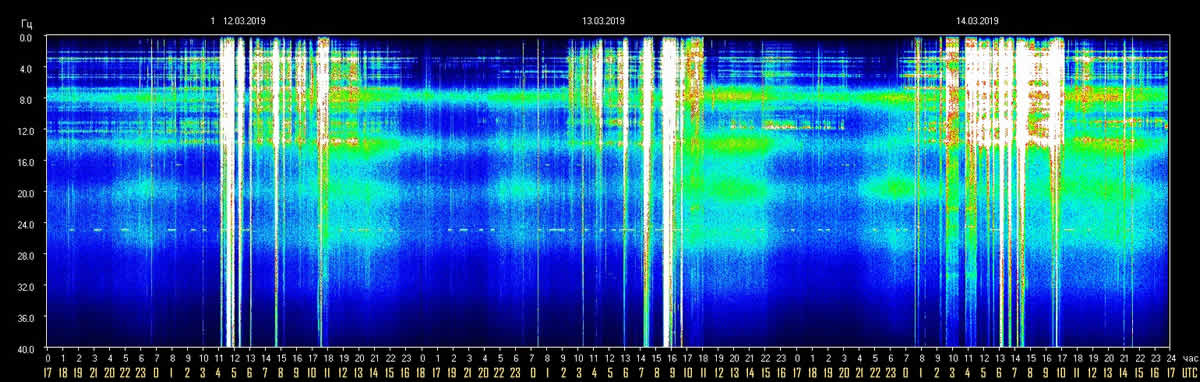
- 5/5 15:00 UTC – In the graph of the last three days that is shown today there is clearly a sort of pattern that we have already highlighted many times before, especially in recent months. A sort of daily crescendo with an increase in activity to culminate in a day or two of very powerful movements that previously reached and exceeded 100 Hz. In these last hours we can also note the end of the vertical lines and dashes that have been a constant in the last weeks. This can be seen even in the difference in the chart of the Dependencies of Quality.
- 5/5 13:00 UTC – The amplitude up to now has remained above 50 Hz for 4 hours, from 6 to 10 UTC with a maximum peak at 60 Hz at 8 UTC. From 10:30 UTC the movements slowed down to 30 Hz.
- 5/5 08:30 UTC – It appears that new significant activity is developing which, as often happens, starts gradually with an increase in amplitude day after day. Today the activity started quite suddenly at 5 am UTC and within 90 minutes reached, at 6:30 UTC, the peak of 53 HZ. It continued at 50 Hz for about an hour. We will see evolution in the coming hours.
- 5/4 17:00 UTC – Medium activity today, circumscribed between 3 and 11 UTC. The most significant peaks were at 5 UTC with 33 Hz and at 9:30 UTC with 29 Hz.
- 5/3 17:00 UTC – Not much to say today, the few peaks were concentrated between 6 and 10 UTC and the maximum amplitude was about 20 Hz. Instead, it is continuing the grid of lines and dashes, probably frequency oscillations, we have already seen them other times previously, they lasted a few days, until we thought it was the new “vibrational” configuration but then they disappeared.
- 5/2 – A contrasting day, with a bit of calm and some medium activity. Today’s peaks occurred between 6 and 12 UTC, the most significant being just after 8 UTC and reached 33 Hz soon after followed by one at 30 Hz. The other peaks were about 20 Hz.
- 5/1 17:00 UTC – After about 90 minutes on the 40 Hz from 11 to 12:30 it went to about 1 hour and a half at 30 Hz until 2 pm, after which the amplitude returned to normal values.
- 5/1 12:30 UTC – There was not much calm after yesterday’s powerful 70 Hz spike, the last 18 hours of the graph show continuous movements that are constantly above 40 Hz from 9 UTC. The peaks so far have been at 46 Hz at 10 and 10:30 am UTC.
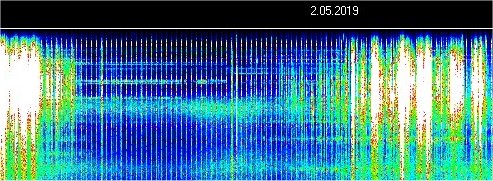
- We added a new charts below, we’ll try to post it daily to show the actual peaks above 40 Hz.
- Frequency means how many wave cycle happen in a second, 1 Hz. means 1 cycle per second, 40 Hz. means 40 cycles per second, Amplitude is the size of the vibration, how big is the wave, the chart shows the frequency variation in Hz and the amplitude using the white color.
The Chart time is based on Tomsk – Russia – UTC +7 Source
Note
The Ancient Indian Rishis called 7.83 Hz the frequency of OM. It also happens to be Mother Earth’s natural heartbeat rhythm Schumann resonances are named after professor Schumann who was involved in early German secret space program and was later paper-clipped into the United States. The frequencies of Schumann resonances are fairly stable and are mainly defined by the physical size of the ionospheric cavity. The amplitude of Schumann resonances does change and is bigger when ionospheric plasma gets excited. Ionospheric plasma excitation happens because of solar activity, thunderstorms, use of scalar plasma weapons and HAARP and lately also when the Light forces are clearing the plasma anomaly.

Dependencies of Quality Schumann Resonance May 18 2019

Dependencies of Amplitudes Schumann Resonance May 18 2019
Schumann Resonance Differential Peaks
Schumann Resonance PDF Archives
Images Archive
All the SR daily images in one single pageSee the Images

Explanation of The Chart
What is the Schumann Resonance?
The Herathbeat of Planet EarthRead

Clicks on the Ads Keep Us Alive

Earth
There will be a shifting of the poles. There will be upheavals in the Arctic and the Antarctic that will make fotr the eruption of volcanos in the Torrid areas… The upper portion of Europe will be changed in the blink of an eye. The earth will be broken up in the western portion of America. The greater portion of Japan must go into the sea.
Edgar Cayce