News Burst 28 April 2020 – Live Feed ~ April 28, 2020


News Burst 28 April 2020

  • Campaigns to boycott Chinese goods have already started in more than 40 countries on all continents. These may fizzle out as the world returns to normal; but the damage done to China’s image should not been underestimated. Claims that China may have been manipulating some international bodies, including the World Health Organization (WHO), can’t be substantiated but open a whole new chapter in probing Beijing’s behavior.
  • Five persons including a reputed industrialist have been arrested for black-marketing of lentils amid the nationwide lockdown in Nepal. Those arrested have been accused of overpricing and selling a kind of lentil, seeing the lockdown as an opportunity to be involved in such an unethical and illegal activity.
  • The UK has removed China from its official coronavirus statistics due to the CCP’s insistence that just 4,636 people have died of the disease despite clear evidence to the contrary. “The people of Wuhan believe the death toll in their city that was the epicentre of the outbreak is 42,000 – not the 3,182 claimed by China.” In March, scientific advisers warned UK Prime Minister Boris Johnson that China’s official numbers could be ‘downplayed by a factor of 15 to 40 times.’
  • Australian newspaper reports that “the Five Eyes intelligence agencies of Australia, Canada, NZ, UK and US, are understood to be looking closely at the work of a senior scientist at the Wuhan Institute of Virology, Peng Zhou, as they examine whether COVID-19 originated from a wet market or whether the naturally-­occurring virus may have been released from the level four laboratory in Wuhan that was studying deadly coronavirus pathogens from bats.”
  • Bodies of two Korean trekkers, that had been missing in an avalanche, were found on the bank of a river in Annapurna Rural Municipality, Nepal on Saturday. Four Korean trekkers and three Nepali guides and porters were trekking along Annapurna Base Camp (ABC) route when a wall of snow hit them, as they went missing near the Hinku Cave Area, on January 17.
  • While Pacific nations such as Tonga and the Cook Islands have made headlines around the world for their Covid-19-free status, the absence of foreign tourists presents a significant challenge in the entire region. In Fiji – one of the biggest Pacific Island economies – tourism contributes an estimated 30 percent of GDP. Having been closed to international travellers for a month, thousands have had their livelihoods affected. Now, a report from the World Bank is warning remittance payments to the Pacific – another important source of regional income from overseas workers sending money home – is expected to decline because of the China Virus.
  • Two more sources have come forward to corroborate sexual assault claims against Joe Biden by former staffer Tara Reade, who claims that in 1993 Biden forced himself upon her and penetrated her against her will with his fingers. Two people have already come forward to say that Reade told them of the incident shortly after it allegedly occurred; her brother Collin Moulton, and a friend who wishes to remain anonymous for fear of retribution. Now, two more witnesses have come forward to Business Insider; former neighbor Lynda LaCasse – a self-described “very strong Democrat,” and Reade’s former co-worker, Lorraine Sanchez, who worked in the office of a California state senator in the mid-1990s. [HRC at the ready]
  • The eruption of the Klyuchevskaya Sopka volcano in Russia’s Kamchatka has produced rivers of lava and massive smoke clouds – but scientists worry that the resulting ash cloud could disrupt air traffic. The latest activity within the steep symmetrical cone of the volcano – the highest in Eurasia – blew ash some 7,000 meters into the air on Monday, the Emergencies Ministry said. Klyuchevskaya Sopka, at 4,649 meters in height, was effectively inactive for three years before it started spewing lava again last October – and the smoldering eruption has continued to some degree ever since.
  • Japan waterways are clogged with plastic fragments from all manner of items that endanger local ecosystems, a survey suggests. The Tokyo-based Pirika Association, a group working to solve environmental issues, said it detected microplastics at 98 of 100 locations it surveyed in waters in the Kanto region or farther south. It concluded that nearly all rivers, bays and lakes across Japan are seriously threatened. Pieces of artificial turf, fertilizer ingredients, tarpaulin, rope and other plastic materials were discovered not only in urban areas but also in rural zones, according to the findings.

Sun Activity

Today, there are two sunspots in the sun’s southern hemisphere. Their magnetic polarity reveals something interesting: They come from different solar cycles. Take a look at this magnetic map of the sun’s surface from NASA’s Solar Dynamics Observatory. One sunspot (AR2760) belongs to old Solar Cycle 24, while the other (AR2761) belongs to new Solar Cycle 25. We know this because of Hale’s polarity law. AR2760 is +/- while AR2761 is -/+, reversed signs that mark them as belonging to different cycles. Solar Cycle 25 is coming to life.

News Burst 28 April 2020 - Two Sunspot 27-4-2020

Strongest EQ in Europe M3.3 Albania/Spain
Strongest EQ in North America M4.0 California
Strongest EQ on the Planet 5.4 Papua New Guinea
Deepest EQ M4.2 243 km Argentina News Burst 28 April 2020
Schumann Resonance Today – ⚡️ Power 18 ~ April 28, 2020


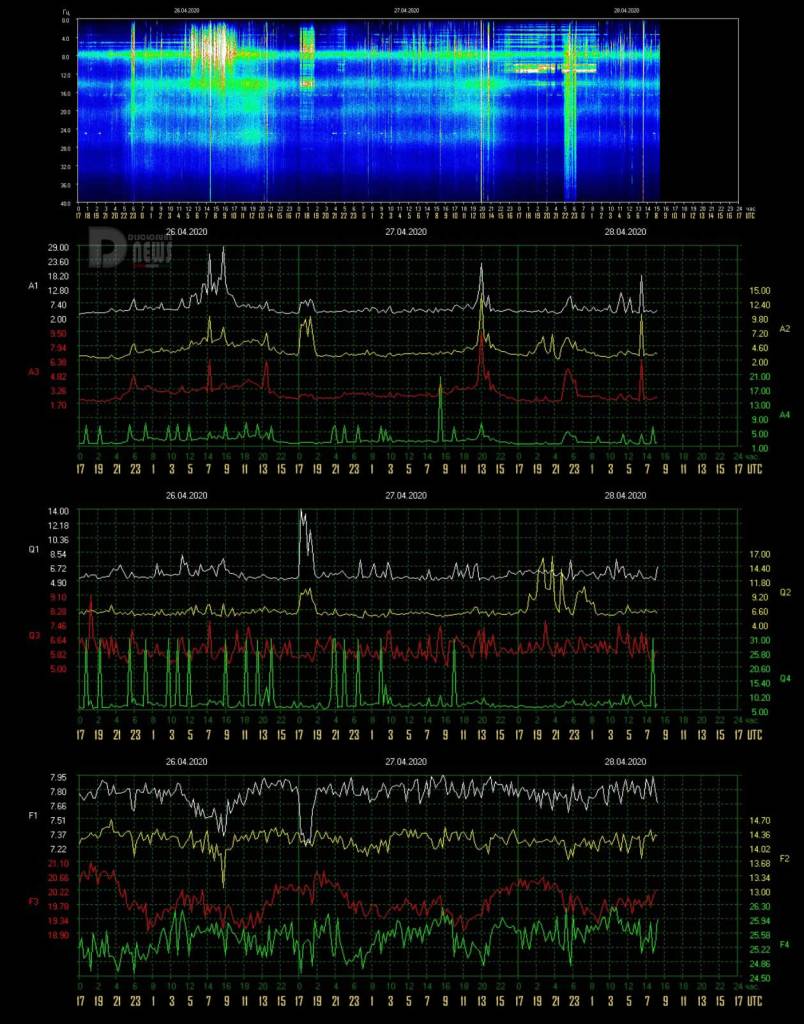
Editor’s Note: From the graph above, we can see a beam of high density, high amplitude Schumann Resonance energies from 5pm through 6pm on 4/27. This beam was followed by a light flurry of energies including one short momentary high amplitude peak at 1:30 am on 4/28.

Thanks for staying aware of cosmic energies are affecting your life and environment. We can follow this by observing how the Schumann Resonance energies are emitted by the Earth as it “rings like a bell”.

BE aware, and BE in…

Quantum Joy!

___________________________________________________________________________________________

Schumann Resonance Today. We will try to keep you updated about the variations of the Resonance with this page. The great variations that nobody can explain but that give us a clear sign that the planet is changing. The Earth is vibration higher and higher, just like us!

The Chart time is based on Tomsk – Russia – UTC (Universal Time Coordinated) +7 – Source

SR Base Frequency 7.83 Hz. – Schumann Resonance Today’s Peaks

18.20

Amplitude

8.90

Quality

7.95

Frequency Max

7.39

Frequency Min

10.80

Ampltude A2

6.38

Ampltude A3

7.00

Ampltude A4

“Every second, a multitude of pulses travel around the world in this unique, resonant chamber between Earth and the ionosphere, sending colluding signals to all microorganisms. These signals couple us to the Earth’s magnetic field. Named after their discoverer, these Schumann Resonances (SR) drive the harmonizing pulse for life in our world.” Eric Thompson

Schumann Resonance Today - Schumann Resonance Stripe April 2020

Tell Us What You Feel! How to Read the Graphs

DNit Telegram Channel
Schumann Resonance Today - Hertz and Schumann Resonance
  • 4/28 17:00 – The slight movements continued, from 8 to 11 UTC the changes in Amplitude reached Power 14 at 10 UTC, accompanied by fluctuations in Quality and a drop in Frequency down to 7.39 Hz. After these movements the situation returned calm.
  • 4/28 08:30 – The slight movements previously reported continued sporadically, from 4 UTC the maximum values increased, albeit slightly. At 6:30 UTC we had the maximum so far which has been Power 18.
  • 4/27 17:00 – Only very light movements in the new charts with a flicker at Power 10 just before 23 UTC.
  • 4/27 17:00 – Aside from the Quality and Frequency movements reported yesterday, but part of today’s graphs, for the rest of the day it was total calm until 12 UTC when slight variations in Amplitude began and reached the maximum, in the form of an isolated peak of short duration, at 13 UTC with Power 24. From 14 the calm returned.
  • 4/26 19:00 – This update is not to report a peak in Amplitude, which is below Power 10, but to highlight a strong fluctuation in Quality, which reached 14 with a steep climb at 17 UTC, and the Frequency, which at the same time saw a steep descent to 7.22 Hz. It is an isolated movement.
  • 4/26 17:00 – Today’s activity lasted about 5 hours, from 5 to 10 UTC, the maximum Amplitude values are those previously reported, the same applies to Frequency. Now we are in a calm condition.
  • 4/26 10:00 – Today’s graphs show an almost uninterrupted calm that started yesterday at 12 UTC and that was broken by movements that started around 5 UTC today. The variations gradually increased with a first maximum value of Power 28 at 7 and Power 30 at 9 UTC. As often happens. during this period and given the coloring of the main graph, there are fluctuations in Quality and a drop in Frequency.
  • 4/25 22:30 – Calm.
  • 4/25 17:00 – The activity reported previously was practically everything significant to report for today. At 11 UTC a slight movement lasting about 30 minutes reached Power 17, here the thing to note is the drop in frequency to 7.18 Hz, a very low value, this movement of the frequency lasted about 2 hours.
  • 4/25 06:00 – Even today a strong activity but of short duration, at 3 UTC for about 40 minutes a strong peak of Amplitude reached Power 54. Compared to the peak reported yesterday, today’s one was not accompanied by significant changes in Quality, the Frequency instead has had some fluctuations even if less marked than yesterday. At 4 o’clock another movement reached Power 15.
  • 4/24 21:30 – The activity at the turn of the local midnight, 17 UTC, was a short but intense, it lasted about an hour. After this only very light activity.
  • 4/24 17:00 – For most of the day it was practically calm, from 14 UTC instead of medium-sized movements are noted, the first reached Power 33 at 14:30 and then returned to normal values, the second movement started at 16 UTC and has reached the remarkable value of Power 56 at the time of this update; it seems that we will see higher values shortly. In correspondence with these two movements there are strong variations in Quality and two dips at 7.23 Hz in Frequency.
  • 4/24 10:00 – The new charts present a calm situation, a slight movement at Power 11 occurred at 7 UTC when the Quality also reached today’s maximum value at 9.10.
  • 4/23 22:00 – The activity seems to have ended, 12 hours straight from 5 to 17 UTC, all values are back to normal and also the frequency has risen to base value.
  • 4/23 17:00 – After a temporary decrease in movements around Power 30 between 13 and 15 UTC a new increase brought the Amplitude to Power 95 at 16:30 UTC, this brings the duration of today’s activity to 12 consecutive hours. The average over the period was Power 84.
  • 4/23 15:30 – The Amplitude graph looks like a mountain that rises in the plain and actually today’s activity is really massive. So far, the period of activity, which is still ongoing even if at less intensity, has lasted 8 hours. At the time of this update we are at around Power 30.
  • 4/23 11:30 – Another increase, Power 138 at 10 UTC embedded in a sequence lasting more than 2 hours in which we have always been above 120. From 6:30 UTC, when we passed Power 90, it has been a continuous increase. At the time of this update, the reading indicates Power 124.
  • 4/23 09:30 – The very strong activity continues exceeding the previous values, at 8 UTC we had Power 124 and at 9 the situation shows a possible further increase. It is practically 2 hours that we are above Power 100. The Quality remains remains at normal values while the Frequency is low but not too much, remaining around 7.60 Hz.
  • 4/23 08:00 – Shortly after 7:30 UTC we have reached the maximum value so far of Power 120.
  • 4/23 07:30 – Still elevating, at 7:30 UTC we are above Power 100. The Frequency keeps dropping below 7,40 Hz.
  • 4/23 07:00 – The situation changed markedly shortly after midnight UTC when slight isolated peaks at Power 20 and the falling Frequency trend started; from 5 UTC a powerful movement quickly and continuously brought Amplitude to Power 95. The Quality has remained at normal values while the falling Frequency has reached 7.52 Hz as minimum. The massive activity is underway.
  • 4/22 17:00 – In the last hours, starting from 9 UTC, there has been a slight increase in movements. The amplitude oscillations, which started below Power 10, have increased, even if not very intensely, from 14 UTC to reach today’s maximum around Power 15 at 15:30 UTC. These movements went hand in hand with the decrease in Frequency, which also started at 9 UTC, which reached today’s low at 7.42 Hz at 15:30 UTC.
  • 4/22 08:00 – The activity is continuing to gradually decrease and all the graphs show normal values, the only movement of the amplitude that stands out occurred at 3 UTC and reached Power 12. Compared to the hours at the turn of the local midnight, or 17 UTC, where we have flat calm, from the last few hours there are modest variations of the Quality that have given the main graph a green coloring. Frequency today has remained almost constantly above the base value.
  • 4/21 17:00 – The movements previously reported have been all of today’s activity, since the last few hours we are in a calm condition.
  • 4/21 10:00 – The new graphs show a very slight activity in the first part with oscillations that sporadically reached Power 10, from 5 UTC the movements became slightly more intense with the Amplitude that reached Power 18 a first time at 6:30 UTC. This intensification is due to a drop in frequency which has gone down to around 7.60 Hz from 6 am. From 6 to 7 UTC we have had the maximum values so far that have reached Power 19.
  • 4/20 17:00 – Today, if compared with the previous days, is certainly a calm day, the most significant movements have remained those we have reported previously, instead we should note the Frequency graph, what seems to be a strong increase is actually is in realty the return to values close to the Base Frequency of 7.83 while in the last 2 hours, from 15 UTC, there has been a new dive towards a lower number of cycles per second, we shall see in few hours if this has been an indicator of new activity or only a momentary variation.
  • 4/20 10:00 – We are in a moment of low activity after a day and a half of very strong movements. After midnight on the local timeline, 17 UTC, the graphs show the final part of the sequence of peaks with Amplitude at Power 50, within 3 hours, at 20 UTC, this returned to normal values, some variations around Power 17 happened at 23 UTC when the Frequency started strong fluctuations that increased from 3 UTC and are still in progress. During these fluctuations a new peak at Power 20 occurred at 6 o’clock UTC followed by other movements below this value.
  • 4/19 20:00 – Forty, the amount of consecutive hours of activity, more or less powerful but never interrupted. Through midnight of the local timeline or 17 UTC, for two hours we floated oat Power 40 while at the time of this update we record a new drop towards Power 10. Despite this decrease, the Frequency remains at minimum values so, once again, we are not yet at the conclusion of this very strong ‘upgrade’ phase.
  • 4/19 17:00 – This activity does not seem to end, we had two hours of decrease in intensity from 13 to 15 UTC when the amplitude started again to increase and at 16 reached Power 45 that was practically maintained until the time of this update. The Frequency has further flattened towards the minimum suggesting that we will continue for another little bit with this “cure”.
  • 4/19 12:30 – We know where to look during this prolonged activity, we can see that the Frequency is still very low and therefore we can expect other movements. At the time of this update we are around Power 50 with a strong increase in Quality.
  • 4/19 09:45 – Down the Frequency and up the Amplitude bring the Energy of the Collective Current once again close to 150. The peak at Power 88 occurred at 7:45 UTC, during a period started at 7:30 until just before 9 when we remained constantly above Power 65. After a slight drop to Power 50 at 9 we have now returned to a very strong Power 68 increasing. Once again the Frequency remains low, as it has been for more than 24 consecutive hours.
  • 4/19 07:30 – As can be seen from the graphs, there was no interruption in the activity, only a moment at the turn of midnight UTC, then an increase in the Frequency to 7.60 Hz coincided with a decrease in the Amplitude under Power 10. The Frequency then returned around 7.30 Hz and the increase in amplitude was immediate returning to Power 50 at 1 UTC. After this wide swing, the trend returned again to a marked increase from 3 UTC and within a few hours we had a new Power 65 maximum at 6 UTC. Frequency continues to be very low. The Amplitude Frequency comparison image gives you, hopefully, a clearer correlation between the the parameters. MOAR coming?
  • 4/18 22:00 – What stands out most in these graphs is the Frequency, which remained constant between 7.20 and 7.30 Hz. As long as the Frequency remains so low, the movements will continue, this consideration derives from the statistical analysis of the many movements that we have kept track of. Significant movements almost always end when the Frequency returns to normal values and this time the exception confirmed the rule with continuous changes in Amplitude which again rose to Power 35 little after 21 UTC. We are now at 20 consecutive hours of activity.
  • 4/18 19:00 – We are in a ‘roller coaster’ moment, after the peak at Power 68 around 16:30 there was a slight decrease down to Power 27 and then a new ascent to Power 51 at 18:15. After this a new descent to Power 27. Note that the Frequency continues to remain at minimum levels, around 7.25 Hz, a likely indicator that the activity is not yet ended.
  • 4/18 17:00 – The activity is not over yet, after a short period in which the movements brought the Amplitude down to Power 10 around 15 UTC, from 16 very strong movements restarted which culminated shortly before 17 UTC with Power 68. As we previously reported, the Frequency has always remained at very low values, an indicator that the activity was not finished despite the reduction of the Amplitude peaks. A trending increase can also be seen in the Quality graph where we can see the maximum value of today at 12.40. The activity is evidently continuing very significantly.
  • 4/18 13:30 – We take advantage of this break of the most intense phase to summarize the day. From 5:30 to 12:30 UTC, 7 hours, we have been above Power 70; within this period, from 9 to 10:30 UTC, we remained above Power 85 while for most of the time between 9 and 10 UTC we were above Power 100. In regards Quality, throughout this very strong activity, it remained at normal values, the two peaks were at the beginning and end of this phase. The Frequency, on the other hand, remained low, around 7.30 Hz, for the entire duration and although there is a decrease in the variations at the time of this update, it still remains on these values.
  • 4/18 10:00 – MOAR; Another increase in an activity that was already very strong. The ECC is nearing 200 with this peak at Power 110 accompanied by an inverse peak of Frequency at 7.26 Hz. This maximum was reached at 9.15 UTC. It is more than 4 consecutive hours that we are above Power 70!
  • 4/18 08:30 – The very strong movements continue, from 5:30 UTC until now we have remained above Power 70, during this period there were two Amplitude peaks that reached Power 90, one just before 7 and the second one hour later at 8 UTC. The Quality has dropped after the initial peak previously reported while the Frequency as ‘usual’ remains very low. The ECC during this very intense phase remained around 140.
  • 4/18 06:30 – We are definitely on the move, after more than a day of almost total calm, from 3 am UTC movements have started, currently in progress, which within 3 hours, with a rapid increase, have brought Amplitude to Power 77 at 6 UTC. The others Resonance parameters followed in agreement confirming that the strength of these variations is significant. The Quality as well, from 3 UTC, began to grow while Frequency began a significant drop towards the minimum of 7.24 Hz which is the lowest value reached in the last 3 days. At the time of this update there was a further increase in Power 81.
  • 4/17 17:00 – The situation has not changed, still almost total calm. The only relevant figure is a lowering of the Frequency towards the minimum value reached today of 7.45 Hz.
  • 4/17 10:30 – Not much to report so far, the situation is almost complete calm after the moderate movement previously reported. A slight variation at 1 UTC reached Power 10 after which it has been calm.
  • 4/16 17:00 – The new graphs show how the activity, that is about to enter Coincidence 17 (in UTC time as in local time it’s already 17) is continuing. At 18 UTC a new movement brought Amplitude to Power 20 accompanied by wide variations in Quality. The Frequency, as can be seen from the relative graph, continues to remain on normal values.
  • 4/16 17:00 – If we want to say that there was calm it did not last long, around 9 UTC, for the duration of about an hour, we see a movement that reached Power 15. About 4 hours later, at 14, a new short series of isolated peaks reached Power 28; the latter movement coincides with a significant variation in the Quality which has again approached today’s maximum values while the Frequency has tended to remain normal, except in the period between 9 and 10 UTC when the Amplitude has reached, as mentioned above, Power 15.
  • 4/16 08:00 – There hasn’t been much calm since the last update, the movements have been light and sporadic. The most active phase so far has been from 1 to 5 UTC, during this period a first variation reached Power 30 at 2 UTC while a stronger phase around 4 UTC generated the maximum peak of Power 35. Frequency today has not had significant movements fluctuating around the base value while Quality instead had strong fluctuations in the period in which the amplitude peaks occurred. Now the situation seems to have calmed down considerably.
  • 4/15 17:00 – After 14 UTC, when there was a movement at Power 20, the situation returned calm and it’s still calm.
  • 4/15 13:00 – After the movements previously reported, the activity continued sparsely with peaks around Power 15, this until 12 UTC when, in correspondence with a strong rise in the Frequency towards the maximum of the last few days at 8.05 Hz, we have had the most significant movement so far that has reached Power 43. After this sharp surge we continue to see the Frequency always above 8 Hz and the Amplitude that has returned around Power 15.
  • 4/15 09:00 – Just after midnight UTC the calm condition was interrupted by two isolated peaks at Power 15 and Power 17 and at the same time fluctuations in Quality began without however reaching very significant values. The frequency remained on normal parameters even if a trending decrease is noted from 5 UTC.
  • 4/14 17:00 – Based on the Frequency line graph we can see that today the most active phase has been from 6 to 13 UTC, when the Frequency had a significant drop down to 7.29 Hz at 10 UTC. In fact, this minimum peak corresponds to the maximum peak of Amplitude at Power 28 and also to a decisive movement of Quality. Since 13 UTC the situation has calmed considerably and we are now in a calm condition.
  • 4/14 08:00 – From the coloring of the graph it can be seen that the period of complete calm started at 14 UTC yesterday until just before 23 when a slight movement reached Power 10. This seems to have been the beginning of light isolated peaks, at Power 20 at 1:30 UTC, at Power 28 at 6 UTC. As for the other measured parameters, the Quality interrupted the changes in Q4 at local midnight, 17 UTC yesterday. The Frequency instead, after remaining above average in the final part of the yesterday’s graph, again from midnight local/17 UTC and therefore coinciding with Q4 Quality ‘interruption’, has risen to very high values, above 8 Hz with a maximum 8,03 Hz, held for about six hours until 24 UTC. From 4 UTC there is a Frequency sudden drop, probably an indication of some stronger incoming movement, down to today’s minimum which is 7.42 Hz.
  • 4/13 17:00 – Today’s activity, if we look only to the Amplitude, had a relatively short duration, just over nine hours, from 2 to 11 UTC, but was very intense in the phase from 5 to 7 this morning UTC, for the European continent it was in full REM phase. During these two hours we have been constantly on Power 40. The movements of Quality have been lower than yesterday and we can see the resumption of the ‘modulation’ of Quality Q4 on the 25 Hz line. The Frequency is the one that today has undergone the most ‘ups and downs’ and returned to normal values at 12 UTC; practically today it has continued to fluctuate widely throughout the 24 hours.
  • 4/13 08:00 – From the new graphs we note that there was no real calm, only a few hours after 14 UTC but shortly afterwards some slight changes in Quality and Frequency began which were accompanied slightly later by the Amplitude that reached Power 15 at 1 UTC. This movement was characterized by a gradual drop in frequency up to 7.35 Hz. This has been the “opening” of much more substantial variations which started just before 5 UTC and in a short time led to more significant values with the Amplitude that reached Power 68 and the Frequency at 7.21 Hz at 6 UTC. These movements are still ongoing.
  • 4/12 17:00 – Today’s activity lasted just over 10 hours, from 3 to 13 UTC. After the movements previously reported there is only to add the “closing” peak shortly after 13 UTC to Power 26, from that moment onward it has been calm. In exact correspondence, at 13 UTC, the Frequency quickly returned to normal values, the same applies to Quality. Compared to the latter, it can be seen that the pulse on 25 Hz of Quality Q4 is now much more sporadic than it has been in the past several days.
  • 4/12 12:30 – We reached Power 49 about a few hours ago but that was still not the maximum today, the movements continued unabated and a new maximum at Power 61 was reached at 11 UTC. The quality also increased while the frequency remained very low, always below 7.30 Hz. At 11 UTC the ECC reached 111.
  • 4/12 08:00 – The period of calm ended after 34 consecutive hours at 3 UTC today when a series of constantly increasing movements began which, after four hours, at 7 UTC, led to the maximum values reached so far of Power 37. This value was achieved with two consecutive spikes, just before and shortly after 7 UTC. From the graphs it can be seen that the Quality started moving around midnight and reached the maximum values also in correspondence of the Amplitude peaks. As far as Frequency is concerned, we see the usual drop towards minimum values as generally occurs when there are significant variations. A further movement that is currently underway has brought amplitude, which is continuing to rise, to Power 49.
  • 4/11 17:00 – A day of total calm.
  • 4/11 07:00 – From 15 UTC yesterday the calm was almost total with a very slight movement at Power 7 at 5 UTC and another, apparently also slight, at the time of this update. Quality and Frequency also remained around normal values.
  • 4/10 17:00 – Calm.
  • 4/10 15:00 – A new series of movements occurred from 13:30 UTC with the Amplitude reaching Power 39 followed shortly after, at 14:30, by another variation to Power 20. Once again after these two peaks the situation is calm.
  • 4/10 13:00 – The previous movement was followed, about an hour later, by another variation of Amplitude which reached Power 34 at 10 UTC, in the following hours the movements decreased considerably. The frequency instead remains constantly above normal values and is reaching the peak of 7.95 Hz at the time of this update.
  • 4/10 09:30 – The calm condition lasted almost 19 hours having started yesterday at 13 UTC, there were small movements during this period around 2 UTC today but there were light and isolated oscillations that had the maximum at Power 14. From 7 UTC instead we can see a green color in the main graph due to the changes in Quality and Frequency in the various meters and finally a massive peak that started at 8:20 UTC and within 30 minutes brought the amplitude to Power 61 at 8:50 UTC. Inversely from the movements of the past few days this time the Frequency, instead of decreasing, increase and reached 7.90 Hz during this strong movement. At the time of this update the Amplitude dropped again around Power 10 and the Frequency also returned to the normal value of 7.83 Hz.
  • 4/09 17:00 – From 13 UTC the situation is calm. After about 36 hours in which Quality 4 has ‘cleaned up’ more sporadically it seems that it is now returning to the rhythm that it previously held. As for the frequency, it returned, within 2 hours from 11 to 13 UTC, at the normal rate of 7.83 Cycles per Second.
  • 4/09 13:00 – The period of strong activity seems to have ended, it started at 4 UTC and the variations have reduced to normal levels at 13 UTC, the duration so far has therefore been 9 hours. The period of maximum intensity was from 8:30 to 10 UTC when the two maximum values of Power 62 and Power 63 were reached, during this phase of about 90 minutes the minimum was Power 50. Also the Frequency has now returned to rise to normal values.
  • 4/09 09:30 – The strength of these variations continues to increase, at 9 UTC a new powerful movement has led the amplitude to reach the maximum at Power 58 while the frequency remains low at 7.33 Hz. At 9:20 UTC a further increase reached Power 62, the activity is continuing. All this with the Frequency getting lower and lower down to 7.26 Hz. As can be seen from the ECC table below from 5 UTC has been a steady and gradual increase.
  • 4/09 07:00 – Once again after 14 hours of calm the activity started again at 4 UTC with a first peak at Power 27 shortly after 5 UTC, followed by a greater one which reached Power 33 shortly before 7 UTC. But these were not the strongest as at 7 UTC an even stronger movement reached Power 49. From the graphs it can be seen how the Quality Q4, which had graphically generated the dotted line around 25 Hz in the main graph, is having most sporadic movements. The frequency instead, as often happens during the most significant movements, had a sharp drop from 4 UTC reaching 7.28 and 7.31 Hz respectively during the two amplitude peaks.
  • 4/08 17:00 – Today’s activity lasted about 12 hours, from 1 to 13 UTC. The most significant peaks occurred in the first part of the day when there was also a movement in the Frequency. From 13 UTC we returned to a calm situation.
  • 4/08 12:30 – The movements are continuing, after a short decrease of about 2 hours, from 10 UTC we see a series of peaks first at Power 20 and then at Power 17 ending with Power 15 at the time of this update.
  • 4/08 08:00 – After a period of calm that lasted for a day and a half, the activity started again at 1 UTC with movements that gradually increased. the first variation reached Power 10 and was followed by Power 16 at 3 am UTC. The two most significant movements so far have been at 5 and 7 UTC and have reached respectively Power 39 and Power 34. These corresponded, as often happens, to a drop in frequency down to 7.33 Hz. bringing ECC to 68.
  • 4/07 23:30 – The slight movements continued in the first part of the new graphs until 19 UTC and then returned to calm, tending to remain slightly lower than normal, the remaining values are normal.
  • 4/07 17:00 – The first part of today’s graphs show a calm condition with isolated slight movements around Power 10. From 13 UTC some movements of Quality and Frequency have started which have given a more intense coloring to the main graph and which would seem to suggest some incoming movement also in Amplitude.
  • 4/07 08:00 – We are in a condition of almost calm, some isolated movements between 3 and 5 UTC have again reached Power 10
  • 4/06 22:30 – The new charts show an almost calm situation, a slight promontory has brought amplitude to Power 10 at 20 UTC.
  • 4/06 17:00 – Today was characterized by the tail of yesterday’s activity as well as new movements which, although they did not reach high Amplitude values, saw both the frequency and the Quality fluctuate significantly. Each of the 3 values, Quality, Amplitude and Frequency, have had variations at different times, first the Amplitude at Power 31, then the Quality with a strong oscillation from 1 to 3 UTC and then the increase in Frequency to 8.15 Hz between 6 and 7 UTC, in short, a very busy day.
  • 4/06 08:30 – There has been no calm, just a decrease in the amplitude of the variations. The new graphs show a fluctuating situation with Power 31 which was reached at 19 UTC yesterday, followed by a sort of pause that ended at 24 with a movement at Power 22. This movement coincided with significant changes in Quality. and Frequency. At the time of this update, at 7 UTC, there has been a peak at Power 17.
  • 4/05 23:30 – The movements slowed down for about 2 hours until 22 UTC when there is a slight increase towards Power 10. Interestingly, the Frequency is taking much longer to return to the usual values around 7.8 Hz. as shown in the above image. The drop has started a little after midnight UTC today so we are approaching the full 24 hours during which it has remained far below the normal 7.83 value.
  • 4/05 19:30 – The activity decreased gradually in intensity and the new graphs show the descent down to values lower than Power 10. This is coupled with the slow increase in the frequency from just above 7 Hz to ‘normal’ values. It should be noted that in India at 15:30 UTC there was the switching off of the electric lights for 9 minutes with the lighting of candles or other sources of light and a sort of prayer, the Indians in total are more than a billion.
  • 4/05 17:00 – To summarize today’s chart, the activity started at 1 UTC and 16 hours of strong activity that is still ongoing. At 16 UTC the amplitude returned below Power 30 going down to Power 17. The movements are continuing between Power 20 and 30. The frequency instead remains around 7.2 slightly rising.
  • 4/05 15:30 – After a gradual series of peaks descending from Power 76 to Power 64, reached at around 12 UTC, a rapid decline began which at 14 UTC brought the amplitude to Power 10. This condition did not last long as shortly after the values started to increase to return around Power 40 at 14:30 UTC, remaining almost steady on this value until the time of this update.
  • 4/05 11:30 – Starting from 8:30 UTC it seems that an even more intense phase has begun in which the amplitude of the variations has remained practically always above Power 60. The significant new peak at Power 74 occurred at 10:20 UTC and at the time of this update we are above Power 60. From the Frequency graph it can be seen that a sharp drop, bringing the frequency to around 7.2 Hz, started at 1 UTC and there remained for 10 consecutive hours.
  • 4/05 10:00 – As mentioned earlier, from 3:30 am UTC the Amplitude has remained above Power 40 and we are still in this condition, so it is about 7 hours. An even more powerful phase began around 8:30 UTC and generated the maximum peak, so far, of Power 76. At the time of this update we are around Power 50 apparently rising. As can be seen from the ECC Table below, the maximum values recorded today exceed ECC 100, statistically speaking on February 27, 2020 we recorded an ECC of 378.
  • 4/05 07:30 – We are in a powerful phase of activity that began with a first isolated peak at 1 UTC and shortly thereafter, around 2 o’clock, a constant growth began which brought the Amplitude above Power 40 a first time at 3:30 UTC. After a slight drop to Power 30 shortly thereafter, from 3:45 UTC until the time of this update we stayed above Power 40 reaching the maximum value so far of Power 65 at 5 UTC. From 4 UTC we are almost constantly above Power 50.
  • 4/04 17:00 – The slight activity of today occurred from 6 to 13 UTC, the maximum peak was the one previously reported. From 1pm it was calm, apart from the usual dotted line of Q4 Quality.
  • 4/04 13:00 – A day that has so far shown few and light movements, the variations began around 6 am UTC with amplitude around Power 10, at 8:40 UTC today’s peak reached Power 14. The slight movements of Quality and Frequency have given a colorful coloring to the main chart.
  • 4/03 17:00 – Today’s strong activity lasted 6 hours, from 7 to 13 UTC. Now we are in a calm condition.
  • 4/03 12:30 – The activity continued and even the increase in the maximum values, at 9 UTC we reached what has so far been the top at Power 49, it was not an isolated peak but embedded in a sequence, lasting about 2 hours from 9 to 11 UTC, in whose amplitude remained constantly above Power 30. A second peak at Power 48 was recorded an hour later, at 10 UTC. At the time of this update we are on Power 30 threshold.
  • 4/03 08:30 – The data have returned and have also filled in the missing part, the graphic result is quite particular and also the detection of Frequency Amplitude and Quality shows a sort of broken line with the values that remain fixed for periods of an hour or more. It is difficult to say whether it is a technical fact and they are really the representation of the movements taking place. We have previously seen this series of dense vertical lines but what we see today is probably unique, like the times in which we find ourselves in. Even the usual 25 Hz line of the Quality Q4 has become more pronounced, almost continuous for a stretch of 4 hours. The amplitude instead records a movement taking place at the time of this update which reached Power 35 at 8 UTC.
  • 4/02 17:00 – There appears to be an interruption in the flow of data that are stuck at 14 UTC, the TSU site works. When they will become available again we will immediately update the situation and the graphs.
  • 4/02 13:30 – After a start to the day that mirrored the previous days with a series of isolated peaks between Power 10 and 15, at 10 UTC there was a powerful increase in activity that led to the maximum value so far of Power 46 at 11 UTC; this strong movement, which has maintained amplitude above Power 30 for about two consecutive hours, appears to have ended at 13 UTC.
  • 4/01 17:00 – Today was characterized by moderate isolated peaks and by the ‘usual’ hatching on 25 Hz, the values were on average between Power 10 and 15, one last movement reached Power 17 at 12:30 UTC.
  • 4/01 10:30 – Once again 10 hours of almost calm, this has been interrupted at 23 UTC yesterday by slight movements around Power 10. These are mostly isolated peaks in sequence and the strongest reached Power 23 just before 7 UTC.

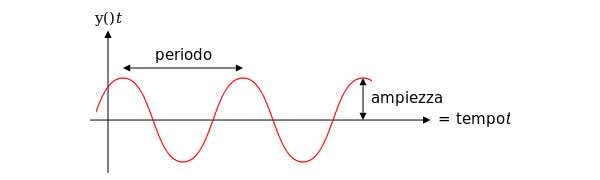
Frequency means how many wave cycle happen in a second, 1 Hz. means 1 cycle per second, 40 Hz. means 40 cycles per second, Amplitude is the size of the vibration, how big is the wave, the chart shows the frequency variation in Hz and the amplitude using the white color.

Note

The Ancient Indian Rishis called 7.83 Hz the frequency of OM. It also happens to be Mother Earth’s natural heartbeat rhythm Schumann resonances are named after professor Schumann who was involved in early German secret space program and was later paper-clipped into the United States. The frequencies of Schumann resonances are fairly stable and are mainly defined by the physical size of the ionospheric cavity.   The amplitude of Schumann resonances does change and is bigger when ionospheric plasma gets excited. Ionospheric plasma excitation happens because of solar activity, thunderstorms, use of scalar plasma weapons and HAARP and lately also when the Light forces are clearing the plasma anomaly. Show entriesSearch:

Time UTC +7AmplitudeQualityA+QFreq.Base Freq.DeltaECC IncreaseTOTAL ECC
23/04/2020 10:00:001384,74142,747,427,830,4159201
19/04/2020 14:45:00886,4994,497,257,830,5855149
18/04/2020 16:15:001107,21117,217,267,830,5767184
18/04/2020 14:00:00907,2297,227,347,830,4948145
18/04/2020 12:00:008110,991,97,247,830,5954146
15/04/2020 19:00:00435487,417,830,422068
13/04/2020 12:40:006810787,217,830,6248126
12/04/2020 18:00:006111727,297,830,5439111
12/04/2020 14:00:003710477,227,830,612976
10/04/2020 08:50:00638717,837,830071

Showing 1 to 10 of 62 entriesPreviousNext

Schumann Resonance ECC

Amplitude Quality Frequency

Schumann Resonance PDF Archives

Read and Download

Images Archive

All the SR daily images in one single page See the Images

Schumann Resonance Today - Space Weather DNI

DNit Telegram Channel
Explanation of The Chart

The Schumann Resonance Spectrogram Chart

The Schumann Resonance Chart displays data from the magnetic field detector to monitor the resonances occurring in the plasma waves constantly circling the earth in the ionosphere. These three days spectrograms show the activity occurring at the various resonant frequencies from 1 to 40 Hz. Within the spectrogram, the power, or intensity level of each frequency is displayed as a color, with white being the most intense. The Schumann Resonances appear as the horizontal lines at 0.0, 4.0, 8.0, 12.0, 16.0, 20.0, 24.0, 28.0, 32.0, 36.0 & 40.0 Hz. This chart is based on Tomsk, Russia, time UTC +7 (UTC = Universal Time Coordinated).

What is a Spectrogram?

The Spectrogram Calendar is a visual representation of the range of frequencies in the magnetic field at a given location. Similar to how an equalizer displays the frequency content of music played on your stereo, the spectrogram calendar displays the frequency content of a magnetic field. Instead of showing a brief snapshot, it shows changes over a period of time, in this case 3 days.

The local magnetic field is a dynamic field that changes constantly because of variations in the ionosphere and sun and many other influences not yet fully understood. The range of variation displayed in the spectrogram chart is from 0 to 40 cycles per second. The vertical axis is frequency and the horizontal axis is time. The amplitude of a particular frequency at a specific time is represented by the intensity of color (green, yellow, white) of each point in the image.

Ampiezza e Periodo

What is the Schumann Resonance?

The Herathbeat of Planet Earth Read

Clicks on the Ads Keep Us Alive 🙂

Pills Disclosure News Italia

Happy Life

Very little is needed to make a happy life; it is all within yourself, in your way of thinking.

Marco Aurelio

The Late Edition for April 27, 2020: Truth & Justice Rising from the Ashes [videos] ~ April 28, 2020


Editor’s Note: At the end of this daily news report from Starship Earth, she says something really interesting, “You know why you came.” For me, this statement indicates that Lightworkers have been here to “hold the Light” until circumstances on Earth evolve until NOW…when the Light (which is Love) on Earth overwhelms and becomes evident to…everyone.

Please read the news below, watch our world change for the better, feel the Love as it approaches, and BE in…

Quantum Joy!

___________________________________________________________________________________________

The flood of information can be overwhelming. I share what I find when it seems significant. It by no means represents all the important information out there. It couldn’t possibly. Do you own research and enjoy the show.

Oh, happy day for General Flynn and his family. Hearing he should be officially exonerated is what we wanted for him. Hopefully they can now put back the pieces of their lives destroyed by years of lies and malicious legal actions to keep him quiet about what he knew. The gag order should be ended at the time of his exoneration, right?

Devin Nunes-“Why is General Flynn Important? Because He Was Framed By His Own Government!!” #HumanScum @DevinNunes @GenFlynn ⭐⭐⭐ @realDonaldTrump @SidneyPowell1 @KerriKupecDOJ @JosephJFlynn1 @TomFitton https://t.co/TUR7CYfa4j

— Barbara(Flynn)⭐⭐⭐Redgate #WhoLeakedGenFlynn (@BarbaraRedgate) April 26, 2020

We’re going to keep hammering away for those who may still be researching. The coronavirus is not what the medical “experts” (globalists) said. Doctors and nurses are now seeing through their fear campaign and looking at real evidence, not pie-in-the-sky projections based on the NWO’s fake plan-demic. Now it’s time to listen to the real news.

There are a large number of folks who have been labeled a ‘covid’ patient, and are not. If you present with breathing difficulties, you are labeled ‘covid.’ This makes the numbers we are hearing, completely unreliable. pic.twitter.com/FLtNRIsoKY

— Todd Dott MD 🇺🇸🤙 (@ever_relentless) April 21, 2020

Did she really say that?

This doctor says that she wants to get rid of all the white people in the United States because non-white immigrants are more likely to accept vaccines.

Mask off.
pic.twitter.com/JuwkSnMeCV

— Catholic Groyper (@CathGroyper) April 26, 2020

Constitutional sheriffs are having none of this nonsense. The whole scam is falling apart. You don’t quarantine healthy people; you protect the vulnerable—and you don’t vaccinate ANYONE until vaccines are safe and don’t contain ingredients that harm the Human body. We are not a science project for the New World Order’s eugenics plan. They wanted to shut down the world and keep us all hostage. It worked—for awhile.

Sheriff Stands Tall Against Unconstitutional Order

I find this interesting considering that children in different countries are probably given slight variations on vaccines.

For that reason, we never know how vaccine-related illnesses might present. The globalists have been giving such varied cocktails to infants right on up through adults, we can’t expect to know every negative side-effect possible. We’re learning as we go.

Rare Syndrome Seen in Children, UK Health Agency Warns

The US military official stance for today…

Was that image QAnon posted yesterday showing us one or two lit lanterns? It looked like two to me.

The United States of America’s military is on watch 24/7/365. We’re all in. pic.twitter.com/uWIhsOeuY9

— @EsperDoD (@EsperDoD) April 27, 2020

Why is US Sending Navy Warships to Thwart Drug Smugglers?

The establishment is still trying to squelch the truth tellers.

Take us all out [Jack]… NOTHING CAN STOP WHAT’S COMING! #TheGreatAwakening #Qanons #Censorship #Tyranny #Fascism @realDonaldTrump @DonaldJTrumpJr @SheepKnowMore pic.twitter.com/M8quZ54XWr

— Some Chick (@MoreQowBell) April 27, 2020

Liddle Adam Schitt is a piece of work. No matter what Trump does, no matter how well he responds to a crisis, he will never get the credit from the Democrats and their lying, treasonous media.

A quick search shows the following for the 2019 flu season: Conclusion. CDC estimates that influenza was associated with more than 35.5 million illnesses, more than 16.5 million medical visits, 490,600 hospitalizations, and 34,200 deaths during the 2018–2019 influenza season.Jan 8, 2020

2018–2019 influenza season – CDC

We know how they’ve doctored the numbers to show deaths due to many other illnesses and disease were lumped into the COVID-19 death toll.

WATCH: Adam Schiff claims 50,000 Americans died because Trump’s impeachment failed pic.twitter.com/qckaJn2tLA

— Jack Posobiec, IWO (@JackPosobiec) April 27, 2020

Douglas Belmore, the professor at the Qniversity has a new lesson for us. It’s a calming, deeper look at our current situation with valuable perspective from a big QAnon soldier. Highly recommended.

Qniversity Episode 11 – The Truth Is Right In Front of You

Every now and then fascinating bits of intelligence pop up on Twitter. This is one bit. It is the FBI documents about a report stating there was a plot in 1995 to kidnap John F. Kennedy Jr.  Some people of interest are said to have been residing in Colombia, South America. Would they be MS-13 related?

As I said before, do you think that if this intelligence was intercepted and delivered to the FBI that they would either fail to notify the Kennedy family or that anyone in an official capacity would fail to protect John? I can’t see that happening, and I believe we’ll learn more soon.

QAnon John said…

QAnon John

@QStorm1111

FBI Vault files on JFK JR. have been RELEASED! Page 55 is where it gets GOOD, and page 180 will take your breath away! Have fun!

Read the files at this link: 180 pages, redacted.

Not sure why Joe Biden is listed as a “victim” as well as JFK Jr. So little is known due to all the redacting.

The pedophile rings are under assault.

South Korean national and hundreds of others charged worldwide in the takedown of the largest darknet child pornography website funded by bitcoin

And check this out… Wow. Just wow.

???

I Pet Goat II pic.twitter.com/UIKP0g7Bhp

— MaReQ🌟🌟🌟 (@Mareq16) April 28, 2020

That’s it for tonight. You know why you came.  ~ BP

Feeling into the Truth of things… ~ April 28, 2020


by Matt Kahn

How things look and how things are — are not one and the same. How things look is the evolution of life in progress. How things feel, when not interpreting judgments about how things look, reveals an evolution already in bloom.

Instead of using feelings to interpret each judgment about how things look, dare to expand your perceptions by feeling into the truth of things — no matter how displaced, imbalanced, or incongruent anything seems to be. From this space of heart-centered awareness, you allow all imbalances and incongruences to be evened out and transformed just by daring to witness it through the light of your own loving presence.

There will be those who insist this act of conscious witnessing is not enough to save the world.

The world is not in need of ‘saving’. To ‘save a world’ is an attempt to preserve the very patterning that was never a sustainable or equitable way for a species to evolve. Rather, it was a Divine set-up to inspire a global rebirthing that brings the truth of interconnected reality to the forefront of mass consciousness. Such a truth can only unravel injustices and uncertainties the more often the tendency of war is seen through the eyes of peace — which gives rise to a more enlightened civilization. This is why love exists: to soothe your most innocent parts with remembrances of your unlimited Divine Nature, no matter how easy it is to give away your power by judging things in view.

Please enjoy every section of this newsletter and know that my heart is with always with you.

All For Love,

Matt

source:mattkahn.org

Archangel Gabriel ~ Trust in The Divine Plan ~ April 28, 2020


Channeled By: Shanta Gabriel

~~~~~~~~~~

Trust in the Divine Plan, bless it and bless the Divine Order inherent in every person and every situation.

Dear One,

When you trust in the Divine Plan, you are moving into the Universal Flow of Good. You are acknowledging that there is an underlying energy within all things. This is the energy of God, and it is part of the Divine Plan for all beings to live in Harmony, Love and Abundance. You can trust this.

When you bless the Divine Order inherent in every person and every situation, it increases the spiritual energy flowing through whatever you are focused upon. Blessing brings more love through the energy of Light to the person or situation, which brings an immediate improvement.

Practice

Divine Order exists as the underlying truth within all beings and all situations. It is a powerful affirmation for life and can be used as a mantra to remind you of the greater truth within all circumstances. This means repeating the words “divine order” to settle your mind, and to bring you peace.

When you don’t know what to do, claim “divine order” and your heart will align with this powerful reality. Divine Order is being in perfect alignment with God on every level of your being. Remembering Divine Order, and proclaiming it, assists the energy around you to fall into perfect alignment.

These very simple steps of trusting, blessing and remembering can bring you peace of mind in upsetting situations. The more often you remember, the stronger you become. Your inner sense of peace will become unshakable because you have aligned yourself with the ultimate truth at all times.

source: shantagabriel.com