Editor’s Note: This is the latest rendition for the “News Blasts” sent out by Disclosure News Italia. This is news from Friday, August 30. Although this is a trifle past date, it does serve to keep us aware of global happenings that may not make MSM news! Please read, be aware, and…
10 people shot in Ladd-Peebles Stadium parking lot @jack was ‘hacked’ Twitter lets #RIP4S trend Hurricane Dorian strengthens, changes course L.A. Angels pitcher Skaggs had fentanyl in system when he died Police bust another multi-state fentanyl ring Iranian rocket explodes on launch pad Sirhan Sirhan stabbed in prison Trump announces federal pay raise for 2020 Taliban launch massive attack on Kunduz Cali court throws out Kate Steinle shooters conviction Health officials suggest avoiding e-cigarettes Valerie Harper passes away iPhones infected with spyware Court upholds BoJo’s suspension of Parliament Fake News media claim Trump does not want in photos with Tiffany Protests in Hong Kong continue Chicago shots shots shots Trump tweets, give them a read No new Q posts What are your weekend plans?
News Blast 28 August 2019
Editor’s Note: From the graph above, we can see a strong amplitude of Schumann Resonance energies at about 1030 followed shortly thereafter bu waves of S.R. energies of moderate amplitude until midnight (EDT)!
This means the Earth continues to receive cosmic and solar energies which, in turn, cause the Earth to emit the Schumann Resonance energies. I wonder about the influence of these energies on up upcoming pole shift from a electo-magnetic standpoint? Please see here for more information on that topic. Worth thinking about, my friends!
So…please view this graph, read te article, draw the lines between the dots, and…
Schumann Resonance Today. We will
try to keep you updated about the variations of the Resonance with this
page. The great variations that nobody can explain but that give us a
clear sign that the planet is changing. The Earth is vibration higher
and higher, just like us!
The Chart time is based on Tomsk – Russia – UTC +7Source
RS Base Frequency 7.83 Hz.
Schumann Resonance Today Peaks:
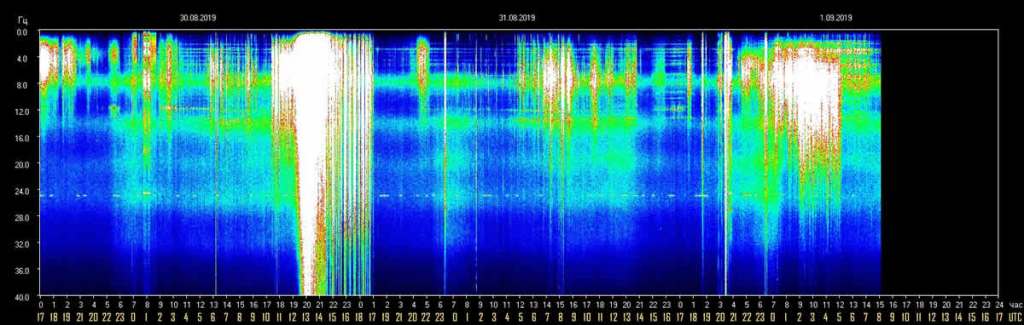
9/1 09:00 UTC – Movements
restarted shortly after the midnight shown on the chart,
corresponding to 17 UTC. Peaks were moderate with the strongest that
reached 36 Hz at 20:30 UTC. After this a period of variations started
with the average value being at 20 Hz for 6 continuous hours, from 23 to
5 UTC this morning.
8/31 17:00 UTC – Today was a day of continuous light activity. The
most active part was from 6 to 10 UTC with two peaks over 30 Hz.
8/30 17:00 UTC – The activity is continuing even if the duration of
the peaks is lower, at the highest peak of today at 68 Hz others
followed, all higher than 55. Since 10:30 UTC today the average has been
above 40 Hz.
8/30 13:30 UTC – At 8 UTC, quite suddenly, started a powerful
activity that after an initial peak at 37 just before 11 UTC led to a
powerful 68 Hz around 13 UTC.
8/30 09:00 UTC – The activity that we have seen started yesterday in
the last part of the chart continued at low but constant levels, so far
there has not been a calm period, even if the maximum peaks have only
reached 17 Hz.
8/29 17:00 UTC – Effectively after the isolated peak of this morning
not much happened, just a glimpse of a movement, actually ongoing, that
started at 16 UTC.
8/29 09:00 UTC – It seems that today will be a day of relative calm,
an isolated quick peak occurred just before 6 UTC and reached 19 Hz.
8/28 17:00 UTC – After the past strong activity, today, has been a
day of relative calm, a light activity occurred from 5 to 11 UTC and the
strongest peak was just before 8 UTC at 17 Hz.
8/27 17:00 UTC – After the previous peak, the activity continued and
seems to be still ongoing. The peaks were slightly lower, at 30 Hz.
8/27 13:30 UTC – After 17 hours of calm, at 4 UTC today, a strong
increase in activity began, at first gradual then from 10 UTC much more
intense. The maximum was reached at 5:20 UTC with 59 Hz.
8/26 17:00 UTC – Four isolated peaks today, spaced one from the
other from about 2 hours from 4 to 9 UTC with the maximum value at 26
Hz.
8/25 17:00 UTC – In total, today’s activity lasted about 9 hours,
from 4 to 13 UTC. During this period there were 3 peaks over 40 Hz. From
7 to 10 UTC.
8/25 09:30 UTC – This morning at 4 UTC started a consistent activity
that seems it could lead to significant peaks. In about 3 hours of
constantly increasing values, at 7 UTC it reached 40 Hz.
8/24 17:00 UTC – Minor activity today, limited from 7 to 11 UTC, the maximum peak was at 20 Hz at 10:30 UTC.
8/23 17:00 UTC – Today’s significant activity was concentrated in
about 5 hours, from 4 to 9 UTC, during this period there were 3 peaks
30, 27 and 25 Kek. After this phase of movement, some latency has
remained.
8/22 17:00 UTC – Even today a sort of continuous but scattered
activity, shortly after midnight on the chart, 17 UTC, there were
variations in amplitude dependencies of a SR frequency of 24 Hz (this
for purists who say that the amplitude does not expresses in Hz). A
further peak (… … … ….) 34 Hz occurred at 12:30 UTC and marked the
beginning of a minor activity that seems to have ended at 17 UTC.
8/21 17:00 UTC – After the peaks previously reported, the situation
gradually returned to normal, only a small flicker at 14 at 13:30 UTC.
8/20 17:00 UTC – The light activity we saw yesterday did not stop
and in this new chart we see that it began to intensify since 20 UTC
yesterday to then generate a significant first peak at 2 UTC which
reached 36 Hz. A few hours later, at 6 UTC, has begun what so far is the
strongest activity of the last few days which led immediately to a peak
of 46 Hz followed by 44 Hz at 7:45 UTC.
8/20 17:00 UTC – Today was characterized by a continuous light
background activity that had its isolated peaks at 37 and 26 Hz at 4:45
and 10:30 UTC respectively.
8/19 17:00 UTC – Another calm day, there were some variations on 10 Hz around 4 and 9 UTC.
8/18 17:00 UTC – Calm.
8/17 17:00 UTC – For the 17th of the month, as often happened, there
was a bit of entertainment with this representation created by this
series of peaks, each lasting about 30 minutes, of a series of bars …
Regarding the values , the 57 Hz previously reported remained the
highest.
8/17 12:00 UTC – Significant activity began this morning at 6 UTC.
The variations have been increasing with peaks at 22, 30, 35, 46 and 57
Hz. The latter occurred shortly after 11 UTC.
8/16 17:00 UTC – A further modest isolated peak occurred at 11:30
UTC with 15 Hz. This interrupted the calm condition that returned soon
after.
8/16 11:30 UTC – Today’s activity until now resulted in 3 isolated
peaks, all around 23 Hz, occurred at 5, 6 and 7:30 UTC. Apart from these
variations it was a condition of calm.
8/15 17:00 UTC – After the peak at 33 Hz the amplitude slowly began
to decrease with peaks always decreasing until reaching normal values at
13 UTC.
8/15 11:00 UTC – Today’s first peak was at 22 Hz at 5:30 UTC and
marked the beginning of today’s variations. A second isolated peak
reached 33 Hz at 8 UTC.
8/14 17:00 UTC – Today’s activity is similar to that of yesterday,
only that it was longer, from 2 to 12 UTC. The maximum peaks were 35 and
37 Hz at 6:30 am and 8:30 UTC.
8/13 17:00 UTC – After the peaks described previously, the variations in amplitude decreased until calm was reached at 13 UTC.
8/13 10:30 UTC – Today is presenting us a medium activity in
progress with variations in the amplitude of the Resonance that started
at 4 UTC. The first peaks were on 25 Hz while the one that is the
highest until now has reached 37 Hz at 7:30 UTC. A further intense peak
reached 32 Hz at 9:30 UTC.
8/12 17:00 UTC – Today there was a light and sparse activity, in the
morning UTC peaks occurred at 15 Hz while at 12 UTC there was a strong
isolated peak at 47 Hz.
8/11 17:00 UTC – Today’s significant movements began around 7 UTC
and soon led to the first of two today’s peaks, 32 Hz at 8 UTC. The
second and greatest peak today was 36 Hz at 9:20 UTC. In total this more
intense phase lasted about 3 hours.
8/10 17:00 UTC – The day continued with rising peaks that after
those reported previously continued until reaching today’s high of 35 Hz
at 10:45 UTC. From 12:30 UTC the situation is calm.
8/10 11:00 UTC – Also today we’re having medium activity, started at
5 UTC. The peaks occurred with amplitude increasing values, from 20 Hz
up to what is the highest until now, 30 Hz at 9:20 UTC.
8/9 17:00 UTC – Dopo il picco riportato in precedenza l’attività è andata calando fino alla calma.
8/9 15:30 UTC – Still light activity, from around 10 UTC very slight
variations have started but have led to a peak at 39 Hz at 14 UTC.
8/9 11:00 UTC – After the powerful peak yesterday the activity
remained calm until 4 UTC today when movements created two consecutive
peaks at 20 Hz. After this slight activity the situation became calm
again.
8/8 17:00 UTC – Today’s activity lasted for about 10 hours, from 6
to 16 UTC. The maximum peak is the one reported previously. Now the
situation is calm.
8/8 14:00 UTC – Today’s graph shows the sudden start of a strong
activity started at 8 UTC, within 30 minutes the maximum peak was
reached at 74 Hz. The movements are continuing with other peaks around
30 Hz.
8/7 17:00 UTC – Today there are only 3 isolated and moderate peaks,
the first at 6:45 UTC at 19 Hz, the second at 7:20 UTC at 15 Hz and the
third and last at 8 UTC at 10 Hz. Before and after these peaks was calm .
8/6 17:00 UTC – Not much to report today, the activity was
concentrated around midnight UTC with a maximum peak at 11 Hz at 00:30
UTC.
8/5 17:00 UTC – The resonance remained at a constant level of
background, from the amplitude graph we note that there is never really a
calm like yesterday. It probably has something to do with the moderate
Geomagnetic Storm (see Space Weather) currently underway with KPI 5.
8/4 17:00 UTC – Light activity from 9 to 12 UTC with two peaks at 19 and 16 Hz.
8/3 17:00 UTC – Calm from 13 UTC.
8/3 09:30 UTC – Yesterday’s light activity, which started just
before the 24 hours of the chart corresponding to 17 UTC, continued
until 19 UTC and the amplitude slightly exceeded 10 Hz. This was
followed by another activity from 00 UTC today and the highest peak at
41 Hz occurred soon after, at 00:20 UTC. Another spike at 40 Hz followed
at 9 UTC.
8/2 17:00 UTC – Today the activity was concentrated in 6 hours, from
2 to 8 UTC, the maximum peak was the one described above. In the last
part of the trip reported, from 14 UTC a constant started but for now
light activity.
8/2 08:30 UTC – Today we are witnessing what appears to be the
beginning of a significant phase of activity, it started at 2 UTC and is
continuing. After a first peak at 29 Hz at 3:30 UTC, a much higher
spike followed reaching 68 Hz at 4:15 UTC.
8/1 17:00 UTC – We returned to a light activity, the significant
part took place from 6 to 12 UTC with the maximum peak of 27 Hz at 7:40
UTC.
Frequency means how many wave cycle happen in a second, 1 Hz.
means 1 cycle per second, 40 Hz. means 40 cycles per second, Amplitude
is the size of the vibration, how big is the wave, the chart shows the
frequency variation in Hz and the amplitude using the white color.
Note
The Ancient Indian Rishis called 7.83 Hz the frequency of OM. It also happens to be Mother Earth’s natural heartbeat rhythm
Schumann resonances are named after professor
Schumann who was involved in early German secret space program and was
later paper-clipped into the United States. The frequencies of Schumann resonances are fairly stable and are mainly defined by the physical size of the ionospheric cavity.
The amplitude of Schumann resonances does
change and is bigger when ionospheric plasma gets excited. Ionospheric
plasma excitation happens because of solar activity, thunderstorms, use
of scalar plasma weapons and HAARP and lately also when the Light forces
are clearing the plasma anomaly.
Dependencies of Amplitudes Schumann Resonance September 1 2019
Dependencies of Quality Schumann Resonance August 31 2019
Dependencies of Frequency Schumann Resonance August 31 2019
All the SR daily images in one single pageSee the Images
Explanation of The Chart
The Schumann Resonance Spectrogram Chart
The Schumann Resonance Chart displays data from the magnetic field
detector to monitor the resonances occurring in the plasma waves
constantly circling the earth in the ionosphere. These three days
spectrograms show the activity occurring at the various resonant
frequencies from 1 to 40 Hz. Within the spectrogram, the power, or
intensity level of each frequency is displayed as a color, with white
being the most intense. The Schumann Resonances appear as the horizontal
lines at 0.0, 4.0, 8.0, 12.0, 16.0, 20.0, 24.0, 28.0, 32.0, 36.0 &
40.0 Hz. This chart is based on Tomsk, Russia, time UTC +7 (UTC =
Universal Time Coordinated).
What is a Spectrogram?
The Spectrogram Calendar is a visual representation of the range of
frequencies in the magnetic field at a given location. Similar to how an
equalizer displays the frequency content of music played on your
stereo, the spectrogram calendar displays the frequency content of a
magnetic field. Instead of showing a brief snapshot, it shows changes
over a period of time, in this case 3 days.
The local magnetic field is a dynamic field that changes constantly
because of variations in the ionosphere and sun and many other
influences not yet fully understood. The range of variation displayed in
the spectrogram chart is from 0 to 40 cycles per second. The vertical
axis is frequency and the horizontal axis is time. The amplitude of a
particular frequency at a specific time is represented by the intensity
of color (green, yellow, white) of each point in the image.
Editor’s Note: This graph is the same as yesterdays graph. The Schumann Resonance energies are high through 12N (EDT). Won’t it be interesting to see if these energies are affected by the HAARP weather system that will probably drive Hurricane Doran up the Southeast cost of the US? Just sayin…
Keep you eyes on the Schumann Resonance chart, kep your eyes on the news this Labor Day weekend, and BE…
Schumann Resonance Today. We will try to keep you updated about the variations of the Resonance with this page. The great variations that nobody can explain but that give us a clear sign that the planet is changing. The Earth is vibration higher and higher, just like us!
The Chart time is based on Tomsk – Russia – UTC +7Source
RS Base Frequency 7.83 Hz.
Schumann Resonance Today Peaks:
8/30 17:00 UTC – The
activity is continuing even if the duration of the peaks is lower, at
the highest peak of today at 68 Hz others followed, all higher than 55.
Since 10:30 UTC today the average has been above 40 Hz.
8/30 13:30 UTC – At 8 UTC, quite suddenly, started a powerful
activity that after an initial peak at 37 just before 11 UTC led to a
powerful 68 Hz around 13 UTC.
8/30 09:00 UTC – The activity that we have seen started yesterday
in the last part of the chart continued at low but constant levels, so
far there has not been a calm period, even if the maximum peaks have
only reached 17 Hz.
8/29 17:00 UTC – Effectively after the isolated peak of this morning
not much happened, just a glimpse of a movement, actually ongoing, that
started at 16 UTC.
8/29 09:00 UTC – It seems that today will be a day of relative calm,
an isolated quick peak occurred just before 6 UTC and reached 19 Hz.
8/28 17:00 UTC – After the past strong activity, today, has been a
day of relative calm, a light activity occurred from 5 to 11 UTC and the
strongest peak was just before 8 UTC at 17 Hz.
8/27 17:00 UTC – After the previous peak, the activity continued and
seems to be still ongoing. The peaks were slightly lower, at 30 Hz.
8/27 13:30 UTC – After 17 hours of calm, at 4 UTC today, a strong
increase in activity began, at first gradual then from 10 UTC much more
intense. The maximum was reached at 5:20 UTC with 59 Hz.
8/26 17:00 UTC – Four isolated peaks today, spaced one from the
other from about 2 hours from 4 to 9 UTC with the maximum value at 26
Hz.
8/25 17:00 UTC – In total, today’s activity lasted about 9 hours,
from 4 to 13 UTC. During this period there were 3 peaks over 40 Hz. From
7 to 10 UTC.
8/25 09:30 UTC – This morning at 4 UTC started a consistent activity
that seems it could lead to significant peaks. In about 3 hours of
constantly increasing values, at 7 UTC it reached 40 Hz.
8/24 17:00 UTC – Minor activity today, limited from 7 to 11 UTC, the maximum peak was at 20 Hz at 10:30 UTC.
8/23 17:00 UTC – Today’s significant activity was concentrated in
about 5 hours, from 4 to 9 UTC, during this period there were 3 peaks
30, 27 and 25 Kek. After this phase of movement, some latency has
remained.
8/22 17:00 UTC – Even today a sort of continuous but scattered
activity, shortly after midnight on the chart, 17 UTC, there were
variations in amplitude dependencies of a SR frequency of 24 Hz (this
for purists who say that the amplitude does not expresses in Hz). A
further peak (… … … ….) 34 Hz occurred at 12:30 UTC and marked the
beginning of a minor activity that seems to have ended at 17 UTC.
8/21 17:00 UTC – After the peaks previously reported, the situation
gradually returned to normal, only a small flicker at 14 at 13:30 UTC.
8/20 17:00 UTC – The light activity we saw yesterday did not stop
and in this new chart we see that it began to intensify since 20 UTC
yesterday to then generate a significant first peak at 2 UTC which
reached 36 Hz. A few hours later, at 6 UTC, has begun what so far is the
strongest activity of the last few days which led immediately to a peak
of 46 Hz followed by 44 Hz at 7:45 UTC.
8/20 17:00 UTC – Today was characterized by a continuous light
background activity that had its isolated peaks at 37 and 26 Hz at 4:45
and 10:30 UTC respectively.
8/19 17:00 UTC – Another calm day, there were some variations on 10 Hz around 4 and 9 UTC.
8/18 17:00 UTC – Calm.
8/17 17:00 UTC – For the 17th of the month, as often happened, there
was a bit of entertainment with this representation created by this
series of peaks, each lasting about 30 minutes, of a series of bars …
Regarding the values , the 57 Hz previously reported remained the
highest.
8/17 12:00 UTC – Significant activity began this morning at 6 UTC.
The variations have been increasing with peaks at 22, 30, 35, 46 and 57
Hz. The latter occurred shortly after 11 UTC.
8/16 17:00 UTC – A further modest isolated peak occurred at 11:30
UTC with 15 Hz. This interrupted the calm condition that returned soon
after.
8/16 11:30 UTC – Today’s activity until now resulted in 3 isolated
peaks, all around 23 Hz, occurred at 5, 6 and 7:30 UTC. Apart from these
variations it was a condition of calm.
8/15 17:00 UTC – After the peak at 33 Hz the amplitude slowly began
to decrease with peaks always decreasing until reaching normal values at
13 UTC.
8/15 11:00 UTC – Today’s first peak was at 22 Hz at 5:30 UTC and
marked the beginning of today’s variations. A second isolated peak
reached 33 Hz at 8 UTC.
8/14 17:00 UTC – Today’s activity is similar to that of yesterday,
only that it was longer, from 2 to 12 UTC. The maximum peaks were 35 and
37 Hz at 6:30 am and 8:30 UTC.
8/13 17:00 UTC – After the peaks described previously, the variations in amplitude decreased until calm was reached at 13 UTC.
8/13 10:30 UTC – Today is presenting us a medium activity in
progress with variations in the amplitude of the Resonance that started
at 4 UTC. The first peaks were on 25 Hz while the one that is the
highest until now has reached 37 Hz at 7:30 UTC. A further intense peak
reached 32 Hz at 9:30 UTC.
8/12 17:00 UTC – Today there was a light and sparse activity, in the
morning UTC peaks occurred at 15 Hz while at 12 UTC there was a strong
isolated peak at 47 Hz.
8/11 17:00 UTC – Today’s significant movements began around 7 UTC
and soon led to the first of two today’s peaks, 32 Hz at 8 UTC. The
second and greatest peak today was 36 Hz at 9:20 UTC. In total this more
intense phase lasted about 3 hours.
8/10 17:00 UTC – The day continued with rising peaks that after
those reported previously continued until reaching today’s high of 35 Hz
at 10:45 UTC. From 12:30 UTC the situation is calm.
8/10 11:00 UTC – Also today we’re having medium activity, started at
5 UTC. The peaks occurred with amplitude increasing values, from 20 Hz
up to what is the highest until now, 30 Hz at 9:20 UTC.
8/9 17:00 UTC – Dopo il picco riportato in precedenza l’attività è andata calando fino alla calma.
8/9 15:30 UTC – Still light activity, from around 10 UTC very slight
variations have started but have led to a peak at 39 Hz at 14 UTC.
8/9 11:00 UTC – After the powerful peak yesterday the activity
remained calm until 4 UTC today when movements created two consecutive
peaks at 20 Hz. After this slight activity the situation became calm
again.
8/8 17:00 UTC – Today’s activity lasted for about 10 hours, from 6
to 16 UTC. The maximum peak is the one reported previously. Now the
situation is calm.
8/8 14:00 UTC – Today’s graph shows the sudden start of a strong
activity started at 8 UTC, within 30 minutes the maximum peak was
reached at 74 Hz. The movements are continuing with other peaks around
30 Hz.
8/7 17:00 UTC – Today there are only 3 isolated and moderate peaks,
the first at 6:45 UTC at 19 Hz, the second at 7:20 UTC at 15 Hz and the
third and last at 8 UTC at 10 Hz. Before and after these peaks was calm .
8/6 17:00 UTC – Not much to report today, the activity was
concentrated around midnight UTC with a maximum peak at 11 Hz at 00:30
UTC.
8/5 17:00 UTC – The resonance remained at a constant level of
background, from the amplitude graph we note that there is never really a
calm like yesterday. It probably has something to do with the moderate
Geomagnetic Storm (see Space Weather) currently underway with KPI 5.
8/4 17:00 UTC – Light activity from 9 to 12 UTC with two peaks at 19 and 16 Hz.
8/3 17:00 UTC – Calm from 13 UTC.
8/3 09:30 UTC – Yesterday’s light activity, which started just
before the 24 hours of the chart corresponding to 17 UTC, continued
until 19 UTC and the amplitude slightly exceeded 10 Hz. This was
followed by another activity from 00 UTC today and the highest peak at
41 Hz occurred soon after, at 00:20 UTC. Another spike at 40 Hz followed
at 9 UTC.
8/2 17:00 UTC – Today the activity was concentrated in 6 hours, from
2 to 8 UTC, the maximum peak was the one described above. In the last
part of the trip reported, from 14 UTC a constant started but for now
light activity.
8/2 08:30 UTC – Today we are witnessing what appears to be the
beginning of a significant phase of activity, it started at 2 UTC and is
continuing. After a first peak at 29 Hz at 3:30 UTC, a much higher
spike followed reaching 68 Hz at 4:15 UTC.
8/1 17:00 UTC – We returned to a light activity, the significant
part took place from 6 to 12 UTC with the maximum peak of 27 Hz at 7:40
UTC.
Frequency means how many wave cycle happen in a second, 1 Hz.
means 1 cycle per second, 40 Hz. means 40 cycles per second, Amplitude
is the size of the vibration, how big is the wave, the chart shows the
frequency variation in Hz and the amplitude using the white color.
Note
The Ancient Indian Rishis called 7.83 Hz the frequency of OM. It also happens to be Mother Earth’s natural heartbeat rhythm
Schumann resonances are named after professor
Schumann who was involved in early German secret space program and was
later paper-clipped into the United States. The frequencies of Schumann resonances are fairly stable and are mainly defined by the physical size of the ionospheric cavity.
The amplitude of Schumann resonances does
change and is bigger when ionospheric plasma gets excited. Ionospheric
plasma excitation happens because of solar activity, thunderstorms, use
of scalar plasma weapons and HAARP and lately also when the Light forces
are clearing the plasma anomaly.
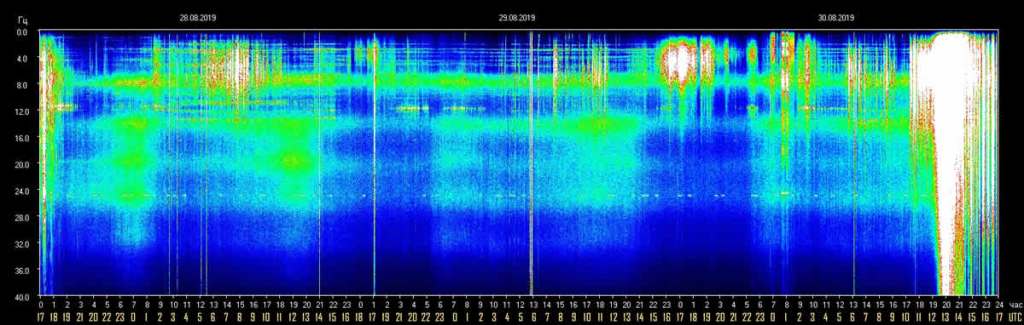
Dependencies of Amplitudes Schumann Resonance August 30 2019
Dependencies of Quality Schumann Resonance August 30 2019
Dependencies of Frequency Schumann Resonance August 30 2019
All the SR daily images in one single pageSee the Images
Explanation of The Chart
The Schumann Resonance Spectrogram Chart
The Schumann Resonance Chart displays data from the magnetic field
detector to monitor the resonances occurring in the plasma waves
constantly circling the earth in the ionosphere. These three days
spectrograms show the activity occurring at the various resonant
frequencies from 1 to 40 Hz. Within the spectrogram, the power, or
intensity level of each frequency is displayed as a color, with white
being the most intense. The Schumann Resonances appear as the horizontal
lines at 0.0, 4.0, 8.0, 12.0, 16.0, 20.0, 24.0, 28.0, 32.0, 36.0 &
40.0 Hz. This chart is based on Tomsk, Russia, time UTC +7 (UTC =
Universal Time Coordinated).
What is a Spectrogram?
The Spectrogram Calendar is a visual representation of the range of
frequencies in the magnetic field at a given location. Similar to how an
equalizer displays the frequency content of music played on your
stereo, the spectrogram calendar displays the frequency content of a
magnetic field. Instead of showing a brief snapshot, it shows changes
over a period of time, in this case 3 days.
The local magnetic field is a dynamic field that changes constantly
because of variations in the ionosphere and sun and many other
influences not yet fully understood. The range of variation displayed in
the spectrogram chart is from 0 to 40 cycles per second. The vertical
axis is frequency and the horizontal axis is time. The amplitude of a
particular frequency at a specific time is represented by the intensity
of color (green, yellow, white) of each point in the image.
Editor’s Note: Again, we see a YUGE spike of Schumann Resonance energies being released from 5AM through 12Noon (EDT) spiking between 7:30AM and 8:30 AM. (EDT).
Is this any coincidence the Earth may have been receiving energies from the New Moon in Virgo at @3:37 AM (EDT) that prompted this release only hours later? Just sayin…
Please read the graph above, scan the article of explanation below, and BE…
Schumann Resonance Today. We will
try to keep you updated about the variations of the Resonance with this
page. The great variations that nobody can explain but that give us a
clear sign that the planet is changing. The Earth is vibration higher
and higher, just like us!
The Chart time is based on Tomsk – Russia – UTC +7Source
RS Base Frequency 7.83 Hz.
Schumann Resonance Today Peaks:
8/30 17:00 UTC – The
activity is continuing even if the duration of the peaks is lower, at
the highest peak of today at 68 Hz others followed, all higher than 55.
Since 10:30 UTC today the average has been above 40 Hz.
8/30 13:30 UTC – At 8 UTC, quite suddenly, started a powerful
activity that after an initial peak at 37 just before 11 UTC led to a
powerful 68 Hz around 13 UTC.
8/30 09:00 UTC – The activity that we have seen started yesterday
in the last part of the chart continued at low but constant levels, so
far there has not been a calm period, even if the maximum peaks have
only reached 17 Hz.
8/29 17:00 UTC – Effectively after the isolated peak of this morning
not much happened, just a glimpse of a movement, actually ongoing, that
started at 16 UTC.
8/29 09:00 UTC – It seems that today will be a day of relative calm,
an isolated quick peak occurred just before 6 UTC and reached 19 Hz.
8/28 17:00 UTC – After the past strong activity, today, has been a
day of relative calm, a light activity occurred from 5 to 11 UTC and the
strongest peak was just before 8 UTC at 17 Hz.
8/27 17:00 UTC – After the previous peak, the activity continued and
seems to be still ongoing. The peaks were slightly lower, at 30 Hz.
8/27 13:30 UTC – After 17 hours of calm, at 4 UTC today, a strong
increase in activity began, at first gradual then from 10 UTC much more
intense. The maximum was reached at 5:20 UTC with 59 Hz.
8/26 17:00 UTC – Four isolated peaks today, spaced one from the
other from about 2 hours from 4 to 9 UTC with the maximum value at 26
Hz.
8/25 17:00 UTC – In total, today’s activity lasted about 9 hours,
from 4 to 13 UTC. During this period there were 3 peaks over 40 Hz. From
7 to 10 UTC.
8/25 09:30 UTC – This morning at 4 UTC started a consistent activity
that seems it could lead to significant peaks. In about 3 hours of
constantly increasing values, at 7 UTC it reached 40 Hz.
8/24 17:00 UTC – Minor activity today, limited from 7 to 11 UTC, the maximum peak was at 20 Hz at 10:30 UTC.
8/23 17:00 UTC – Today’s significant activity was concentrated in
about 5 hours, from 4 to 9 UTC, during this period there were 3 peaks
30, 27 and 25 Kek. After this phase of movement, some latency has
remained.
8/22 17:00 UTC – Even today a sort of continuous but scattered
activity, shortly after midnight on the chart, 17 UTC, there were
variations in amplitude dependencies of a SR frequency of 24 Hz (this
for purists who say that the amplitude does not expresses in Hz). A
further peak (… … … ….) 34 Hz occurred at 12:30 UTC and marked the
beginning of a minor activity that seems to have ended at 17 UTC.
8/21 17:00 UTC – After the peaks previously reported, the situation
gradually returned to normal, only a small flicker at 14 at 13:30 UTC.
8/20 17:00 UTC – The light activity we saw yesterday did not stop
and in this new chart we see that it began to intensify since 20 UTC
yesterday to then generate a significant first peak at 2 UTC which
reached 36 Hz. A few hours later, at 6 UTC, has begun what so far is the
strongest activity of the last few days which led immediately to a peak
of 46 Hz followed by 44 Hz at 7:45 UTC.
8/20 17:00 UTC – Today was characterized by a continuous light
background activity that had its isolated peaks at 37 and 26 Hz at 4:45
and 10:30 UTC respectively.
8/19 17:00 UTC – Another calm day, there were some variations on 10 Hz around 4 and 9 UTC.
8/18 17:00 UTC – Calm.
8/17 17:00 UTC – For the 17th of the month, as often happened, there
was a bit of entertainment with this representation created by this
series of peaks, each lasting about 30 minutes, of a series of bars …
Regarding the values , the 57 Hz previously reported remained the
highest.
8/17 12:00 UTC – Significant activity began this morning at 6 UTC.
The variations have been increasing with peaks at 22, 30, 35, 46 and 57
Hz. The latter occurred shortly after 11 UTC.
8/16 17:00 UTC – A further modest isolated peak occurred at 11:30
UTC with 15 Hz. This interrupted the calm condition that returned soon
after.
8/16 11:30 UTC – Today’s activity until now resulted in 3 isolated
peaks, all around 23 Hz, occurred at 5, 6 and 7:30 UTC. Apart from these
variations it was a condition of calm.
8/15 17:00 UTC – After the peak at 33 Hz the amplitude slowly began
to decrease with peaks always decreasing until reaching normal values at
13 UTC.
8/15 11:00 UTC – Today’s first peak was at 22 Hz at 5:30 UTC and
marked the beginning of today’s variations. A second isolated peak
reached 33 Hz at 8 UTC.
8/14 17:00 UTC – Today’s activity is similar to that of yesterday,
only that it was longer, from 2 to 12 UTC. The maximum peaks were 35 and
37 Hz at 6:30 am and 8:30 UTC.
8/13 17:00 UTC – After the peaks described previously, the variations in amplitude decreased until calm was reached at 13 UTC.
8/13 10:30 UTC – Today is presenting us a medium activity in
progress with variations in the amplitude of the Resonance that started
at 4 UTC. The first peaks were on 25 Hz while the one that is the
highest until now has reached 37 Hz at 7:30 UTC. A further intense peak
reached 32 Hz at 9:30 UTC.
8/12 17:00 UTC – Today there was a light and sparse activity, in the
morning UTC peaks occurred at 15 Hz while at 12 UTC there was a strong
isolated peak at 47 Hz.
8/11 17:00 UTC – Today’s significant movements began around 7 UTC
and soon led to the first of two today’s peaks, 32 Hz at 8 UTC. The
second and greatest peak today was 36 Hz at 9:20 UTC. In total this more
intense phase lasted about 3 hours.
8/10 17:00 UTC – The day continued with rising peaks that after
those reported previously continued until reaching today’s high of 35 Hz
at 10:45 UTC. From 12:30 UTC the situation is calm.
8/10 11:00 UTC – Also today we’re having medium activity, started at
5 UTC. The peaks occurred with amplitude increasing values, from 20 Hz
up to what is the highest until now, 30 Hz at 9:20 UTC.
8/9 17:00 UTC – Dopo il picco riportato in precedenza l’attività è andata calando fino alla calma.
8/9 15:30 UTC – Still light activity, from around 10 UTC very slight
variations have started but have led to a peak at 39 Hz at 14 UTC.
8/9 11:00 UTC – After the powerful peak yesterday the activity
remained calm until 4 UTC today when movements created two consecutive
peaks at 20 Hz. After this slight activity the situation became calm
again.
8/8 17:00 UTC – Today’s activity lasted for about 10 hours, from 6
to 16 UTC. The maximum peak is the one reported previously. Now the
situation is calm.
8/8 14:00 UTC – Today’s graph shows the sudden start of a strong
activity started at 8 UTC, within 30 minutes the maximum peak was
reached at 74 Hz. The movements are continuing with other peaks around
30 Hz.
8/7 17:00 UTC – Today there are only 3 isolated and moderate peaks,
the first at 6:45 UTC at 19 Hz, the second at 7:20 UTC at 15 Hz and the
third and last at 8 UTC at 10 Hz. Before and after these peaks was calm .
8/6 17:00 UTC – Not much to report today, the activity was
concentrated around midnight UTC with a maximum peak at 11 Hz at 00:30
UTC.
8/5 17:00 UTC – The resonance remained at a constant level of
background, from the amplitude graph we note that there is never really a
calm like yesterday. It probably has something to do with the moderate
Geomagnetic Storm (see Space Weather) currently underway with KPI 5.
8/4 17:00 UTC – Light activity from 9 to 12 UTC with two peaks at 19 and 16 Hz.
8/3 17:00 UTC – Calm from 13 UTC.
8/3 09:30 UTC – Yesterday’s light activity, which started just
before the 24 hours of the chart corresponding to 17 UTC, continued
until 19 UTC and the amplitude slightly exceeded 10 Hz. This was
followed by another activity from 00 UTC today and the highest peak at
41 Hz occurred soon after, at 00:20 UTC. Another spike at 40 Hz followed
at 9 UTC.
8/2 17:00 UTC – Today the activity was concentrated in 6 hours, from
2 to 8 UTC, the maximum peak was the one described above. In the last
part of the trip reported, from 14 UTC a constant started but for now
light activity.
8/2 08:30 UTC – Today we are witnessing what appears to be the
beginning of a significant phase of activity, it started at 2 UTC and is
continuing. After a first peak at 29 Hz at 3:30 UTC, a much higher
spike followed reaching 68 Hz at 4:15 UTC.
8/1 17:00 UTC – We returned to a light activity, the significant
part took place from 6 to 12 UTC with the maximum peak of 27 Hz at 7:40
UTC.
Frequency means how many wave cycle happen in a second, 1 Hz.
means 1 cycle per second, 40 Hz. means 40 cycles per second, Amplitude
is the size of the vibration, how big is the wave, the chart shows the
frequency variation in Hz and the amplitude using the white color.
Note
The Ancient Indian Rishis called 7.83 Hz the frequency of OM. It also happens to be Mother Earth’s natural heartbeat rhythm
Schumann resonances are named after professor
Schumann who was involved in early German secret space program and was
later paper-clipped into the United States. The frequencies of Schumann resonances are fairly stable and are mainly defined by the physical size of the ionospheric cavity.
The amplitude of Schumann resonances does
change and is bigger when ionospheric plasma gets excited. Ionospheric
plasma excitation happens because of solar activity, thunderstorms, use
of scalar plasma weapons and HAARP and lately also when the Light forces
are clearing the plasma anomaly.
Dependencies of Amplitudes Schumann Resonance August 30 2019
Dependencies of Quality Schumann Resonance August 30 2019
Dependencies of Frequency Schumann Resonance August 30 2019
All the SR daily images in one single pageSee the Images
Explanation of The Chart
The Schumann Resonance Spectrogram Chart
The Schumann Resonance Chart displays data from the magnetic field
detector to monitor the resonances occurring in the plasma waves
constantly circling the earth in the ionosphere. These three days
spectrograms show the activity occurring at the various resonant
frequencies from 1 to 40 Hz. Within the spectrogram, the power, or
intensity level of each frequency is displayed as a color, with white
being the most intense. The Schumann Resonances appear as the horizontal
lines at 0.0, 4.0, 8.0, 12.0, 16.0, 20.0, 24.0, 28.0, 32.0, 36.0 &
40.0 Hz. This chart is based on Tomsk, Russia, time UTC +7 (UTC =
Universal Time Coordinated).
What is a Spectrogram?
The Spectrogram Calendar is a visual representation of the range of
frequencies in the magnetic field at a given location. Similar to how an
equalizer displays the frequency content of music played on your
stereo, the spectrogram calendar displays the frequency content of a
magnetic field. Instead of showing a brief snapshot, it shows changes
over a period of time, in this case 3 days.
The local magnetic field is a dynamic field that changes constantly
because of variations in the ionosphere and sun and many other
influences not yet fully understood. The range of variation displayed in
the spectrogram chart is from 0 to 40 cycles per second. The vertical
axis is frequency and the horizontal axis is time. The amplitude of a
particular frequency at a specific time is represented by the intensity
of color (green, yellow, white) of each point in the image.
Purdue Pharma offers $10-12 billion to settle opioid claims Epstein accusers speak out in court Camera footage from outside Epsteins cell is reportedly unusable Bedbug infested NY times calls Trumps resort infested with bedbugs Scaramucci says some shit Gay republican group’s director resigns after endorsing Trump Former Google engineer indicted in trade secrets theft case Puerto Rico declared state of emergence ahead of hurricane (Imarriedmybro) Omar at center of political consultant’s divorce Andrew Yang proposes giant space mirrors to combat climate change The price of gold continues to rise Fake news media bring back the Russia narrative Massive fire engulfs church in Philadelphia Dept of Homeland Security moves $271 million from FEMA to border programs Sleepy Joe mumbles some shit Brazil’s president tells Macron to apologize before sending aid Texas woman saws into botox clinic to steal anti-aging cream Chicago to clear marijuana possession convictions by Jan. 1st Trump tweets, give them a read No new Q posts Have you went camping lately? News Blast 27 August 2019
We are working hard, and every day, to keep this blog. Like
you we are fighting for the truth. If you want to work with us you are
welcome, please email us!The blog costs are at our
expense, advertising reimburse us very marginally so if you like our
work and find it useful buy usacoffee clicking the donation button below
that will directu to your PayPal.We need the help of people like you!
Bitcoin & Cryptocurrencies Donation
1M9dohWnHBwNLSPd6afRaJackrw6wK9bxY
Flower of Life Sticker Pack – 10 Stickers – 5 White 5 Black 9.5 x 9.5 cm