Editor’s Note: Please be aware of video’s sent for this News Burst which I AM unable to download. Thanks!
News Burst 6 June 2020
Alleged members of the Gulf Cartel and Jalisco New Generation Cartel distributed aid in Mexico over the weekend. Considered the most powerful cartel in Mexico, Jalisco New Generation Cartel visited eight different towns in the state of San Luis Potosí to provide aid. In recent days, videos and photos were disseminated across social media channels, showing alleged members of the Gulf Cartel and Jalisco New Generation Cartel handing out boxes and plastic bags filled with supplies to residents in low income neighborhoods. The assistance provided by the criminal organizations comes as the poor in a nation of 126 million have clamored for help from government officials tasked with stopping the spread of the contagious virus which has set back the local economy. But now they must said “Thank you mr. El Mencho.” Mexican drug trafficking cartels have made more than 60,000 people have disappeared in Mexico since the start of the country’s war on drugs in 2006, according to authorities. Around 53% of those who disappeared were between the ages of 15 and 35, and 74% were men, officials said.
Louisiana has declared a state of emergency ahead of Tropical Storm Cristobal. The storm system weakened into a Tropical Depression Thursday, but it is expected to gradually strengthen as it moves toward the United States. Once it makes landfall, it will likely become a Tropical Storm. Tropical Storm Cristobal churns in the Caribbean, just off the eastern coast of Mexico. Cristobal is forecast to approach the Louisiana coast by Sunday evening, with winds up to 60 mph. It brought heavy rain and flooding to parts of Mexico and Central America, and now, the same is expected to happen in the U.S. Flood watches have been issued for much of Louisiana, including Baton Rouge and New Orleans, which could see up to 4 inches of rain by the weekend and into early next week.
A giant, sprawling structure almost a mile long has been discovered at the southern tip of Mexico, with researchers saying it may represent the oldest and largest monument of the ancient Maya civilisation ever found. The site, called Aguada Fénix, is located in the state of Tabasco, at the base of the Gulf of Mexico. It’s so vast for its age, the find is making archaeologists recalibrate their timelines on the architectural capabilities of the mysterious Maya. Before now, the Maya site of Ceibal (aka Seibal) was thought to be the oldest ceremonial centre, dating back to around 950 BCE. Aguada Fénix, which measures over 1,400 metres (almost 4,600 ft) in length at its greatest extent, dates to a similar timeframe, with researchers estimating it was built between 1000 and 800 BCE – but its immense size and scope make it unlike anything found before from the period.
As new fiscal year draws near, government’s plan to plant 50million tree saplings in 2019-20 is nowhere near its target. Government officials are confident about meeting the plantation target but they are not willing to bet on the survival of the plants. The plan, made on the occasion of International Forest Day 2019, would be supported by the budgetary backing when the government allocated a budget for a tree plantation programme. Presenting the budget in Parliament, Finance Minister Yubaraj Khatiwada announced, “The coming fiscal year will be declared the Afforestation Year during which a plantation campaign of timber, non-timber and fruit saplings will be undertaken.” The campaign included tree plantation on vacant forest areas, reclaimed river areas, public lands and private forests.
26 Nepalis who were stranded in Myanmar were brought to Nepal on Friday. A Myanmar Air Force aircraft landed at Tribhuvan International Airport at around 11 am with the 26 Nepalis. Of the 26, 17 are from Bagmati Province, four each from Province 1 and Gandaki Province and one from Province 5. “They have been kept in a holding centre at Yeti Party Palace in Basundhara,” said Brigadier General Bigyan Dev Pandey, the spokesperson of the Nepal Army.
Bolivia ordered the closure of its embassies in Nicaragua and Iran while also shuttering three federal ministries in a cost-cutting move to free up money to fight the coronavirus, President Jeanine Anez said Thursday. Former leftist president Evo Morales had established close political and economic ties with the two countries before he resigned last November following days of violent unrest. “We have nothing against those countries, noble people and brothers whom we respect and who are friends,” Anez said in a televised message in which she announced she would “close the Bolivian embassies in Iran and Nicaragua.”
Dutch Prime Minister Mark Rutte said his attitude towards “Black Pete”, a figure from the country’s winter holiday celebrations that has been criticized as a racist caricature, had undergone “great changes” in recent years. In a debate in parliament over anti-racism protests in the Netherlands prompted by solidarity with US demonstrations, Rutte said late on Thursday his view had changed since 2013, when he said “Black Pete is just black and I can’t do much about that” and dismissed the discussion. In the Dutch tradition, St. Nicholas brings gifts to kids accompanied by numerous “Petes”, clownish servants usually portrayed by white people in black face paint wearing frizzy wigs and red lipstick.
The lawsuit against President Joko “Jokowi” Widodo’s decision to cut off the internet in Papua and West Papua during antiracism protests in the two provinces last year was meant to be a call for better policies in the future, the suit’s plaintiffs have said. The plaintiffs, which include the Alliance of Independent Journalists (AJI), the Southeast Asia Freedom of Expression Network (SAFEnet), the Indonesian Legal Aid Foundation (YLBHI) and the Legal Aid Institute for the Press (LBH Pers), said they hoped the government would respect the court’s ruling. The Jakarta State Administrative Court (PTUN) ruled on Wednesday that the government had unlawfully shut down the internet in the two provinces during heightened security tensions caused by waves of protests in August and September of last year.
Argentina extended on Thursday a mandatory lockdown in Buenos Aires, the capital, and some other parts of the country until June 28, as confirmed coronavirus cases continue to rise, surpassing 20,000 earlier in the day. The three-week extension of the lockdown, which had been due to expire June 7, will impact the capital city, the province of Buenos Aires and some other areas that account for the highest concentration of confirmed infections, President Alberto Fernandez said during a press conference. The rest of the country will move to a phase of “mandatory and preventive social distancing.” The next phase will include new permissions, including outdoor exercise during certain hours in the city of Buenos Aires, which has the highest concentration of cases, officials said.
Philippine President Rodrigo Duterte renewed on Friday a threat to kill drug dealers after police seized 756 kg of methamphetamines, a haul he said proved the Southeast Asian country had become a transhipment point for narcotics. The crystal methamphetamine, with a Philippine market value that police put at 5.1 billion pesos ($102.22 million), was one of the biggest seizures since Duterte unleashed his bloody war on drugs, which has defined his presidency, in 2016. “If you destroy my country distributing 5.1 billion pesos worth of shabu … I will kill you,” Duterte said in recorded address, referring to the drugs.
There are reports from northern Mozambique that 12 people have died, including several children, when a boat sank in the bay of Pemba. Thirty-five people survived after swimming ashore on Wednesday. But they were then apprehended by the police on suspicion that they could be recruits to an Islamist militant group that has been mounting attacks in Cabo Delgado province. A new report by the UN says displacement of Mozambique’s civilian population has risen rapidly in recent months as the jihadists have stepped up their attacks. More than 200,000 people – most of them women and children – have been forced to flee their homes since the insurgency began in 2017.
A team of university researchers has found that the probability of scientists discovering Earth-like planets within their early stages of formation is actually higher than previously presumed. New research published in The Astrophysical Journal from scientists at the UK’s University of Sheffield noted that there are many more stars in space that are comparable to our solar system’s sun than expected in the groups of Milky Way stars the study examined, according to the school’s June 5 news release on the matter. As a result, there is a higher chance of finding “magma ocean planets” – or Earth-like planets still in their early stages of being formed from the collisions of rocks and smaller planets – than previously assumed.
Two crew members of an Iranian cargo ship sank off the Iraqi coast Thursday night have died and two others, including an Indian national, are still missing. According to Iranian news agencies, late on Thursday the ship which was carrying a load of 850 tons capsized and sank in Khawr Abdullah Canal between Iraq and Kuwait. The accident has been attributed to bad weather as well as the age of the ship and the weight of its cargo. The five-decade-old and 500 ton Behbahan was carrying ceramic tiles and other construction materials to Iraq’s Umm Qasr Port.
Sun Activity
Solar Cycle 25 is stirring. The latest sign of life is sunspot AR2765, now turning toward Earth in the sun’s southern hemisphere. The sunspot’s primary dark core is almost twice as wide as Earth, and it is followed by a frothy wake of magnetic turbulence stretching 70,000 miles behind the sunspot. These dimensions make it an easy target for backyard solar telescopes.
The sunspot is crackling with minor solar flares. NASA’s Solar Dynamics Observatory recorded this B3-class eruption at 00:01 UT on June 5th. The explosion hurled a cloud of plasma into space, but not toward Earth. Future explosions could be geoeffective, however, as the sunspot turns toward Earth this weekend. Video Player
Strongest EQ in Europe M5.0 North of Svalbard/North Pole – M4.7 Azores Islands Strongest EQ in North America M3.8 Idaho Strongest EQ on the Planet M5.2 Turkey Deepest EQ M4.4 524 km Fiji News Burst 6 June 2020
Share this: Send the word out using these buttons!
Editor’s Note: Yes, Yes, yes…the energies arriving on Earth continue on! The Schumann Resonance energies are showing almost consistently from midnight until 9am on 6/4. Intense, short-lived beams of high density, high amplitude energies are interspersed with moments of similar density of mid-range amplitude.
The daily recurrence of outside, cosmic energies to Earth, causing the Earth to “ring like a bell”, thus… the appearance of Schumann Resonance energies. So…thanks for following these energies, watch and see our world transformed by these energies, and BE in…
Schumann Resonance Today. We will try to keep you updated about the variations of the Resonance with this page. The great variations that nobody can explain but that give us a clear sign that the planet is changing. The Earth is vibration higher and higher, just like us!
The Chart time is based on Tomsk – Russia – UTC (Universal Time Coordinated) +7 –Source
SR Base Frequency 7.83 Hz. – Schumann Resonance Today’s Peaks
46
Amplitude
8.00
Quality
8.07
Frequency Max
7.27
Frequency Min
24
Ampltude A2
11
Ampltude A3
8
Ampltude A4
“Every second, a multitude of pulses travel around the world in this unique, resonant chamber between Earth and the ionosphere, sending colluding signals to all microorganisms. These signals couple us to the Earth’s magnetic field. Named after their discoverer, these Schumann Resonances (SR) drive the harmonizing pulse for life in our world.” Eric Thompson
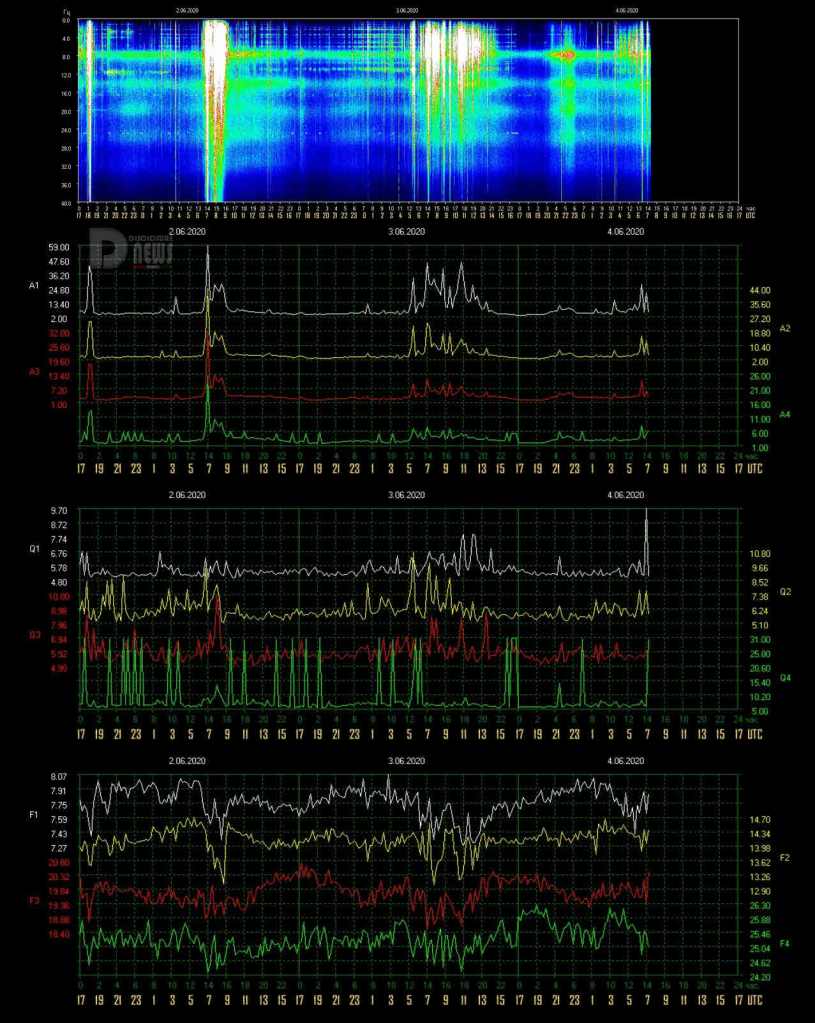
6/3 22:00 – Today’s activity lasted about 8 hours, from 5 to 13 UTC, a period during which the Frequency reached the minimum of 7.27 Hz and corresponded to the maximum Amplitude peak at Power 46 at 17:34 local time, i.e. 12:34 UTC. The situation then calmed down considerably.
6/2 17:00 – The activity previously reported remained limited in three hours, from 6:30 to 9:30 UTC, after the peak at Power 60 at 7 UTC there were other movements that had the maximum around Power 28. The minimum Frequency value occurred at 8:30 UTC with 7.34 Hz after which it returned to rise to stabilize, in the last hours, around 7.70 Hz.
6/2 08:00 – Today the activity started at 6 UTC with the Frequency that began a rapid drop, ongoing at the time of this update, passing 7.50 Hz at 7 UTC, the Amplitude began to rise shortly after the initial Frequency drop, at 6:30 UTC, to reach Power 60 at 7.
6/1 17:00 – Today’s activity can be divided into two parts, the first from 3 to 12 UTC with medium-sized peaks was followed by a break lasting about 4 hours, until 15 UTC when a rapid dip in the Frequency, that reached 7, 42 Hz, pushed the Amplitude up to Power 68, reached at 16:20 UTC. At the time of this update, the frequency is rising around 7.70 Hz.
6/1 10:00 – The new graphs show a period of calm from 16 to 23 UTC, during this period all parameters have remained on normal levels. From midnight UTC the frequency started a slow and constant drop along with wide fluctuations in the Quality, the Amplitude also started to move toward the Power 30 threshold at 4:30 UTC, the Frequency reached the minimum value of 7.25 Hz at 6 UTC in correspondence with the maximum amplitude reached so far at Power 36. After these movements the Frequency remained below 7.50 Hz and variations in both Quality and Amplitude continued, the latter remaining around Power 20.
5/31 17:00 – The day continued with activity that went down in intensity although the variations in Frequency were significant. After the two peaks previously reported, others followed around Power 20, they ended around 13 UTC when the Frequency also started to oscillate much less.
5/31 07:30 – At 22 UTC yesterday, without having a period of true calm in the previous hours, the Frequency had a rapid drop falling below 7.50 Hz, this led to two peaks in the Amplitude that first reached Power 32 at 23 UTC and then Power 30 at 00:30. The Quality has also undergone wide variations over the same period, all these movements have continued and had a new high at 4:30 UTC when Amplitude reached Power 74. Frequency has maintained the downward trend and consequently a new oscillation of the Amplitude reached Power 45 at 6:20 UTC. At the time of this update, movements in both Frequency and Quality continue.
5/30 17:00 – There is a pause in the activity but we cannot say that it is calm, even if there are no Amplitude movements, the Frequency is decreasing.
5/30 14:00 – Even today jagged activity, after the last peak at Power 51 of 19 UTC yesterday, the drop was sudden while the Frequency returned to the base value. The calm condition continued until 2 UTC when the Frequency started to move, from 4 UTC these movements became wider and led to an Amplitude peak to Power 31 at 5 UTC. The Frequency has continued to oscillate while the Amplitude has repeatedly touched Power 15. At the time of this update, the Frequency remains basically low but not on excessive values.
5/29 19:00 – Here is the activity we expected, the Frequency has further decreased below 7.50 Hz and the Amplitude oscillations have increased. Just after 17 UTC a first peak reached Power 34 followed less than an hour later by another strong increase to Power 46 at 18 UTC.
5/29 17:00 – We are still in a condition of low frequency therefore the activity, even if moderate, is continuing. After the peak at Power 63 other movements occurred around Power 30 with wide fluctuations in Quality. At the time of this update the Frequency has further decreased to 7.50 Hz so it is possible that we will see other activity.
5/29 14:30 – As we said earlier, the Frequency on low values can be indicative of further activity and in fact it was. As a continuation of the activity previously reported there were moderate variations in the Quality while the Frequency remained around 7.60 Hz, this led to movements in amplitude which eventually led to a peak at Power 63 at 12:30 UTC. The Frequency continued to remain at 7.60 Hz even after this movement, followed by a smaller one around Power 23 just before 14 UTC.
5/29 09:30 – Even today the new graphs show a slight activity that continues without reaching high values. At 6 UTC there was a dip in the Frequency which reached 7.42 Hz at 8 UTC, the response of the Amplitude, as often happens, was in agreement and at 8 UTC it reached the maximum value of Power 25. At the moment of this update the Frequency still remains basically low, we will see if this will be the signal of other activity.
5/28 17:00 – The slight activity shown in the graphs lasted about 8 hours, the most intense phase was from 7 to 9 UTC when there were large frequency fluctuations. From 13 UTC the situation has normalized even if the Frequency remains basically low.
5/28 12:00 – The calm period shown in the new graphs lasted about 18 hours, until 3 UTC this morning, when the Frequency started to oscillate with a gradual descent towards the minimum value of 7.33 Hz. The Amplitude also started oscillations reaching Power 21 shortly after 4 UTC and again at the same time as the minimum frequency peak at 8 UTC.
5/27 17:00 – Calm.
5/27 10:30 – After yesterday’s powerful activity, there were only 4 hours of calm, from 17 to 21 UTC. The movements that started then were however very light although steadily increasing. The Amplitude began to touch Power 10 from 3:30 UTC culminating with the maximum value so far of Power 23 reached at 7:30 UTC. Frequency remained basically stable slightly below the base value of 7.83 Hz.
5/26 17:00 – The movements seem to have calmed down, the descent towards the minimum values began at 14 UTC when the Frequency also started a jagged ascent; from 16 UTC the situation seems calm.
5/26 15:30 – Today’s activity, apart from the black hole, has so far been very powerful. To us, conspiracy theorists who don’t believe in coincidences, screeches a lot that during the peak phase there was this suspicious darkening where probably a more than significant value was reached; who cares, things do not change much in the end. Probably today the combination of Amplitude, Frequency and Quality would have brought the value of the ECC to touch the 500. The part after the hole, however, saw very wide oscillations that reached and exceeded Power 70 at 11:40 and at 13:15 UTC.
5/26 12:00 – After a temporary interruption of the data source site, the situation has partially returned to normal and what we see is massive activity! The first period of activity started at 2 UTC when the Amplitude started a steep climb which led to the strongest peak of this first phase of Power 67 at 3:30 UTC. This was followed by about 2 hours above Power 50. This first move ended at 5:30 UTC. At 7 UTC a new surge, constant and continuous, brought Amplitude to Power 72 at 8:20 UTC. This phase was interrupted by a BLACKOUT that started at 9 UTC and ended at 11:30 UTC, too bad, there were probably other very significant peaks … I don’t think we’ll ever know. At the moment of this update the Amplitude is still rising around Power 70.
5/26 09:00 – The TSU website is down, cannot be reached. While we wait to the site to return online we are going to use this temporary chart, it shows light activity that started little before 6 am UTC.
5/25 17:00 – Today has been a day in which there were no Amplitude movements that exceeded Power 11, this maximum was touched around midnight UTC, at 4 and at 13:30 UTC the Amplitude approached Power 10. The frequency, since few hours, is steadily and gradually decreasing, at the time of this update it is around 7.55 Hz and an isolated Amplitude movement is being generated that has reached Power 17.
5/24 17:00 – After the activity previously reported, the peak at Power 47 at 7 UTC followed by a minor movement that reached Power 24 at 8:30 UTC, the situation returned calm. This until 15 UTC when the Frequency has started to decrease until it reached 7.41 Hz at 16:30 UTC. This decrease can be seen in the main graph with the most intense coloring in the last hour. We will see if this decrease will lead to Amplitude’s movements or will be temporary.
5/24 08:00 – After about 18 hours of total calm, at 6:30 UTC today, suddenly, the frequency had a drop from 8.03 Hz to 7.47 in 40 minutes, this gave way to a strong variation of amplitude that at 7:30 UTC reached Power 47; we could paraphrase this event as a person who is trotting at short (Amplitude) and frequent (Frequency) steps who suddenly changes pace to a reduced frequency but with large strides (Amplitude).
5/23 17:00 – Even today we can say that it was not a real calm day, there were some short-lived isolated peaks, Power 17 shortly before 7 UTC and Power 12, lasting about an hour, from 10 to 11 UTC. Some wide fluctuations in Quality, without reaching high values, colored the main graph between 2 and 4 UTC. Frequency remained much of the time around the base value with a slight drop towards the end of the graph.
5/22 17:00 – An isolated peak, lasted about an hour, occurred from 15 to 16 UTC reaching a maximum value of Power 32 and coincided with a decrease in Frequency down to 7.54 Hz. It returned immediately afterwards towards values normal. Today, however, there has never been a real calm, various parameters have oscillated, the one that has had the most movements is the Frequency.
5/22 14:00 – Not much to report today, mainly there was no calm but not even significant activity, slight Amplitude fluctuations with a maximum at Power 10 at 7 UTC, calm in Quality apart from the first hours of the day and Frequency that oscillates around the base value.
5/21 20:00 – The scale of the Amplitude graph has changed and we clearly see that the maximum peak today was Power 50; the activity is continuing with more marked fluctuations also in Quality, the Amplitude has reached Power 21 at 19 UTC while the Frequency is in a phase of constant and gradual decline that has started many hours back, from the past midnight UTC, it has now reached the minimum value recorded today of 7.44 Hz.
5/21 17:00 – A more intense phase of activity began just before 16 UTC and in a few minutes brought the amplitude to today’s maximum peak of Power 51. With the new graphs we will be able to see more exactly how much it has reached given the very small scale of these of today. The frequency continues to remain low around 7.50 Hz.
5/21 15:50 – Moderate activity began at 13 UTC when the Frequency embarked on a slow descent to return, as previously, to 7.50 Hz. This set in motion the Amplitude that has risen above Power 20 from 13:30. UTC with a first Power 28 which was followed by another at 2. At the time of this update, the Frequency started a rapid rise with a consequent decrease in Amplitude.
5/21 09:30 – The new graphs show a situation of slight movements, in the Amplitude graph they are of little entity due to the very large scale, the two movements that are noticed have reached Power 15 at 4 UTC and Power 12 at 8 UTC. The Frequency oscillates around 7.70 Hz moving downward at the time of this update.
5/20 17:00 – The situation has calmed down considerably but the Frequency remains low, around 7.50 Hz.
5/20 13:00 – The first period of activity today lasted about 2 hours, from 4 to 6 UTC and the maximum value of Amplitude was Power 42; the second period also lasted about two hours, from 9:30 to 12 UTC and the maximum value was similar, Power 43. The difference between these two periods of movement is however remarkable in terms of graphic representation as also the other measurements of the Amplitude parameter have undergone strong increases, which have not happened previously, and therefore we see intense colors of yellow, red and green. At the time of this update, the situation seems to be moving towards calm.
5/20 08:30 – After the strong period of activity there was no calm, the amplitude did not undergo great variations but the Quality and even more the Frequency continued to oscillate without interruption. The Frequency at 4 UTC began a rapid drop towards 7.30 Hz, a value on which it remained for about 2 hours and which triggered a peak in Amplitude which reached Power 42 shortly before 5 UTC. The strong oscillations of Frequency are ongoing at the time of this update.
5/19 17:00 – The period of strong activity lasted about 12 hours, from 2 to 14 UTC when the frequency began to gradually rise towards the base levels but not yet reached at the time of this update.
5/19 14:00 – As we expected, given the frequency so low, just before 13 UTC there was a new powerful peak at Power 77 accompanied by the Quality on the rise. Frequency continues to remain at minimum values.
5/19 12:30 – The activity is gradually decreasing, at the time of this update we are around Power 30 but the Frequency remains always low around 7.30 Hz. As often happens the changes in Amplitude can be considered finished when the Frequency returns close to the base value , which hasn’t happened yet. Since the beginning of today’s activity, we have remained above Power 60 for 6 consecutive hours and during this period, from 6 to 7 UTC, the minimum has been Power 90. The Energy of Consciousness Current, for the statistics, reached 190; also on a statistical level on 27 February 2020 the Amplitude reached Power 170 and ECC 378 (due to the fact of a massive increase in the Frequency up to 8.79 Hz).
5/19 07:30 – Just before 7 UTC a new very strong peak was reached Power 110, the movements do not seem to decrease for now, the Frequency remains at minimum levels with very few oscillations.
5/19 06:30 – Very strong activity in progress, from 1 UTC the frequency started a dive that at 3 UTC brought it around 7.23 Hz, when it reached this minimum value, at 2:50 UTC, there was a strong fluctuation in Quality and Amplitude began to rise very quickly to reach two almost identical maximum values of Power 95 at 4 and 5 UTC. From 3:30 UTC we are constantly above Power 70 and at the time of this update we have surpassed Power 100 reaching 103.
5/18 17:00 – After the previous peaks the situation has calmed down considerably even if the Frequency has tended to be low with wide variations, we will see if this will be the reason for further movements or not.
5/18 13:00 – Even today the activity began shortly after 8 UTC when the Frequency started to decrease with a sharp drop to 7.23 Hz, today’s minimum; during this descent both Amplitude and Quality increased, the latter reaching 11.30 at 11 UTC. As for the Amplitude, the first movement reached the maximum value so far of Power 40 at 10 UTC, followed approximately one hour later by Power 36 and Power 23 at 12:30 UTC when the Frequency started a slight rise. At the time of this update the Frequency returned to minimum values so we might see more activity.
5/17 17:00 – Today’s activity, with a nice and flowing teardrop shape, lasted 5 hours, from 9 to 14 UTC; in the central and more intense part, from 10:30 to 12:30, the Amplitude remained constantly above Power 30 with the Frequency below 7.55 Hz. From 14 UTC with a rapid drop in Amplitude and a gradual increase in Frequency, but not towards the base value of 7.83 Hz but around 7.70 Hz, the activity has decreased considerably.
5/17 12:30 – After a period of calm that lasted about 18 hours at 7 UTC today, a marked decrease in the frequency began and gave the go to slight fluctuations in both Amplitude and Quality. These variations have taken on a much more marked characteristic from 9 UTC when the Frequency has approached the value of 7.40 Hz, since then it has been oscillations no more, the Amplitude has started a rapid increase exceeding Power 30 slightly after 10 UTC, Power 40 at 11:30 and Power 60 shortly before 12 when the Frequency has reached the minimum value of 7.40 Hz so far. This coincided with the peak of Power 69 reached at 11:40 UTC. If you have a cat you can observe his behavior in these moments.
5/16 17:00 – Another lively situation, after the peaks previously reported there was a further movement at 8 UTC that reached Power 46, after this the Frequency increased rapidly towards normal values and this marked the end of intense movements, there were only fluctuations left, mainly of Quality and Frequency around normal values.
5/16 07:30 – Even today we can say that the activity was almost continuous, the period with the least movements was from 21 to 23 UTC yesterday and from midnight the Frequency began to decrease and fluctuations in Amplitude began again. The Frequency stabilized between 7.30 and 7.40 Hz from 4 UTC and at the same time the Amplitude had its first surge at Power 39. A further drop in the Frequency to 7.38 Hz at 5:30 UTC gave the start at the second peak of Amplitude at Power 42 shortly after 6 with a further increase at Power 45 occurred at 7. At the time of this update the Frequency still remains low so it is likely that we will see other activity.
5/15 17:00 – Finally, the frequency returned to rise toward normal values and the activity seems to have ended, from 1 UTC until 16 there were 15 hours of ups and downs with the most intense part from 13 to 15:30 UTC, even if this period was not the one where the highest peak was recorded.
5/15 14:30 – Today seems to be a day of strong activity, after the peak at Power 78 there is only a slight drop in Amplitude but the profound fluctuations in Quality and Frequency continued which continued to decrease to today’s minimum of 7, 30 Hz; all this hinted that we would see other major changes in Amplitude soon. And so it was with Power 65 at 13:50 UTC. The Frequency is still at the minimum so we could see more movements.
5/15 11:30 – Yet another increase, Power 78 was achieved just before 11 UTC while the wide fluctuations in Frequency and Quality continue.
5/15 10:30 – With the Frequency remaining between 7.40 and 7.50 Hz, activity is continuing with wide fluctuations in Quality and Amplitude movements, a new peak at Power 42 occurred at 9:30 UTC and the movements continue. The Black Star is influencing Terra/Gaia.
5/15 09:00 – Even today the calm did not last long, the new charts show a peak at Power 35 at 17:30 UTC yesterday which was followed by a break of about 7 hours until 1 UTC today when a rapid drop in Frequency and a Amplitude leap that reached Power 72 at 2:30 UTC. Since then, the variations have continued even if of a lesser extent mainly linked to the wide fluctuations in Frequency and Quality. At the time of this update, the frequency is below 7.40 Hz.
5/14 17:00 – There was very little calm after the strong peak at Power 65 at 9 UTC this morning, the Frequency remained low for most of the time with a slight rise around 13 UTC but to immediately return to drop below 7.40 Hz, where it is swinging even at the time of this update. From 14:30 UTC started also slight movements of the Amplitude which reached Power 20 at 15:30.
5/14 10:00 – The increase that we expected happened, both in Amplitude, which reached Power 65 at 9:20 UTC, and in Quality which saw a further increase. The Frequency continues to remain very low, at 7.25 Hz and it is therefore likely that we will see further activity.
5/14 08:00 – The new graphs show an “unstable” situation, the Amplitude has remained at minimum values for most of the time after yesterday’s peak but the Quality has continued to fluctuate. The Frequency throughout this period has remained below the base value of 7.83 Hz and has started to decrease from 3 UTC, at the same time we also see the increase in the value of Quality and some slight movements in the Amplitude graph. From 6:30 UTC the activity took off with a first peak of Amplitude which reached Power 42 together with a maximum of Quality and the Frequency that fell below 7.30 Hz. Now we are at Power 45 and apparently rising.
5/13 17:00 – The four hours of activity of the UTC morning was the only movement of today’s graphs, Power 80 was however a very strong value and although short-lived, for about 20 minutes the Amplitude remained above Power 50. Note that the frequency, after these movements, did not return around the base value but has stabilized between 7.50 and 7.70 Hz while the quality has continued to oscillate, hence the coloring of the last part of the main graph.
5/13 11:00 – The maximum peak of this phase was at Power 80 reached at 10 UTC during a phase in which the Frequency started to rise again. This first phase of activity lasted 4 hours, from 7 to 11 UTC.
5/13 09:30 – The activity is continuing and the new amplitude maximum just reached has exceeded 40 reaching Power 43, the frequency continues to remain very low. On a statistical level we would like to show the graph that we used yesterday which today shows quite significant data, this to highlight that even if the data we normally use are collected in Russia the variations are on a planetary level.
5/13 09:00 – We finally found out that the problem was probably on the source website that was not updating the images, now the situation has returned to normal. The graphs show for May 12 a period of activity of about 8 hours, from 5 to 13 UTC, within which the remarkable peak of Power 52 was reached at 9, this corresponded to a peak in Quality and a minimum in Frequency. From 13 UTC an almost calm condition returned and lasted until today at 6 UTC when a series of rapid variations brought the Amplitude repeatedly above Power 30 with the maximum at Power 39 at 8:30 UTC. Also, for this activity there is a marked increase in Quality and a sudden drop in Frequency which has reached the minimum of the last few days at 7.27 Hz.
5/12 17:00 – It is difficult to make updates based on the data shown by these graphs, what can be said is that there are no relevant movements, we could say that the situation is calm. There are isolated peaks but these, due to the position of the detectors, are due to external factors and not proper to the Schumann Resonance. To return to normal data reports we will have to wait for the usual graphs to be updated. However, we will update the current chart which has temporarily replaced the usual one even if the cadence is much wider.
5/12 08:30 – The situation has not changed, the data is still missing and the graph is not updated, which is unusual, generally even if the data is not recorded the graph is updated, at least on the date. This time it’s not and it suggests that there are more serious problems … What we see above is, instead, an alternative data source located in Italy. The graph shows the electric field from 1 to 100 Hz, we prefer not to go into excessive explanations as higher technical knowledge is needed and we would create more questions than anything else, what is clear is that it does not seem we’re having much activity in progress in the last hours. The upper part of the image is today, the lower part is from the last days.
5/11 20:30 – Images are not being updated, we’re still stuck at the same from this morning UTC. One of the recent longest blackout was in October 2019 when it lasted more than 2 days, in 2020 there have been few, lasting generally less than a day.
5/11 17:00 – Blackout continues.
5/11 14:30 – Still in dark mode…
5/11 12:30 – The new graphs still show a calm condition even if in the last hours of the data received there have been some ripples in the Amplitude that has repeatedly reached Power 10, from 23 to 3 UTC. And at that the data transmission stopped, so it’s about 10 hours of blackout. It is also noted that from around midnight UTC the Frequency has constantly risen to high values. We will see when the data transmission will resume what the situation will be.
5/10 17:00 – The calm lasted for the whole extension of today’s graph, the only movement, excluding the previous one to Power 8 actually not very relevant, was at 14 UTC with Power 17. Nothing else to report for Quality and Frequency that remained on normal values.
5/10 08:00 – These are the images of a situation of calm, Amplitude and Quality at minimum and Frequency on the base value, we are approaching the 12 consecutive hours of flat calm.
5/09 17: 00 – Today’s moderate activity lasted about 10 hours, from 3 to 13 UTC. After the peak at Power 34 at 8 UTC another followed at 9:30 and reached Power 25 after which a slow descent began with movements around 15, normal values were reached at 13 UTC. The only parameter that has not yet returned to the base value is the Frequency which continues to tend to remain around 7.60 Hz.
5/09 08:30 – After almost two days of total calm, the activity returned to show itself at 4 UTC today with a first isolated peak that reached Power 19. This first movement was anticipated by a series of fluctuations in Quality and a gradual drop in Frequency started around 1 UTC. As these two parameters deviated from the normal values, the Amplitude also reacted and from 6 UTC it began a rapid increase that reached the maximum of Power 34 at 8 UTC.
5/08 17:00 – Total calm, all the values are back to normal.
5/08 14:00 – The almost total calm is continuing, very slight variations in Quality have given the main graph a green color from 6 UTC. The Frequency has dropped slightly to around 7.60 Hz from 9 UTC while the Amplitude has remained at minimum values.
5/08 07:00 – After several days of strong activity, in the graph of the last 3 days we can see a genera calm, apart from the 2 hours of strong activity yesterday. Today we see Power 10 at 1 UTC in a minimal movement with all the parameters on normal values.
5/07 17:00 – The peaks previously reported were followed by a period of 4 hours of calm until 8 UTC when the Frequency gradually began to decrease, this movement lasted until 14 UTC and was accompanied by a slight increase in both Quality and Amplitude, the latter reached the maximum value of Power 15 at 11. Now we are back to calm.
5/07 07:00 – Today the calm did not last long, shortly after midnight UTC a strong variation brought Amplitude to Power 50, for about 40 minutes it maintained this level reaching Power 53 just before 2 UTC when there was a new movement that generated the strongest peak so far of Power 66 at 2. Just reached this maximum there was a rapid descent that at 3 brought the Amplitude back to normal values. The Quality has always remained on normal values while the Frequency has followed the events starting the decrease at the same time as the Amplitude reaching the minimum of 7.38 at 2 UTC and then starting the ascent. At the time of this update, the Frequency has dropped back to around 7.50 Hz and there are very slight movements in the other parameters are noted.
5/06 17:00 – The calm that began yesterday at 13 UTC lasted until 14 UTC today when a momentary isolated peak reached Power 30, little movement even for the other parameters, Quality and Frequency. The duration of this movement was approximately 1 hour after which it has been calm.
5/05 17:00 – After the previously reported peak there was a sudden rise of the Frequency which in 2 hours, from 11 to 13 UTC, returned to normal values, in parallel both the Amplitude and the Quality also fell towards calm. From 14 we are in a calm condition.
5/05 13:00 – Today the activity began calmly, from 7 UTC there is a gradual drop in frequency which reached the minimum value of 7.28 hz at 11, at the same time when there was a peak in Quality at 8.70. The increase in the amplitude of the cycles has increased in parallel with the decrease in the Frequency and has also reached the maximum value so far of Power 45 at 11 UTC. This was followed by a slight drop but since the Frequency remains low it is likely that we will see other movements.
5/04 21:30 – We are now in a gradual descent, it is interesting to summarize the peaks reached during this phase (UTC times):
11 – Power 91
12 – Power 70
14 – Power 61
15 – Power 61
17 – Power 50
18 – Power 37
21 – Power 20
5/04 17:00 – From the beginning of today’s movements at 7 UTC, 10 hours ago, there has been no interruption, there have been two particularly intense periods, from 10 to 12 UTC when we have been constantly above Power 60, and from 14 to 16 UTC when the Amplitude has always remained above Power 50. Apart from a short period of time of about 30-40 minutes around 13 UTC, from 8 to 16, then 8 hours, we have been constantly above Power 37, quite impressive, do we understand the message from Terra/Gaia?
5/04 14:30 – The activity of the best days distinguishes today, after the very strong peak at Power 91, there has been a short break of about 45 minutes at Power 32 before the new increase in progress that is reaching Power 70 at the time of this update. While the Quality remains at minimum levels (and therefore the ECC is not at stratospheric values), the Frequency remains below the base value.
5/04 12:00 – The series of peaks in constant increase continues, after the 77 previously reported others followed in rapid succession exceeding 80 until reaching Power 91 shortly after 11 UTC. The graphs show strong fluctuations in Quality and Frequency as well.
5/04 10:30 – The script is repeating itself, 15 hours of total calm, from 15 UTC yesterday until 6 UTC today when abrupt changes in Quality and Frequency started which were followed by Amplitude movements that reached a first peak at 8 UTC up to Power 50. The Frequency continued to decrease to 7.32 Hz and this minimum further increased the maximum amplitude value bringing it to Power 77 at 10 UTC.
5/03 17:00 – Today’s activity lasted 11 hours, from 3 to 14 UTC when a last peak at Power 49 seems to have closed a strong sequence that has always been increasing. May seems to be a crucial month, we shall see if the Schumann Resonance will ‘resonate’ appropriately. The situation at the time of this update seems to have returned to calm even if the Frequency is not yet back at the base value, it is still quite low, so other slight movements may occur.
5/03 12:00 – Today so far it has been a continuous crescendo, after the last update we had a peak at Power 65 at 9 UTC, one at Power 72 at 10 and, like a clock, Power 80 at 11 UTC. At 11 o’clock there is a drop in Quality, part of the wide oscillations, and the Frequency which always remains at fairly low levels.
5/03 08:00 – Another increase, after the previous peak, a rapid and short drop before going back to Power 63 at 9 UTC. As before Quality in ever wider oscillations and low Frequency.
5/03 08:00 – As anticipated, the activity is continuing, it started at 3 UTC and with a slow and constant increase it reached the maximum value so far of Power 43 at 7:30 UTC. The oscillations of the Quality increased in intensity without however reaching high values while the frequency continued to decrease until it reached 7.32 Hz.
5/03 06:30 – Once again a period of calm, lasting about 15 hours, from 12 UTC yesterday to 3 this morning. All values measured during this period remained stable at basic levels. From 3 UTC there is a gradual increase in Amplitude which at the time of this update reached Power 20, this movement is accompanied by an equally increase in Quality and a less gradual decrease in Frequency which is going below 7.40 Hz. There is the feeling that the activity can continue to increase.
5/02 17:00 – Calm.
5/02 13:00 – We hope you like the constantly updated charts! Today’s situation, after the final part of the activity previously reported yesterday, shows a period of almost calm that started at 22 UTC yesterday and that lasted for about 10 hours until 8 UTC today. During this period, the Amplitude and the Frequency remained on normal values while the Quality had a variation between 3 and 4 UTC. The first isolated peak of Amplitude at 8 UTC reached Power 20, the second, still isolated, reached Power 18 at 8 UTC and the last, isolated as well, reached Power 41 at 11:40 UTC. While these peaks occurred, the Frequency, as it almost always happens, has had wide oscillations towards lower values, but not too low.
5/01 23:00 – Today we worked hard to make the way that the main chart is updated independently of these textual updates, the work is not yet finished but I think it was worth it already! As for the situation, we see that from 15 to 19 UTC the activity was powerful with 3 major peaks at Power 58, 47 and 30. A further isolated peak reached Power 34 at 21:30 UTC. There have also been wide fluctuations in Quality, indicating that the “message” has not always been the same while the Frequency has had a sharp drop between 17 and 19 UTC.
5/01 17:00 – Even today, little or no calm, after the movements described previously we had an isolated peak that reached Power 44 shortly before 12 UTC. In the following 3 hours there were fluctuations in Quality and Frequency but the Amplitude remained at normal values. From 15, however, a rapid drop in Frequency began and once again an increase in Amplitude which in one hour, at 16 UTC, reached today’s maximum at Power 58. Frequency is still very low at the time of this update so it is possible that the activity continues.
5/01 08:30 – There was the impression that the activity would have continued and it did. Resuming from the last update, where we highlighted the frequency that remained high, it remained so, with the Amplitude on normal values, until 2 UTC when a rapid drop began. At the same time, the Amplitude gradually started to rise to reach the maximum at Power 58 just before 7 UTC. This peak was followed by a new drop towards Power 20 and with an increase in frequency.
Frequency means how many wave cycle happen in a second, 1 Hz. means 1 cycle per second, 40 Hz. means 40 cycles per second, Amplitude is the size of the vibration, how big is the wave, the chart shows the frequency variation in Hz and the amplitude using the white color.
Note
The Ancient Indian Rishis called 7.83 Hz the frequency of OM. It also happens to be Mother Earth’s natural heartbeat rhythm Schumann resonances are named after professor Schumann who was involved in early German secret space program and was later paper-clipped into the United States. The frequencies of Schumann resonances are fairly stable and are mainly defined by the physical size of the ionospheric cavity. The amplitude of Schumann resonances does change and is bigger when ionospheric plasma gets excited. Ionospheric plasma excitation happens because of solar activity, thunderstorms, use of scalar plasma weapons and HAARP and lately also when the Light forces are clearing the plasma anomaly.
Schumann Resonance Today – Energy of Consciousness Currents
All the SR daily images in one single page See the Images
Explanation of The Chart
The Schumann Resonance Spectrogram Chart
The Schumann Resonance Chart displays data from the magnetic field detector to monitor the resonances occurring in the plasma waves constantly circling the earth in the ionosphere. These three days spectrograms show the activity occurring at the various resonant frequencies from 1 to 40 Hz. Within the spectrogram, the power, or intensity level of each frequency is displayed as a color, with white being the most intense. The Schumann Resonances appear as the horizontal lines at 0.0, 4.0, 8.0, 12.0, 16.0, 20.0, 24.0, 28.0, 32.0, 36.0 & 40.0 Hz. This chart is based on Tomsk, Russia, time UTC +7 (UTC = Universal Time Coordinated).
What is a Spectrogram?
The Spectrogram Calendar is a visual representation of the range of frequencies in the magnetic field at a given location. Similar to how an equalizer displays the frequency content of music played on your stereo, the spectrogram calendar displays the frequency content of a magnetic field. Instead of showing a brief snapshot, it shows changes over a period of time, in this case 3 days.
The local magnetic field is a dynamic field that changes constantly because of variations in the ionosphere and sun and many other influences not yet fully understood. The range of variation displayed in the spectrogram chart is from 0 to 40 cycles per second. The vertical axis is frequency and the horizontal axis is time. The amplitude of a particular frequency at a specific time is represented by the intensity of color (green, yellow, white) of each point in the image.
With over 1 million downloads, the Remove China Apps application developed by Jaipur-based startup OneTouchAppLabs has become the top free app on Google Play Store in just 10 days. As the name suggests, the app allows users to delete all applications developed in China. It scans the user’s phone and lists the apps developed in China. After this, the user can decide which app to keep and which to remove. Satyajit Sinha, cyber security researcher at Counterpoint, explains that the Remove China Apps app just identifies the app developer’s country of origin by comparing it with the repository database of apps developed in China. Sinha says the app is safe to use and one shouldn’t worry about downloading it on their Android smartphone. “The app scan focused on the installed android application package (APK) only. Hence, it doesn’t affect any change in stored personal data.”
China has unveiled a package of special policies for Hainan, including scrapping import duties, in an effort to turn the tropical island into the mainland’s answer to Hong Kong or Singapore and dampen the risk of decoupling with the United States. Beijing on Monday outlined its plan to make the 35,000 sq km island a “free trade port” by lowering the income tax rate for selected individuals and companies to 15 per cent, and relaxing visa requirements for tourists and business travellers. The island province of 9.5 million people will also enjoy freedoms in terms of trade, investment, capital flows and the movement of people and data by 2035, as it moves toward becoming a hub of “strong international influence” by the middle of the century. The project to make Hainan, which covers an area 30 times that of Hong Kong, into a regional trade, shopping and shipping centre has been “planned, arranged and promoted by General Secretary Xi Jinping personally”, according to the government statement.
Frustrated Civil Rights Leaders Say Mark Zuckerberg ‘Lacks The Ability To Understand’ Race Issues. Now, the Facebook CEO is taking heat from civil rights leaders after spending nearly an hour on the phone to discuss ‘ongoing issues around his company’s policies as they relate to race, elections and other topics,’ according to Bloomberg, who said that participants were left disappointed. Rashad Robinson, president of civil rights group Color of Change, told the outlet that Zuckerberg is clueless when it comes to racial issues. In an interview with Bloomberg News immediately after the call, Robinson said that “the problem with my ongoing conversations with Mark, is that I feel like I spent a lot of time, and my colleagues spent a lot of time, explaining to him why these things are a problem, and I think he just very much lacks the ability to understand it.” “His employees are outraged,” said Robinson. “I’ve got outreach from some of them. Saying Black Lives Matter, saying I’m going to give money, but having your policies actually hurt black people, people will know the difference.” Some of the company’s senior staff have taken to Twitter to make their discontent public.
Between low demand, soaring inventories, depressed prices, a global pandemic, and now, hurricane season, it seems a perfect storm is forming around the offshore oil industry. The world’s offshore oil market, responsible for 30 percent of all the world’s oil production, is facing an impossible set of challenges. The crisis has pushed much of the world’s oil production onshore in favor of more flexible rigs and lower operational costs. Many new offshore projects have even been put on hold as the new reality of the oil market sets in. Companies are now scrambling to suspend federal lease deadlines as the near-term looks increasingly uncertain. The industry’s growing troubles come just as Royal Dutch Shell was forced to airlift a number of coronavirus-infected employees from one of its offshore platforms, highlighting the risks associated with confining workers on offshore rigs during a pandemic. And Shell isn’t the only company grappling with outbreaks. In recent weeks, hundreds of workers at offshore rigs in the Gulf of Mexico, the North Sea, Mozambique, Canada, and Kazakhstan have been infected with COVID-19. The outbreaks add to the growing list of trials and tribulations the offshore industry is grappling with.
Nine people sent to police custody after they were caught gambling in Kathmandu hotel. “Majority of the arrestees are business persons,” said DSP Raj Kumar KC, spokesperson for the Kathmandu Metropolitan Police Range. A police team had arrested the group on Monday evening from Gangaur Regency Boutique Hotel in Kamaladi. “Police have confiscated Rs 277,000 cash and 171 gambling chips from the suspects,” said KC. “The majority of complaints related to gambling are received either from the family members or acquaintances of the gamblers,” said SSP Sushil Kumar Yadav, spokesperson for the Metropolitan Police Office, Ranipokhari. “The money seized by police from the gamblers goes to the government’s funds.”
A bird may have caused a plane from an elite Canadian air force aerobatics team to crash, resulting in the death of one team member and injury to another, the defense department said Monday. The aircraft — part of the team known as the Snowbirds — crashed into the front yard of a house in British Columbia shortly after taking off from Kamloops Airport late morning on May 18. In a preliminary report, the Department of National Defence’s Airworthiness Investigative Authority said it had obtained video footage that revealed “one bird in very close proximity to the aircraft right engine intake during the critical post take-off phase.
Twitter said it is “actively investigating” the #dcblackout hashtag after online accounts pushed false and misleading tweets during a night of unrest in Washington over the death in police custody of George Floyd. Twitter said it has “suspended hundreds of spammy accounts” under its platform manipulation policy. A spokesman for the company also said, “We’re taking action proactively on any coordinated attempts to disrupt the public conversation around this issue.” Many of the accounts tweeted about a supposed communication blackout that occurred between 1:00 and 6:00 am. However, Alaina Gertz, spokeswoman for the Metropolitan Police Department said, “This appears to be misinformation. We have no confirmation of a cellphone blackout.” Other tweets shared an image of a major fire next to the Washington Monument, but a reverse image search revealed that the picture was a scene from the American television program “Designated Survivor” which was set in Washington.
Emergency workers were searching for seven people still missing Monday as El Salvador and its Central American neighbors picked through the destruction after the first named Pacific storm of the year left at least 18 people dead. Rescue teams were trying to locate the missing in floodwaters caused by torrential rain and high winds after Storm Amanda swept in from the Pacific on Sunday, El Salvador’s Interior Minister Mario Duran said. “We have 15 people dead and seven missing,” Duran told reporters. Some 7,225 people were evacuated from high-risk areas, soldiers and civil protection workers transferring them to 154 shelters set up throughout the country. The environment ministry said the rains had left up to 500 millimeters of water, almost a third of the yearly average of 1,800 mm. Many areas were left without power or drinking water and vulnerable to landslides.
Ten Colima state police officers went missing after escorting a group of businessmen to the municipality of La Huerta in the neighboring state of Jalisco, Mexico. Authorities in Colima on Monday found a vehicle containing the dismembered remains of seven bodies believed to be those of a group of officers who disappeared in neighboring Jalisco last week. Ten Colima state police officers were ambushed and kidnapped in Jalisco on Thursday after escorting a group of mining executives to the municipality of La Huerta. The bodies were found in a white Chrysler Pacifica near a soccer field in the community of Cedros, north of Manzanillo, the capital of Colima, after police received a 911 call about an abandoned vehicle with a strong odor coming from it.
Archeologists have now found a skeleton in the suspected Viking-era tomb a Norwegian couple discovered last week under their house — but the bones have been broken into pieces. Mariann Kristiansen from Seivåg near Bodø was pulling up the floor of her house with her husband to install insulation last week when they couple found a glass bead, and then a Viking axe. “We have found several bones, and bones from a human,” archaeologist Jørn Erik Henriksen from Tromsø University told Norway’s state TV station NRK. “We do not know when the grave was given this treatment, but everything indicates that it must have happened long before the house was built in 1914.”
Fahrudin Radoncic, Bosnia and Herzegovina’s Minister of Security who has taken a tough line on deporting illegal migrants, announced his resignation today, at a meeting of Bosnia’s Council of Ministers today. He cited “political differences on strategic issues” with his colleagues in the government, including in relation to his intended deportations of migrants, as one reason for his departure, according to a report by Balkan Insight. Radoncic had announced in April that he intended to deport all of the approximately 10,000 illegal migrants Bosnia is currently hosting in its camps, apart from actual Syrian war refugees, as previously reported by Voice of Europe. He declared that his country would not be “a parking lot of migrants for Europe.” Migrants end up in Bosnia as they follow the Balkan migration route from the European countries along the Mediterranean, where they cross illegally from Africa and Turkey. They end up in camps along the Croatian border, looking to eventually be able to find a way to cross it and thus end up in the European Union, where they hope to make their way to richer pickings in the nations of northwestern Europe. Radoncic had accused Pakistan’s ambassador of blocking efforts to establish the identities of Pakistani migrants in Bosnia, which is a necessary part of the deportation procedures. He had even threatened to declare the ambassador “persona non grata” if he did not cooperate more fully. “I think that Radoncic did his job extremely well and bravely,” said Vjekoslav Bevanda, the country’s Minister of Finance. “He was one of the few people who adhered to principles.”
Wildlife authorities in Botswana have reported at least 110 mysterious elephant deaths in the northwest part of the country – a jump from the 56 carcasses discovered as of an earlier announcement in May. However, anthrax and poisoning were recently ruled out as causes behind the animals’ deaths. “I would say 90% of the new cases we have found are old carcasses we previously did not locate,” Dimakatso Ntshebe, a regional wildlife director, said in a recent interview with Bloomberg. “However, a few are indeed new deaths. All recovered carcasses do not show signs of poaching.” Last year, Botswana President Mokgweetsi Masisi lifted a hunting ban to prevent the 135,000 elephants in the country from damaging crops and sometimes trampling residents. Carcass samples are also being sent to a laboratory in Zimbabwe to determine the cause of the deaths. However, the COVID-19 pandemic could cause delays in receiving testing results. Ntshebe also warned that more elephant deaths could occur. “We are still experiencing elephants dying in the Okavango Panhandle,” the wildlife official said, also noting that tusks have been removed from the dead elephants. “We have started removing the tusks in the dead elephants, and we have started burning the carcasses,” Ntshebe said, reported Big News Network.”We have started with those [carcasses], which are close to the villages, and those that are lying in the water. The idea is to burn as many carcasses as possible. However, we have a challenge since some of the carcasses are in areas which are difficult to reach.” The majority of the world’s African elephants live in Southern Africa, where Botswana is located.
Sun Activity
All space weather is calm but there is Another active region cresting into view over the limb of the Sun. We are monitoring it for larger flares and CMEs. Video Player
Cyclonic Storm Nisarga, Arabian Sea off the Coast of Mumbai, India – Moving N 7 kts – w/v 40 kts 998 hPa Intensifying.
Strongest EQ in Europe M4.1 Romania Strongest EQ in North America M3.9 Nelson Lagoon, Alaska Strongest EQ on the Planet M5.0 South sandwich Islands Deepest EQ M4.3 497 km Tonga News Burst 2 June 2020
Share this: Send the word out using these buttons!
Editor’s Note: Those energies just keep on comin’! On June 2, we see intense and high amplitude energies appearing from 1am through 4am when the Schumann Resonance energies dissipate.
Yet, other energies are also at play which may be a bit beyond being detected by our current tracking systems. Stay aware in these uncertain times, stay focused on your environment, stay safe and then BE in…
Schumann Resonance Today. We will try to keep you updated about the variations of the Resonance with this page. The great variations that nobody can explain but that give us a clear sign that the planet is changing. The Earth is vibration higher and higher, just like us!
The Chart time is based on Tomsk – Russia – UTC (Universal Time Coordinated) +7 –Source
SR Base Frequency 7.83 Hz. – Schumann Resonance Today’s Peaks
60
Amplitude
6.90
Quality
8.02
Frequency Max
7.34
Frequency Min
44
Ampltude A2
34
Ampltude A3
27
Ampltude A4
“Every second, a multitude of pulses travel around the world in this unique, resonant chamber between Earth and the ionosphere, sending colluding signals to all microorganisms. These signals couple us to the Earth’s magnetic field. Named after their discoverer, these Schumann Resonances (SR) drive the harmonizing pulse for life in our world.” Eric Thompson
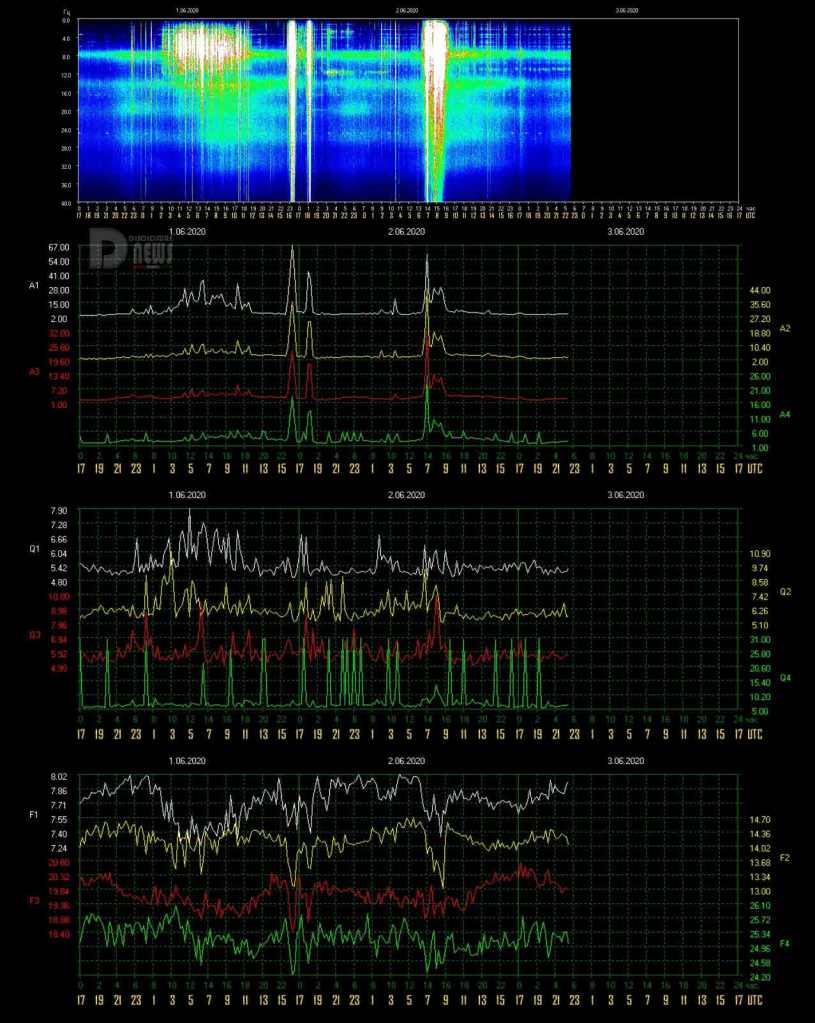
6/2 17:00 – The activity previously reported remained limited in three hours, from 6:30 to 9:30 UTC, after the peak at Power 60 at 7 UTC there were other movements that had the maximum around Power 28. The minimum Frequency value occurred at 8:30 UTC with 7.34 Hz after which it returned to rise to stabilize, in the last hours, around 7.70 Hz.
6/2 08:00 – Today the activity started at 6 UTC with the Frequency that began a rapid drop, ongoing at the time of this update, passing 7.50 Hz at 7 UTC, the Amplitude began to rise shortly after the initial Frequency drop, at 6:30 UTC, to reach Power 60 at 7.
6/1 17:00 – Today’s activity can be divided into two parts, the first from 3 to 12 UTC with medium-sized peaks was followed by a break lasting about 4 hours, until 15 UTC when a rapid dip in the Frequency, that reached 7, 42 Hz, pushed the Amplitude up to Power 68, reached at 16:20 UTC. At the time of this update, the frequency is rising around 7.70 Hz.
6/1 10:00 – The new graphs show a period of calm from 16 to 23 UTC, during this period all parameters have remained on normal levels. From midnight UTC the frequency started a slow and constant drop along with wide fluctuations in the Quality, the Amplitude also started to move toward the Power 30 threshold at 4:30 UTC, the Frequency reached the minimum value of 7.25 Hz at 6 UTC in correspondence with the maximum amplitude reached so far at Power 36. After these movements the Frequency remained below 7.50 Hz and variations in both Quality and Amplitude continued, the latter remaining around Power 20.
5/31 17:00 – The day continued with activity that went down in intensity although the variations in Frequency were significant. After the two peaks previously reported, others followed around Power 20, they ended around 13 UTC when the Frequency also started to oscillate much less.
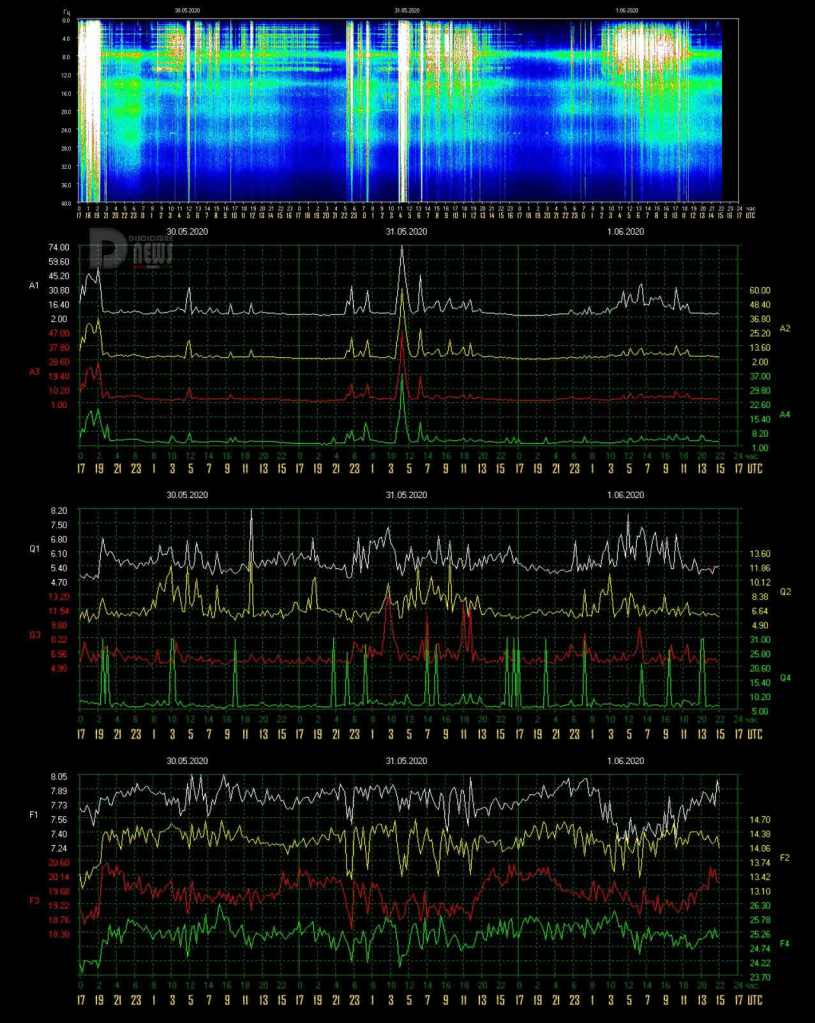
5/31 07:30 – At 22 UTC yesterday, without having a period of true calm in the previous hours, the Frequency had a rapid drop falling below 7.50 Hz, this led to two peaks in the Amplitude that first reached Power 32 at 23 UTC and then Power 30 at 00:30. The Quality has also undergone wide variations over the same period, all these movements have continued and had a new high at 4:30 UTC when Amplitude reached Power 74. Frequency has maintained the downward trend and consequently a new oscillation of the Amplitude reached Power 45 at 6:20 UTC. At the time of this update, movements in both Frequency and Quality continue.
5/30 17:00 – There is a pause in the activity but we cannot say that it is calm, even if there are no Amplitude movements, the Frequency is decreasing.
5/30 14:00 – Even today jagged activity, after the last peak at Power 51 of 19 UTC yesterday, the drop was sudden while the Frequency returned to the base value. The calm condition continued until 2 UTC when the Frequency started to move, from 4 UTC these movements became wider and led to an Amplitude peak to Power 31 at 5 UTC. The Frequency has continued to oscillate while the Amplitude has repeatedly touched Power 15. At the time of this update, the Frequency remains basically low but not on excessive values.
5/29 19:00 – Here is the activity we expected, the Frequency has further decreased below 7.50 Hz and the Amplitude oscillations have increased. Just after 17 UTC a first peak reached Power 34 followed less than an hour later by another strong increase to Power 46 at 18 UTC.
5/29 17:00 – We are still in a condition of low frequency therefore the activity, even if moderate, is continuing. After the peak at Power 63 other movements occurred around Power 30 with wide fluctuations in Quality. At the time of this update the Frequency has further decreased to 7.50 Hz so it is possible that we will see other activity.
5/29 14:30 – As we said earlier, the Frequency on low values can be indicative of further activity and in fact it was. As a continuation of the activity previously reported there were moderate variations in the Quality while the Frequency remained around 7.60 Hz, this led to movements in amplitude which eventually led to a peak at Power 63 at 12:30 UTC. The Frequency continued to remain at 7.60 Hz even after this movement, followed by a smaller one around Power 23 just before 14 UTC.
5/29 09:30 – Even today the new graphs show a slight activity that continues without reaching high values. At 6 UTC there was a dip in the Frequency which reached 7.42 Hz at 8 UTC, the response of the Amplitude, as often happens, was in agreement and at 8 UTC it reached the maximum value of Power 25. At the moment of this update the Frequency still remains basically low, we will see if this will be the signal of other activity.
5/28 17:00 – The slight activity shown in the graphs lasted about 8 hours, the most intense phase was from 7 to 9 UTC when there were large frequency fluctuations. From 13 UTC the situation has normalized even if the Frequency remains basically low.
5/28 12:00 – The calm period shown in the new graphs lasted about 18 hours, until 3 UTC this morning, when the Frequency started to oscillate with a gradual descent towards the minimum value of 7.33 Hz. The Amplitude also started oscillations reaching Power 21 shortly after 4 UTC and again at the same time as the minimum frequency peak at 8 UTC.
5/27 17:00 – Calm.
5/27 10:30 – After yesterday’s powerful activity, there were only 4 hours of calm, from 17 to 21 UTC. The movements that started then were however very light although steadily increasing. The Amplitude began to touch Power 10 from 3:30 UTC culminating with the maximum value so far of Power 23 reached at 7:30 UTC. Frequency remained basically stable slightly below the base value of 7.83 Hz.
5/26 17:00 – The movements seem to have calmed down, the descent towards the minimum values began at 14 UTC when the Frequency also started a jagged ascent; from 16 UTC the situation seems calm.
5/26 15:30 – Today’s activity, apart from the black hole, has so far been very powerful. To us, conspiracy theorists who don’t believe in coincidences, screeches a lot that during the peak phase there was this suspicious darkening where probably a more than significant value was reached; who cares, things do not change much in the end. Probably today the combination of Amplitude, Frequency and Quality would have brought the value of the ECC to touch the 500. The part after the hole, however, saw very wide oscillations that reached and exceeded Power 70 at 11:40 and at 13:15 UTC.
5/26 12:00 – After a temporary interruption of the data source site, the situation has partially returned to normal and what we see is massive activity! The first period of activity started at 2 UTC when the Amplitude started a steep climb which led to the strongest peak of this first phase of Power 67 at 3:30 UTC. This was followed by about 2 hours above Power 50. This first move ended at 5:30 UTC. At 7 UTC a new surge, constant and continuous, brought Amplitude to Power 72 at 8:20 UTC. This phase was interrupted by a BLACKOUT that started at 9 UTC and ended at 11:30 UTC, too bad, there were probably other very significant peaks … I don’t think we’ll ever know. At the moment of this update the Amplitude is still rising around Power 70.
5/26 09:00 – The TSU website is down, cannot be reached. While we wait to the site to return online we are going to use this temporary chart, it shows light activity that started little before 6 am UTC.
5/25 17:00 – Today has been a day in which there were no Amplitude movements that exceeded Power 11, this maximum was touched around midnight UTC, at 4 and at 13:30 UTC the Amplitude approached Power 10. The frequency, since few hours, is steadily and gradually decreasing, at the time of this update it is around 7.55 Hz and an isolated Amplitude movement is being generated that has reached Power 17.
5/24 17:00 – After the activity previously reported, the peak at Power 47 at 7 UTC followed by a minor movement that reached Power 24 at 8:30 UTC, the situation returned calm. This until 15 UTC when the Frequency has started to decrease until it reached 7.41 Hz at 16:30 UTC. This decrease can be seen in the main graph with the most intense coloring in the last hour. We will see if this decrease will lead to Amplitude’s movements or will be temporary.
5/24 08:00 – After about 18 hours of total calm, at 6:30 UTC today, suddenly, the frequency had a drop from 8.03 Hz to 7.47 in 40 minutes, this gave way to a strong variation of amplitude that at 7:30 UTC reached Power 47; we could paraphrase this event as a person who is trotting at short (Amplitude) and frequent (Frequency) steps who suddenly changes pace to a reduced frequency but with large strides (Amplitude).
5/23 17:00 – Even today we can say that it was not a real calm day, there were some short-lived isolated peaks, Power 17 shortly before 7 UTC and Power 12, lasting about an hour, from 10 to 11 UTC. Some wide fluctuations in Quality, without reaching high values, colored the main graph between 2 and 4 UTC. Frequency remained much of the time around the base value with a slight drop towards the end of the graph.
5/22 17:00 – An isolated peak, lasted about an hour, occurred from 15 to 16 UTC reaching a maximum value of Power 32 and coincided with a decrease in Frequency down to 7.54 Hz. It returned immediately afterwards towards values normal. Today, however, there has never been a real calm, various parameters have oscillated, the one that has had the most movements is the Frequency.
5/22 14:00 – Not much to report today, mainly there was no calm but not even significant activity, slight Amplitude fluctuations with a maximum at Power 10 at 7 UTC, calm in Quality apart from the first hours of the day and Frequency that oscillates around the base value.
5/21 20:00 – The scale of the Amplitude graph has changed and we clearly see that the maximum peak today was Power 50; the activity is continuing with more marked fluctuations also in Quality, the Amplitude has reached Power 21 at 19 UTC while the Frequency is in a phase of constant and gradual decline that has started many hours back, from the past midnight UTC, it has now reached the minimum value recorded today of 7.44 Hz.
5/21 17:00 – A more intense phase of activity began just before 16 UTC and in a few minutes brought the amplitude to today’s maximum peak of Power 51. With the new graphs we will be able to see more exactly how much it has reached given the very small scale of these of today. The frequency continues to remain low around 7.50 Hz.
5/21 15:50 – Moderate activity began at 13 UTC when the Frequency embarked on a slow descent to return, as previously, to 7.50 Hz. This set in motion the Amplitude that has risen above Power 20 from 13:30. UTC with a first Power 28 which was followed by another at 2. At the time of this update, the Frequency started a rapid rise with a consequent decrease in Amplitude.
5/21 09:30 – The new graphs show a situation of slight movements, in the Amplitude graph they are of little entity due to the very large scale, the two movements that are noticed have reached Power 15 at 4 UTC and Power 12 at 8 UTC. The Frequency oscillates around 7.70 Hz moving downward at the time of this update.
5/20 17:00 – The situation has calmed down considerably but the Frequency remains low, around 7.50 Hz.
5/20 13:00 – The first period of activity today lasted about 2 hours, from 4 to 6 UTC and the maximum value of Amplitude was Power 42; the second period also lasted about two hours, from 9:30 to 12 UTC and the maximum value was similar, Power 43. The difference between these two periods of movement is however remarkable in terms of graphic representation as also the other measurements of the Amplitude parameter have undergone strong increases, which have not happened previously, and therefore we see intense colors of yellow, red and green. At the time of this update, the situation seems to be moving towards calm.
5/20 08:30 – After the strong period of activity there was no calm, the amplitude did not undergo great variations but the Quality and even more the Frequency continued to oscillate without interruption. The Frequency at 4 UTC began a rapid drop towards 7.30 Hz, a value on which it remained for about 2 hours and which triggered a peak in Amplitude which reached Power 42 shortly before 5 UTC. The strong oscillations of Frequency are ongoing at the time of this update.
5/19 17:00 – The period of strong activity lasted about 12 hours, from 2 to 14 UTC when the frequency began to gradually rise towards the base levels but not yet reached at the time of this update.
5/19 14:00 – As we expected, given the frequency so low, just before 13 UTC there was a new powerful peak at Power 77 accompanied by the Quality on the rise. Frequency continues to remain at minimum values.
5/19 12:30 – The activity is gradually decreasing, at the time of this update we are around Power 30 but the Frequency remains always low around 7.30 Hz. As often happens the changes in Amplitude can be considered finished when the Frequency returns close to the base value , which hasn’t happened yet. Since the beginning of today’s activity, we have remained above Power 60 for 6 consecutive hours and during this period, from 6 to 7 UTC, the minimum has been Power 90. The Energy of Consciousness Current, for the statistics, reached 190; also on a statistical level on 27 February 2020 the Amplitude reached Power 170 and ECC 378 (due to the fact of a massive increase in the Frequency up to 8.79 Hz).
5/19 07:30 – Just before 7 UTC a new very strong peak was reached Power 110, the movements do not seem to decrease for now, the Frequency remains at minimum levels with very few oscillations.
5/19 06:30 – Very strong activity in progress, from 1 UTC the frequency started a dive that at 3 UTC brought it around 7.23 Hz, when it reached this minimum value, at 2:50 UTC, there was a strong fluctuation in Quality and Amplitude began to rise very quickly to reach two almost identical maximum values of Power 95 at 4 and 5 UTC. From 3:30 UTC we are constantly above Power 70 and at the time of this update we have surpassed Power 100 reaching 103.
5/18 17:00 – After the previous peaks the situation has calmed down considerably even if the Frequency has tended to be low with wide variations, we will see if this will be the reason for further movements or not.
5/18 13:00 – Even today the activity began shortly after 8 UTC when the Frequency started to decrease with a sharp drop to 7.23 Hz, today’s minimum; during this descent both Amplitude and Quality increased, the latter reaching 11.30 at 11 UTC. As for the Amplitude, the first movement reached the maximum value so far of Power 40 at 10 UTC, followed approximately one hour later by Power 36 and Power 23 at 12:30 UTC when the Frequency started a slight rise. At the time of this update the Frequency returned to minimum values so we might see more activity.
5/17 17:00 – Today’s activity, with a nice and flowing teardrop shape, lasted 5 hours, from 9 to 14 UTC; in the central and more intense part, from 10:30 to 12:30, the Amplitude remained constantly above Power 30 with the Frequency below 7.55 Hz. From 14 UTC with a rapid drop in Amplitude and a gradual increase in Frequency, but not towards the base value of 7.83 Hz but around 7.70 Hz, the activity has decreased considerably.
5/17 12:30 – After a period of calm that lasted about 18 hours at 7 UTC today, a marked decrease in the frequency began and gave the go to slight fluctuations in both Amplitude and Quality. These variations have taken on a much more marked characteristic from 9 UTC when the Frequency has approached the value of 7.40 Hz, since then it has been oscillations no more, the Amplitude has started a rapid increase exceeding Power 30 slightly after 10 UTC, Power 40 at 11:30 and Power 60 shortly before 12 when the Frequency has reached the minimum value of 7.40 Hz so far. This coincided with the peak of Power 69 reached at 11:40 UTC. If you have a cat you can observe his behavior in these moments.
5/16 17:00 – Another lively situation, after the peaks previously reported there was a further movement at 8 UTC that reached Power 46, after this the Frequency increased rapidly towards normal values and this marked the end of intense movements, there were only fluctuations left, mainly of Quality and Frequency around normal values.
5/16 07:30 – Even today we can say that the activity was almost continuous, the period with the least movements was from 21 to 23 UTC yesterday and from midnight the Frequency began to decrease and fluctuations in Amplitude began again. The Frequency stabilized between 7.30 and 7.40 Hz from 4 UTC and at the same time the Amplitude had its first surge at Power 39. A further drop in the Frequency to 7.38 Hz at 5:30 UTC gave the start at the second peak of Amplitude at Power 42 shortly after 6 with a further increase at Power 45 occurred at 7. At the time of this update the Frequency still remains low so it is likely that we will see other activity.
5/15 17:00 – Finally, the frequency returned to rise toward normal values and the activity seems to have ended, from 1 UTC until 16 there were 15 hours of ups and downs with the most intense part from 13 to 15:30 UTC, even if this period was not the one where the highest peak was recorded.
5/15 14:30 – Today seems to be a day of strong activity, after the peak at Power 78 there is only a slight drop in Amplitude but the profound fluctuations in Quality and Frequency continued which continued to decrease to today’s minimum of 7, 30 Hz; all this hinted that we would see other major changes in Amplitude soon. And so it was with Power 65 at 13:50 UTC. The Frequency is still at the minimum so we could see more movements.
5/15 11:30 – Yet another increase, Power 78 was achieved just before 11 UTC while the wide fluctuations in Frequency and Quality continue.
5/15 10:30 – With the Frequency remaining between 7.40 and 7.50 Hz, activity is continuing with wide fluctuations in Quality and Amplitude movements, a new peak at Power 42 occurred at 9:30 UTC and the movements continue. The Black Star is influencing Terra/Gaia.
5/15 09:00 – Even today the calm did not last long, the new charts show a peak at Power 35 at 17:30 UTC yesterday which was followed by a break of about 7 hours until 1 UTC today when a rapid drop in Frequency and a Amplitude leap that reached Power 72 at 2:30 UTC. Since then, the variations have continued even if of a lesser extent mainly linked to the wide fluctuations in Frequency and Quality. At the time of this update, the frequency is below 7.40 Hz.
5/14 17:00 – There was very little calm after the strong peak at Power 65 at 9 UTC this morning, the Frequency remained low for most of the time with a slight rise around 13 UTC but to immediately return to drop below 7.40 Hz, where it is swinging even at the time of this update. From 14:30 UTC started also slight movements of the Amplitude which reached Power 20 at 15:30.
5/14 10:00 – The increase that we expected happened, both in Amplitude, which reached Power 65 at 9:20 UTC, and in Quality which saw a further increase. The Frequency continues to remain very low, at 7.25 Hz and it is therefore likely that we will see further activity.
5/14 08:00 – The new graphs show an “unstable” situation, the Amplitude has remained at minimum values for most of the time after yesterday’s peak but the Quality has continued to fluctuate. The Frequency throughout this period has remained below the base value of 7.83 Hz and has started to decrease from 3 UTC, at the same time we also see the increase in the value of Quality and some slight movements in the Amplitude graph. From 6:30 UTC the activity took off with a first peak of Amplitude which reached Power 42 together with a maximum of Quality and the Frequency that fell below 7.30 Hz. Now we are at Power 45 and apparently rising.
5/13 17:00 – The four hours of activity of the UTC morning was the only movement of today’s graphs, Power 80 was however a very strong value and although short-lived, for about 20 minutes the Amplitude remained above Power 50. Note that the frequency, after these movements, did not return around the base value but has stabilized between 7.50 and 7.70 Hz while the quality has continued to oscillate, hence the coloring of the last part of the main graph.
5/13 11:00 – The maximum peak of this phase was at Power 80 reached at 10 UTC during a phase in which the Frequency started to rise again. This first phase of activity lasted 4 hours, from 7 to 11 UTC.
5/13 09:30 – The activity is continuing and the new amplitude maximum just reached has exceeded 40 reaching Power 43, the frequency continues to remain very low. On a statistical level we would like to show the graph that we used yesterday which today shows quite significant data, this to highlight that even if the data we normally use are collected in Russia the variations are on a planetary level.
5/13 09:00 – We finally found out that the problem was probably on the source website that was not updating the images, now the situation has returned to normal. The graphs show for May 12 a period of activity of about 8 hours, from 5 to 13 UTC, within which the remarkable peak of Power 52 was reached at 9, this corresponded to a peak in Quality and a minimum in Frequency. From 13 UTC an almost calm condition returned and lasted until today at 6 UTC when a series of rapid variations brought the Amplitude repeatedly above Power 30 with the maximum at Power 39 at 8:30 UTC. Also, for this activity there is a marked increase in Quality and a sudden drop in Frequency which has reached the minimum of the last few days at 7.27 Hz.
5/12 17:00 – It is difficult to make updates based on the data shown by these graphs, what can be said is that there are no relevant movements, we could say that the situation is calm. There are isolated peaks but these, due to the position of the detectors, are due to external factors and not proper to the Schumann Resonance. To return to normal data reports we will have to wait for the usual graphs to be updated. However, we will update the current chart which has temporarily replaced the usual one even if the cadence is much wider.
5/12 08:30 – The situation has not changed, the data is still missing and the graph is not updated, which is unusual, generally even if the data is not recorded the graph is updated, at least on the date. This time it’s not and it suggests that there are more serious problems … What we see above is, instead, an alternative data source located in Italy. The graph shows the electric field from 1 to 100 Hz, we prefer not to go into excessive explanations as higher technical knowledge is needed and we would create more questions than anything else, what is clear is that it does not seem we’re having much activity in progress in the last hours. The upper part of the image is today, the lower part is from the last days.
5/11 20:30 – Images are not being updated, we’re still stuck at the same from this morning UTC. One of the recent longest blackout was in October 2019 when it lasted more than 2 days, in 2020 there have been few, lasting generally less than a day.
5/11 17:00 – Blackout continues.
5/11 14:30 – Still in dark mode…
5/11 12:30 – The new graphs still show a calm condition even if in the last hours of the data received there have been some ripples in the Amplitude that has repeatedly reached Power 10, from 23 to 3 UTC. And at that the data transmission stopped, so it’s about 10 hours of blackout. It is also noted that from around midnight UTC the Frequency has constantly risen to high values. We will see when the data transmission will resume what the situation will be.
5/10 17:00 – The calm lasted for the whole extension of today’s graph, the only movement, excluding the previous one to Power 8 actually not very relevant, was at 14 UTC with Power 17. Nothing else to report for Quality and Frequency that remained on normal values.
5/10 08:00 – These are the images of a situation of calm, Amplitude and Quality at minimum and Frequency on the base value, we are approaching the 12 consecutive hours of flat calm.
5/09 17: 00 – Today’s moderate activity lasted about 10 hours, from 3 to 13 UTC. After the peak at Power 34 at 8 UTC another followed at 9:30 and reached Power 25 after which a slow descent began with movements around 15, normal values were reached at 13 UTC. The only parameter that has not yet returned to the base value is the Frequency which continues to tend to remain around 7.60 Hz.
5/09 08:30 – After almost two days of total calm, the activity returned to show itself at 4 UTC today with a first isolated peak that reached Power 19. This first movement was anticipated by a series of fluctuations in Quality and a gradual drop in Frequency started around 1 UTC. As these two parameters deviated from the normal values, the Amplitude also reacted and from 6 UTC it began a rapid increase that reached the maximum of Power 34 at 8 UTC.
5/08 17:00 – Total calm, all the values are back to normal.
5/08 14:00 – The almost total calm is continuing, very slight variations in Quality have given the main graph a green color from 6 UTC. The Frequency has dropped slightly to around 7.60 Hz from 9 UTC while the Amplitude has remained at minimum values.
5/08 07:00 – After several days of strong activity, in the graph of the last 3 days we can see a genera calm, apart from the 2 hours of strong activity yesterday. Today we see Power 10 at 1 UTC in a minimal movement with all the parameters on normal values.
5/07 17:00 – The peaks previously reported were followed by a period of 4 hours of calm until 8 UTC when the Frequency gradually began to decrease, this movement lasted until 14 UTC and was accompanied by a slight increase in both Quality and Amplitude, the latter reached the maximum value of Power 15 at 11. Now we are back to calm.
5/07 07:00 – Today the calm did not last long, shortly after midnight UTC a strong variation brought Amplitude to Power 50, for about 40 minutes it maintained this level reaching Power 53 just before 2 UTC when there was a new movement that generated the strongest peak so far of Power 66 at 2. Just reached this maximum there was a rapid descent that at 3 brought the Amplitude back to normal values. The Quality has always remained on normal values while the Frequency has followed the events starting the decrease at the same time as the Amplitude reaching the minimum of 7.38 at 2 UTC and then starting the ascent. At the time of this update, the Frequency has dropped back to around 7.50 Hz and there are very slight movements in the other parameters are noted.
5/06 17:00 – The calm that began yesterday at 13 UTC lasted until 14 UTC today when a momentary isolated peak reached Power 30, little movement even for the other parameters, Quality and Frequency. The duration of this movement was approximately 1 hour after which it has been calm.
5/05 17:00 – After the previously reported peak there was a sudden rise of the Frequency which in 2 hours, from 11 to 13 UTC, returned to normal values, in parallel both the Amplitude and the Quality also fell towards calm. From 14 we are in a calm condition.
5/05 13:00 – Today the activity began calmly, from 7 UTC there is a gradual drop in frequency which reached the minimum value of 7.28 hz at 11, at the same time when there was a peak in Quality at 8.70. The increase in the amplitude of the cycles has increased in parallel with the decrease in the Frequency and has also reached the maximum value so far of Power 45 at 11 UTC. This was followed by a slight drop but since the Frequency remains low it is likely that we will see other movements.
5/04 21:30 – We are now in a gradual descent, it is interesting to summarize the peaks reached during this phase (UTC times):
11 – Power 91
12 – Power 70
14 – Power 61
15 – Power 61
17 – Power 50
18 – Power 37
21 – Power 20
5/04 17:00 – From the beginning of today’s movements at 7 UTC, 10 hours ago, there has been no interruption, there have been two particularly intense periods, from 10 to 12 UTC when we have been constantly above Power 60, and from 14 to 16 UTC when the Amplitude has always remained above Power 50. Apart from a short period of time of about 30-40 minutes around 13 UTC, from 8 to 16, then 8 hours, we have been constantly above Power 37, quite impressive, do we understand the message from Terra/Gaia?
5/04 14:30 – The activity of the best days distinguishes today, after the very strong peak at Power 91, there has been a short break of about 45 minutes at Power 32 before the new increase in progress that is reaching Power 70 at the time of this update. While the Quality remains at minimum levels (and therefore the ECC is not at stratospheric values), the Frequency remains below the base value.
5/04 12:00 – The series of peaks in constant increase continues, after the 77 previously reported others followed in rapid succession exceeding 80 until reaching Power 91 shortly after 11 UTC. The graphs show strong fluctuations in Quality and Frequency as well.
5/04 10:30 – The script is repeating itself, 15 hours of total calm, from 15 UTC yesterday until 6 UTC today when abrupt changes in Quality and Frequency started which were followed by Amplitude movements that reached a first peak at 8 UTC up to Power 50. The Frequency continued to decrease to 7.32 Hz and this minimum further increased the maximum amplitude value bringing it to Power 77 at 10 UTC.
5/03 17:00 – Today’s activity lasted 11 hours, from 3 to 14 UTC when a last peak at Power 49 seems to have closed a strong sequence that has always been increasing. May seems to be a crucial month, we shall see if the Schumann Resonance will ‘resonate’ appropriately. The situation at the time of this update seems to have returned to calm even if the Frequency is not yet back at the base value, it is still quite low, so other slight movements may occur.
5/03 12:00 – Today so far it has been a continuous crescendo, after the last update we had a peak at Power 65 at 9 UTC, one at Power 72 at 10 and, like a clock, Power 80 at 11 UTC. At 11 o’clock there is a drop in Quality, part of the wide oscillations, and the Frequency which always remains at fairly low levels.
5/03 08:00 – Another increase, after the previous peak, a rapid and short drop before going back to Power 63 at 9 UTC. As before Quality in ever wider oscillations and low Frequency.
5/03 08:00 – As anticipated, the activity is continuing, it started at 3 UTC and with a slow and constant increase it reached the maximum value so far of Power 43 at 7:30 UTC. The oscillations of the Quality increased in intensity without however reaching high values while the frequency continued to decrease until it reached 7.32 Hz.
5/03 06:30 – Once again a period of calm, lasting about 15 hours, from 12 UTC yesterday to 3 this morning. All values measured during this period remained stable at basic levels. From 3 UTC there is a gradual increase in Amplitude which at the time of this update reached Power 20, this movement is accompanied by an equally increase in Quality and a less gradual decrease in Frequency which is going below 7.40 Hz. There is the feeling that the activity can continue to increase.
5/02 17:00 – Calm.
5/02 13:00 – We hope you like the constantly updated charts! Today’s situation, after the final part of the activity previously reported yesterday, shows a period of almost calm that started at 22 UTC yesterday and that lasted for about 10 hours until 8 UTC today. During this period, the Amplitude and the Frequency remained on normal values while the Quality had a variation between 3 and 4 UTC. The first isolated peak of Amplitude at 8 UTC reached Power 20, the second, still isolated, reached Power 18 at 8 UTC and the last, isolated as well, reached Power 41 at 11:40 UTC. While these peaks occurred, the Frequency, as it almost always happens, has had wide oscillations towards lower values, but not too low.
5/01 23:00 – Today we worked hard to make the way that the main chart is updated independently of these textual updates, the work is not yet finished but I think it was worth it already! As for the situation, we see that from 15 to 19 UTC the activity was powerful with 3 major peaks at Power 58, 47 and 30. A further isolated peak reached Power 34 at 21:30 UTC. There have also been wide fluctuations in Quality, indicating that the “message” has not always been the same while the Frequency has had a sharp drop between 17 and 19 UTC.
5/01 17:00 – Even today, little or no calm, after the movements described previously we had an isolated peak that reached Power 44 shortly before 12 UTC. In the following 3 hours there were fluctuations in Quality and Frequency but the Amplitude remained at normal values. From 15, however, a rapid drop in Frequency began and once again an increase in Amplitude which in one hour, at 16 UTC, reached today’s maximum at Power 58. Frequency is still very low at the time of this update so it is possible that the activity continues.
5/01 08:30 – There was the impression that the activity would have continued and it did. Resuming from the last update, where we highlighted the frequency that remained high, it remained so, with the Amplitude on normal values, until 2 UTC when a rapid drop began. At the same time, the Amplitude gradually started to rise to reach the maximum at Power 58 just before 7 UTC. This peak was followed by a new drop towards Power 20 and with an increase in frequency.
Frequency means how many wave cycle happen in a second, 1 Hz. means 1 cycle per second, 40 Hz. means 40 cycles per second, Amplitude is the size of the vibration, how big is the wave, the chart shows the frequency variation in Hz and the amplitude using the white color.
Note
The Ancient Indian Rishis called 7.83 Hz the frequency of OM. It also happens to be Mother Earth’s natural heartbeat rhythm Schumann resonances are named after professor Schumann who was involved in early German secret space program and was later paper-clipped into the United States. The frequencies of Schumann resonances are fairly stable and are mainly defined by the physical size of the ionospheric cavity. The amplitude of Schumann resonances does change and is bigger when ionospheric plasma gets excited. Ionospheric plasma excitation happens because of solar activity, thunderstorms, use of scalar plasma weapons and HAARP and lately also when the Light forces are clearing the plasma anomaly.
Schumann Resonance Today – Energy of Consciousness Currents
All the SR daily images in one single page See the Images
Explanation of The Chart
The Schumann Resonance Spectrogram Chart
The Schumann Resonance Chart displays data from the magnetic field detector to monitor the resonances occurring in the plasma waves constantly circling the earth in the ionosphere. These three days spectrograms show the activity occurring at the various resonant frequencies from 1 to 40 Hz. Within the spectrogram, the power, or intensity level of each frequency is displayed as a color, with white being the most intense. The Schumann Resonances appear as the horizontal lines at 0.0, 4.0, 8.0, 12.0, 16.0, 20.0, 24.0, 28.0, 32.0, 36.0 & 40.0 Hz. This chart is based on Tomsk, Russia, time UTC +7 (UTC = Universal Time Coordinated).
What is a Spectrogram?
The Spectrogram Calendar is a visual representation of the range of frequencies in the magnetic field at a given location. Similar to how an equalizer displays the frequency content of music played on your stereo, the spectrogram calendar displays the frequency content of a magnetic field. Instead of showing a brief snapshot, it shows changes over a period of time, in this case 3 days.
The local magnetic field is a dynamic field that changes constantly because of variations in the ionosphere and sun and many other influences not yet fully understood. The range of variation displayed in the spectrogram chart is from 0 to 40 cycles per second. The vertical axis is frequency and the horizontal axis is time. The amplitude of a particular frequency at a specific time is represented by the intensity of color (green, yellow, white) of each point in the image.
Editor’s Note: Yes, yes, yes…those energies just keep on rollin’ out! Today on June 1, we see a series of moderate density, moderate amplitude energies from 9pm on May 31 through 4am on June 1, 2020. Can you feel how these are changing our world (various places of unrest), and ourselves?
Thanks for following the energetic makeup of our planet, watch for signs and signals of evolution, and BE in…
Schumann Resonance Today. We will try to keep you updated about the variations of the Resonance with this page. The great variations that nobody can explain but that give us a clear sign that the planet is changing. The Earth is vibration higher and higher, just like us!
The Chart time is based on Tomsk – Russia – UTC (Universal Time Coordinated) +7 –Source
SR Base Frequency 7.83 Hz. – Schumann Resonance Today’s Peaks
36
Amplitude
8.00
Quality
8.00
Frequency Max
7.24
Frequency Min
10
Ampltude A2
7
Ampltude A3
6
Ampltude A4
“Every second, a multitude of pulses travel around the world in this unique, resonant chamber between Earth and the ionosphere, sending colluding signals to all microorganisms. These signals couple us to the Earth’s magnetic field. Named after their discoverer, these Schumann Resonances (SR) drive the harmonizing pulse for life in our world.” Eric Thompson
6/1 10:00 – The new graphs show a period of calm from 16 to 23 UTC, during this period all parameters have remained on normal levels. From midnight UTC the frequency started a slow and constant drop along with wide fluctuations in the Quality, the Amplitude also started to move toward the Power 30 threshold at 4:30 UTC, the Frequency reached the minimum value of 7.25 Hz at 6 UTC in correspondence with the maximum amplitude reached so far at Power 36. After these movements the Frequency remained below 7.50 Hz and variations in both Quality and Amplitude continued, the latter remaining around Power 20.
5/31 17:00 – The day continued with activity that went down in intensity although the variations in Frequency were significant. After the two peaks previously reported, others followed around Power 20, they ended around 13 UTC when the Frequency also started to oscillate much less.
5/31 07:30 – At 22 UTC yesterday, without having a period of true calm in the previous hours, the Frequency had a rapid drop falling below 7.50 Hz, this led to two peaks in the Amplitude that first reached Power 32 at 23 UTC and then Power 30 at 00:30. The Quality has also undergone wide variations over the same period, all these movements have continued and had a new high at 4:30 UTC when Amplitude reached Power 74. Frequency has maintained the downward trend and consequently a new oscillation of the Amplitude reached Power 45 at 6:20 UTC. At the time of this update, movements in both Frequency and Quality continue.
5/30 17:00 – There is a pause in the activity but we cannot say that it is calm, even if there are no Amplitude movements, the Frequency is decreasing.
5/30 14:00 – Even today jagged activity, after the last peak at Power 51 of 19 UTC yesterday, the drop was sudden while the Frequency returned to the base value. The calm condition continued until 2 UTC when the Frequency started to move, from 4 UTC these movements became wider and led to an Amplitude peak to Power 31 at 5 UTC. The Frequency has continued to oscillate while the Amplitude has repeatedly touched Power 15. At the time of this update, the Frequency remains basically low but not on excessive values.
5/29 19:00 – Here is the activity we expected, the Frequency has further decreased below 7.50 Hz and the Amplitude oscillations have increased. Just after 17 UTC a first peak reached Power 34 followed less than an hour later by another strong increase to Power 46 at 18 UTC.
5/29 17:00 – We are still in a condition of low frequency therefore the activity, even if moderate, is continuing. After the peak at Power 63 other movements occurred around Power 30 with wide fluctuations in Quality. At the time of this update the Frequency has further decreased to 7.50 Hz so it is possible that we will see other activity.
5/29 14:30 – As we said earlier, the Frequency on low values can be indicative of further activity and in fact it was. As a continuation of the activity previously reported there were moderate variations in the Quality while the Frequency remained around 7.60 Hz, this led to movements in amplitude which eventually led to a peak at Power 63 at 12:30 UTC. The Frequency continued to remain at 7.60 Hz even after this movement, followed by a smaller one around Power 23 just before 14 UTC.
5/29 09:30 – Even today the new graphs show a slight activity that continues without reaching high values. At 6 UTC there was a dip in the Frequency which reached 7.42 Hz at 8 UTC, the response of the Amplitude, as often happens, was in agreement and at 8 UTC it reached the maximum value of Power 25. At the moment of this update the Frequency still remains basically low, we will see if this will be the signal of other activity.
5/28 17:00 – The slight activity shown in the graphs lasted about 8 hours, the most intense phase was from 7 to 9 UTC when there were large frequency fluctuations. From 13 UTC the situation has normalized even if the Frequency remains basically low.
5/28 12:00 – The calm period shown in the new graphs lasted about 18 hours, until 3 UTC this morning, when the Frequency started to oscillate with a gradual descent towards the minimum value of 7.33 Hz. The Amplitude also started oscillations reaching Power 21 shortly after 4 UTC and again at the same time as the minimum frequency peak at 8 UTC.
5/27 17:00 – Calm.
5/27 10:30 – After yesterday’s powerful activity, there were only 4 hours of calm, from 17 to 21 UTC. The movements that started then were however very light although steadily increasing. The Amplitude began to touch Power 10 from 3:30 UTC culminating with the maximum value so far of Power 23 reached at 7:30 UTC. Frequency remained basically stable slightly below the base value of 7.83 Hz.
5/26 17:00 – The movements seem to have calmed down, the descent towards the minimum values began at 14 UTC when the Frequency also started a jagged ascent; from 16 UTC the situation seems calm.
5/26 15:30 – Today’s activity, apart from the black hole, has so far been very powerful. To us, conspiracy theorists who don’t believe in coincidences, screeches a lot that during the peak phase there was this suspicious darkening where probably a more than significant value was reached; who cares, things do not change much in the end. Probably today the combination of Amplitude, Frequency and Quality would have brought the value of the ECC to touch the 500. The part after the hole, however, saw very wide oscillations that reached and exceeded Power 70 at 11:40 and at 13:15 UTC.
5/26 12:00 – After a temporary interruption of the data source site, the situation has partially returned to normal and what we see is massive activity! The first period of activity started at 2 UTC when the Amplitude started a steep climb which led to the strongest peak of this first phase of Power 67 at 3:30 UTC. This was followed by about 2 hours above Power 50. This first move ended at 5:30 UTC. At 7 UTC a new surge, constant and continuous, brought Amplitude to Power 72 at 8:20 UTC. This phase was interrupted by a BLACKOUT that started at 9 UTC and ended at 11:30 UTC, too bad, there were probably other very significant peaks … I don’t think we’ll ever know. At the moment of this update the Amplitude is still rising around Power 70.
5/26 09:00 – The TSU website is down, cannot be reached. While we wait to the site to return online we are going to use this temporary chart, it shows light activity that started little before 6 am UTC.
5/25 17:00 – Today has been a day in which there were no Amplitude movements that exceeded Power 11, this maximum was touched around midnight UTC, at 4 and at 13:30 UTC the Amplitude approached Power 10. The frequency, since few hours, is steadily and gradually decreasing, at the time of this update it is around 7.55 Hz and an isolated Amplitude movement is being generated that has reached Power 17.
5/24 17:00 – After the activity previously reported, the peak at Power 47 at 7 UTC followed by a minor movement that reached Power 24 at 8:30 UTC, the situation returned calm. This until 15 UTC when the Frequency has started to decrease until it reached 7.41 Hz at 16:30 UTC. This decrease can be seen in the main graph with the most intense coloring in the last hour. We will see if this decrease will lead to Amplitude’s movements or will be temporary.
5/24 08:00 – After about 18 hours of total calm, at 6:30 UTC today, suddenly, the frequency had a drop from 8.03 Hz to 7.47 in 40 minutes, this gave way to a strong variation of amplitude that at 7:30 UTC reached Power 47; we could paraphrase this event as a person who is trotting at short (Amplitude) and frequent (Frequency) steps who suddenly changes pace to a reduced frequency but with large strides (Amplitude).
5/23 17:00 – Even today we can say that it was not a real calm day, there were some short-lived isolated peaks, Power 17 shortly before 7 UTC and Power 12, lasting about an hour, from 10 to 11 UTC. Some wide fluctuations in Quality, without reaching high values, colored the main graph between 2 and 4 UTC. Frequency remained much of the time around the base value with a slight drop towards the end of the graph.
5/22 17:00 – An isolated peak, lasted about an hour, occurred from 15 to 16 UTC reaching a maximum value of Power 32 and coincided with a decrease in Frequency down to 7.54 Hz. It returned immediately afterwards towards values normal. Today, however, there has never been a real calm, various parameters have oscillated, the one that has had the most movements is the Frequency.
5/22 14:00 – Not much to report today, mainly there was no calm but not even significant activity, slight Amplitude fluctuations with a maximum at Power 10 at 7 UTC, calm in Quality apart from the first hours of the day and Frequency that oscillates around the base value.
5/21 20:00 – The scale of the Amplitude graph has changed and we clearly see that the maximum peak today was Power 50; the activity is continuing with more marked fluctuations also in Quality, the Amplitude has reached Power 21 at 19 UTC while the Frequency is in a phase of constant and gradual decline that has started many hours back, from the past midnight UTC, it has now reached the minimum value recorded today of 7.44 Hz.
5/21 17:00 – A more intense phase of activity began just before 16 UTC and in a few minutes brought the amplitude to today’s maximum peak of Power 51. With the new graphs we will be able to see more exactly how much it has reached given the very small scale of these of today. The frequency continues to remain low around 7.50 Hz.
5/21 15:50 – Moderate activity began at 13 UTC when the Frequency embarked on a slow descent to return, as previously, to 7.50 Hz. This set in motion the Amplitude that has risen above Power 20 from 13:30. UTC with a first Power 28 which was followed by another at 2. At the time of this update, the Frequency started a rapid rise with a consequent decrease in Amplitude.
5/21 09:30 – The new graphs show a situation of slight movements, in the Amplitude graph they are of little entity due to the very large scale, the two movements that are noticed have reached Power 15 at 4 UTC and Power 12 at 8 UTC. The Frequency oscillates around 7.70 Hz moving downward at the time of this update.
5/20 17:00 – The situation has calmed down considerably but the Frequency remains low, around 7.50 Hz.
5/20 13:00 – The first period of activity today lasted about 2 hours, from 4 to 6 UTC and the maximum value of Amplitude was Power 42; the second period also lasted about two hours, from 9:30 to 12 UTC and the maximum value was similar, Power 43. The difference between these two periods of movement is however remarkable in terms of graphic representation as also the other measurements of the Amplitude parameter have undergone strong increases, which have not happened previously, and therefore we see intense colors of yellow, red and green. At the time of this update, the situation seems to be moving towards calm.
5/20 08:30 – After the strong period of activity there was no calm, the amplitude did not undergo great variations but the Quality and even more the Frequency continued to oscillate without interruption. The Frequency at 4 UTC began a rapid drop towards 7.30 Hz, a value on which it remained for about 2 hours and which triggered a peak in Amplitude which reached Power 42 shortly before 5 UTC. The strong oscillations of Frequency are ongoing at the time of this update.
5/19 17:00 – The period of strong activity lasted about 12 hours, from 2 to 14 UTC when the frequency began to gradually rise towards the base levels but not yet reached at the time of this update.
5/19 14:00 – As we expected, given the frequency so low, just before 13 UTC there was a new powerful peak at Power 77 accompanied by the Quality on the rise. Frequency continues to remain at minimum values.
5/19 12:30 – The activity is gradually decreasing, at the time of this update we are around Power 30 but the Frequency remains always low around 7.30 Hz. As often happens the changes in Amplitude can be considered finished when the Frequency returns close to the base value , which hasn’t happened yet. Since the beginning of today’s activity, we have remained above Power 60 for 6 consecutive hours and during this period, from 6 to 7 UTC, the minimum has been Power 90. The Energy of Consciousness Current, for the statistics, reached 190; also on a statistical level on 27 February 2020 the Amplitude reached Power 170 and ECC 378 (due to the fact of a massive increase in the Frequency up to 8.79 Hz).
5/19 07:30 – Just before 7 UTC a new very strong peak was reached Power 110, the movements do not seem to decrease for now, the Frequency remains at minimum levels with very few oscillations.
5/19 06:30 – Very strong activity in progress, from 1 UTC the frequency started a dive that at 3 UTC brought it around 7.23 Hz, when it reached this minimum value, at 2:50 UTC, there was a strong fluctuation in Quality and Amplitude began to rise very quickly to reach two almost identical maximum values of Power 95 at 4 and 5 UTC. From 3:30 UTC we are constantly above Power 70 and at the time of this update we have surpassed Power 100 reaching 103.
5/18 17:00 – After the previous peaks the situation has calmed down considerably even if the Frequency has tended to be low with wide variations, we will see if this will be the reason for further movements or not.
5/18 13:00 – Even today the activity began shortly after 8 UTC when the Frequency started to decrease with a sharp drop to 7.23 Hz, today’s minimum; during this descent both Amplitude and Quality increased, the latter reaching 11.30 at 11 UTC. As for the Amplitude, the first movement reached the maximum value so far of Power 40 at 10 UTC, followed approximately one hour later by Power 36 and Power 23 at 12:30 UTC when the Frequency started a slight rise. At the time of this update the Frequency returned to minimum values so we might see more activity.
5/17 17:00 – Today’s activity, with a nice and flowing teardrop shape, lasted 5 hours, from 9 to 14 UTC; in the central and more intense part, from 10:30 to 12:30, the Amplitude remained constantly above Power 30 with the Frequency below 7.55 Hz. From 14 UTC with a rapid drop in Amplitude and a gradual increase in Frequency, but not towards the base value of 7.83 Hz but around 7.70 Hz, the activity has decreased considerably.
5/17 12:30 – After a period of calm that lasted about 18 hours at 7 UTC today, a marked decrease in the frequency began and gave the go to slight fluctuations in both Amplitude and Quality. These variations have taken on a much more marked characteristic from 9 UTC when the Frequency has approached the value of 7.40 Hz, since then it has been oscillations no more, the Amplitude has started a rapid increase exceeding Power 30 slightly after 10 UTC, Power 40 at 11:30 and Power 60 shortly before 12 when the Frequency has reached the minimum value of 7.40 Hz so far. This coincided with the peak of Power 69 reached at 11:40 UTC. If you have a cat you can observe his behavior in these moments.
5/16 17:00 – Another lively situation, after the peaks previously reported there was a further movement at 8 UTC that reached Power 46, after this the Frequency increased rapidly towards normal values and this marked the end of intense movements, there were only fluctuations left, mainly of Quality and Frequency around normal values.
5/16 07:30 – Even today we can say that the activity was almost continuous, the period with the least movements was from 21 to 23 UTC yesterday and from midnight the Frequency began to decrease and fluctuations in Amplitude began again. The Frequency stabilized between 7.30 and 7.40 Hz from 4 UTC and at the same time the Amplitude had its first surge at Power 39. A further drop in the Frequency to 7.38 Hz at 5:30 UTC gave the start at the second peak of Amplitude at Power 42 shortly after 6 with a further increase at Power 45 occurred at 7. At the time of this update the Frequency still remains low so it is likely that we will see other activity.
5/15 17:00 – Finally, the frequency returned to rise toward normal values and the activity seems to have ended, from 1 UTC until 16 there were 15 hours of ups and downs with the most intense part from 13 to 15:30 UTC, even if this period was not the one where the highest peak was recorded.
5/15 14:30 – Today seems to be a day of strong activity, after the peak at Power 78 there is only a slight drop in Amplitude but the profound fluctuations in Quality and Frequency continued which continued to decrease to today’s minimum of 7, 30 Hz; all this hinted that we would see other major changes in Amplitude soon. And so it was with Power 65 at 13:50 UTC. The Frequency is still at the minimum so we could see more movements.
5/15 11:30 – Yet another increase, Power 78 was achieved just before 11 UTC while the wide fluctuations in Frequency and Quality continue.
5/15 10:30 – With the Frequency remaining between 7.40 and 7.50 Hz, activity is continuing with wide fluctuations in Quality and Amplitude movements, a new peak at Power 42 occurred at 9:30 UTC and the movements continue. The Black Star is influencing Terra/Gaia.
5/15 09:00 – Even today the calm did not last long, the new charts show a peak at Power 35 at 17:30 UTC yesterday which was followed by a break of about 7 hours until 1 UTC today when a rapid drop in Frequency and a Amplitude leap that reached Power 72 at 2:30 UTC. Since then, the variations have continued even if of a lesser extent mainly linked to the wide fluctuations in Frequency and Quality. At the time of this update, the frequency is below 7.40 Hz.
5/14 17:00 – There was very little calm after the strong peak at Power 65 at 9 UTC this morning, the Frequency remained low for most of the time with a slight rise around 13 UTC but to immediately return to drop below 7.40 Hz, where it is swinging even at the time of this update. From 14:30 UTC started also slight movements of the Amplitude which reached Power 20 at 15:30.
5/14 10:00 – The increase that we expected happened, both in Amplitude, which reached Power 65 at 9:20 UTC, and in Quality which saw a further increase. The Frequency continues to remain very low, at 7.25 Hz and it is therefore likely that we will see further activity.
5/14 08:00 – The new graphs show an “unstable” situation, the Amplitude has remained at minimum values for most of the time after yesterday’s peak but the Quality has continued to fluctuate. The Frequency throughout this period has remained below the base value of 7.83 Hz and has started to decrease from 3 UTC, at the same time we also see the increase in the value of Quality and some slight movements in the Amplitude graph. From 6:30 UTC the activity took off with a first peak of Amplitude which reached Power 42 together with a maximum of Quality and the Frequency that fell below 7.30 Hz. Now we are at Power 45 and apparently rising.
5/13 17:00 – The four hours of activity of the UTC morning was the only movement of today’s graphs, Power 80 was however a very strong value and although short-lived, for about 20 minutes the Amplitude remained above Power 50. Note that the frequency, after these movements, did not return around the base value but has stabilized between 7.50 and 7.70 Hz while the quality has continued to oscillate, hence the coloring of the last part of the main graph.
5/13 11:00 – The maximum peak of this phase was at Power 80 reached at 10 UTC during a phase in which the Frequency started to rise again. This first phase of activity lasted 4 hours, from 7 to 11 UTC.
5/13 09:30 – The activity is continuing and the new amplitude maximum just reached has exceeded 40 reaching Power 43, the frequency continues to remain very low. On a statistical level we would like to show the graph that we used yesterday which today shows quite significant data, this to highlight that even if the data we normally use are collected in Russia the variations are on a planetary level.
5/13 09:00 – We finally found out that the problem was probably on the source website that was not updating the images, now the situation has returned to normal. The graphs show for May 12 a period of activity of about 8 hours, from 5 to 13 UTC, within which the remarkable peak of Power 52 was reached at 9, this corresponded to a peak in Quality and a minimum in Frequency. From 13 UTC an almost calm condition returned and lasted until today at 6 UTC when a series of rapid variations brought the Amplitude repeatedly above Power 30 with the maximum at Power 39 at 8:30 UTC. Also, for this activity there is a marked increase in Quality and a sudden drop in Frequency which has reached the minimum of the last few days at 7.27 Hz.
5/12 17:00 – It is difficult to make updates based on the data shown by these graphs, what can be said is that there are no relevant movements, we could say that the situation is calm. There are isolated peaks but these, due to the position of the detectors, are due to external factors and not proper to the Schumann Resonance. To return to normal data reports we will have to wait for the usual graphs to be updated. However, we will update the current chart which has temporarily replaced the usual one even if the cadence is much wider.
5/12 08:30 – The situation has not changed, the data is still missing and the graph is not updated, which is unusual, generally even if the data is not recorded the graph is updated, at least on the date. This time it’s not and it suggests that there are more serious problems … What we see above is, instead, an alternative data source located in Italy. The graph shows the electric field from 1 to 100 Hz, we prefer not to go into excessive explanations as higher technical knowledge is needed and we would create more questions than anything else, what is clear is that it does not seem we’re having much activity in progress in the last hours. The upper part of the image is today, the lower part is from the last days.
5/11 20:30 – Images are not being updated, we’re still stuck at the same from this morning UTC. One of the recent longest blackout was in October 2019 when it lasted more than 2 days, in 2020 there have been few, lasting generally less than a day.
5/11 17:00 – Blackout continues.
5/11 14:30 – Still in dark mode…
5/11 12:30 – The new graphs still show a calm condition even if in the last hours of the data received there have been some ripples in the Amplitude that has repeatedly reached Power 10, from 23 to 3 UTC. And at that the data transmission stopped, so it’s about 10 hours of blackout. It is also noted that from around midnight UTC the Frequency has constantly risen to high values. We will see when the data transmission will resume what the situation will be.
5/10 17:00 – The calm lasted for the whole extension of today’s graph, the only movement, excluding the previous one to Power 8 actually not very relevant, was at 14 UTC with Power 17. Nothing else to report for Quality and Frequency that remained on normal values.
5/10 08:00 – These are the images of a situation of calm, Amplitude and Quality at minimum and Frequency on the base value, we are approaching the 12 consecutive hours of flat calm.
5/09 17: 00 – Today’s moderate activity lasted about 10 hours, from 3 to 13 UTC. After the peak at Power 34 at 8 UTC another followed at 9:30 and reached Power 25 after which a slow descent began with movements around 15, normal values were reached at 13 UTC. The only parameter that has not yet returned to the base value is the Frequency which continues to tend to remain around 7.60 Hz.
5/09 08:30 – After almost two days of total calm, the activity returned to show itself at 4 UTC today with a first isolated peak that reached Power 19. This first movement was anticipated by a series of fluctuations in Quality and a gradual drop in Frequency started around 1 UTC. As these two parameters deviated from the normal values, the Amplitude also reacted and from 6 UTC it began a rapid increase that reached the maximum of Power 34 at 8 UTC.
5/08 17:00 – Total calm, all the values are back to normal.
5/08 14:00 – The almost total calm is continuing, very slight variations in Quality have given the main graph a green color from 6 UTC. The Frequency has dropped slightly to around 7.60 Hz from 9 UTC while the Amplitude has remained at minimum values.
5/08 07:00 – After several days of strong activity, in the graph of the last 3 days we can see a genera calm, apart from the 2 hours of strong activity yesterday. Today we see Power 10 at 1 UTC in a minimal movement with all the parameters on normal values.
5/07 17:00 – The peaks previously reported were followed by a period of 4 hours of calm until 8 UTC when the Frequency gradually began to decrease, this movement lasted until 14 UTC and was accompanied by a slight increase in both Quality and Amplitude, the latter reached the maximum value of Power 15 at 11. Now we are back to calm.
5/07 07:00 – Today the calm did not last long, shortly after midnight UTC a strong variation brought Amplitude to Power 50, for about 40 minutes it maintained this level reaching Power 53 just before 2 UTC when there was a new movement that generated the strongest peak so far of Power 66 at 2. Just reached this maximum there was a rapid descent that at 3 brought the Amplitude back to normal values. The Quality has always remained on normal values while the Frequency has followed the events starting the decrease at the same time as the Amplitude reaching the minimum of 7.38 at 2 UTC and then starting the ascent. At the time of this update, the Frequency has dropped back to around 7.50 Hz and there are very slight movements in the other parameters are noted.
5/06 17:00 – The calm that began yesterday at 13 UTC lasted until 14 UTC today when a momentary isolated peak reached Power 30, little movement even for the other parameters, Quality and Frequency. The duration of this movement was approximately 1 hour after which it has been calm.
5/05 17:00 – After the previously reported peak there was a sudden rise of the Frequency which in 2 hours, from 11 to 13 UTC, returned to normal values, in parallel both the Amplitude and the Quality also fell towards calm. From 14 we are in a calm condition.
5/05 13:00 – Today the activity began calmly, from 7 UTC there is a gradual drop in frequency which reached the minimum value of 7.28 hz at 11, at the same time when there was a peak in Quality at 8.70. The increase in the amplitude of the cycles has increased in parallel with the decrease in the Frequency and has also reached the maximum value so far of Power 45 at 11 UTC. This was followed by a slight drop but since the Frequency remains low it is likely that we will see other movements.
5/04 21:30 – We are now in a gradual descent, it is interesting to summarize the peaks reached during this phase (UTC times):
11 – Power 91
12 – Power 70
14 – Power 61
15 – Power 61
17 – Power 50
18 – Power 37
21 – Power 20
5/04 17:00 – From the beginning of today’s movements at 7 UTC, 10 hours ago, there has been no interruption, there have been two particularly intense periods, from 10 to 12 UTC when we have been constantly above Power 60, and from 14 to 16 UTC when the Amplitude has always remained above Power 50. Apart from a short period of time of about 30-40 minutes around 13 UTC, from 8 to 16, then 8 hours, we have been constantly above Power 37, quite impressive, do we understand the message from Terra/Gaia?
5/04 14:30 – The activity of the best days distinguishes today, after the very strong peak at Power 91, there has been a short break of about 45 minutes at Power 32 before the new increase in progress that is reaching Power 70 at the time of this update. While the Quality remains at minimum levels (and therefore the ECC is not at stratospheric values), the Frequency remains below the base value.
5/04 12:00 – The series of peaks in constant increase continues, after the 77 previously reported others followed in rapid succession exceeding 80 until reaching Power 91 shortly after 11 UTC. The graphs show strong fluctuations in Quality and Frequency as well.
5/04 10:30 – The script is repeating itself, 15 hours of total calm, from 15 UTC yesterday until 6 UTC today when abrupt changes in Quality and Frequency started which were followed by Amplitude movements that reached a first peak at 8 UTC up to Power 50. The Frequency continued to decrease to 7.32 Hz and this minimum further increased the maximum amplitude value bringing it to Power 77 at 10 UTC.
5/03 17:00 – Today’s activity lasted 11 hours, from 3 to 14 UTC when a last peak at Power 49 seems to have closed a strong sequence that has always been increasing. May seems to be a crucial month, we shall see if the Schumann Resonance will ‘resonate’ appropriately. The situation at the time of this update seems to have returned to calm even if the Frequency is not yet back at the base value, it is still quite low, so other slight movements may occur.
5/03 12:00 – Today so far it has been a continuous crescendo, after the last update we had a peak at Power 65 at 9 UTC, one at Power 72 at 10 and, like a clock, Power 80 at 11 UTC. At 11 o’clock there is a drop in Quality, part of the wide oscillations, and the Frequency which always remains at fairly low levels.
5/03 08:00 – Another increase, after the previous peak, a rapid and short drop before going back to Power 63 at 9 UTC. As before Quality in ever wider oscillations and low Frequency.
5/03 08:00 – As anticipated, the activity is continuing, it started at 3 UTC and with a slow and constant increase it reached the maximum value so far of Power 43 at 7:30 UTC. The oscillations of the Quality increased in intensity without however reaching high values while the frequency continued to decrease until it reached 7.32 Hz.
5/03 06:30 – Once again a period of calm, lasting about 15 hours, from 12 UTC yesterday to 3 this morning. All values measured during this period remained stable at basic levels. From 3 UTC there is a gradual increase in Amplitude which at the time of this update reached Power 20, this movement is accompanied by an equally increase in Quality and a less gradual decrease in Frequency which is going below 7.40 Hz. There is the feeling that the activity can continue to increase.
5/02 17:00 – Calm.
5/02 13:00 – We hope you like the constantly updated charts! Today’s situation, after the final part of the activity previously reported yesterday, shows a period of almost calm that started at 22 UTC yesterday and that lasted for about 10 hours until 8 UTC today. During this period, the Amplitude and the Frequency remained on normal values while the Quality had a variation between 3 and 4 UTC. The first isolated peak of Amplitude at 8 UTC reached Power 20, the second, still isolated, reached Power 18 at 8 UTC and the last, isolated as well, reached Power 41 at 11:40 UTC. While these peaks occurred, the Frequency, as it almost always happens, has had wide oscillations towards lower values, but not too low.
5/01 23:00 – Today we worked hard to make the way that the main chart is updated independently of these textual updates, the work is not yet finished but I think it was worth it already! As for the situation, we see that from 15 to 19 UTC the activity was powerful with 3 major peaks at Power 58, 47 and 30. A further isolated peak reached Power 34 at 21:30 UTC. There have also been wide fluctuations in Quality, indicating that the “message” has not always been the same while the Frequency has had a sharp drop between 17 and 19 UTC.
5/01 17:00 – Even today, little or no calm, after the movements described previously we had an isolated peak that reached Power 44 shortly before 12 UTC. In the following 3 hours there were fluctuations in Quality and Frequency but the Amplitude remained at normal values. From 15, however, a rapid drop in Frequency began and once again an increase in Amplitude which in one hour, at 16 UTC, reached today’s maximum at Power 58. Frequency is still very low at the time of this update so it is possible that the activity continues.
5/01 08:30 – There was the impression that the activity would have continued and it did. Resuming from the last update, where we highlighted the frequency that remained high, it remained so, with the Amplitude on normal values, until 2 UTC when a rapid drop began. At the same time, the Amplitude gradually started to rise to reach the maximum at Power 58 just before 7 UTC. This peak was followed by a new drop towards Power 20 and with an increase in frequency.
Frequency means how many wave cycle happen in a second, 1 Hz. means 1 cycle per second, 40 Hz. means 40 cycles per second, Amplitude is the size of the vibration, how big is the wave, the chart shows the frequency variation in Hz and the amplitude using the white color.
Note
The Ancient Indian Rishis called 7.83 Hz the frequency of OM. It also happens to be Mother Earth’s natural heartbeat rhythm Schumann resonances are named after professor Schumann who was involved in early German secret space program and was later paper-clipped into the United States. The frequencies of Schumann resonances are fairly stable and are mainly defined by the physical size of the ionospheric cavity. The amplitude of Schumann resonances does change and is bigger when ionospheric plasma gets excited. Ionospheric plasma excitation happens because of solar activity, thunderstorms, use of scalar plasma weapons and HAARP and lately also when the Light forces are clearing the plasma anomaly.
Schumann Resonance Today – Energy of Consciousness Currents
All the SR daily images in one single page See the Images
Explanation of The Chart
The Schumann Resonance Spectrogram Chart
The Schumann Resonance Chart displays data from the magnetic field detector to monitor the resonances occurring in the plasma waves constantly circling the earth in the ionosphere. These three days spectrograms show the activity occurring at the various resonant frequencies from 1 to 40 Hz. Within the spectrogram, the power, or intensity level of each frequency is displayed as a color, with white being the most intense. The Schumann Resonances appear as the horizontal lines at 0.0, 4.0, 8.0, 12.0, 16.0, 20.0, 24.0, 28.0, 32.0, 36.0 & 40.0 Hz. This chart is based on Tomsk, Russia, time UTC +7 (UTC = Universal Time Coordinated).
What is a Spectrogram?
The Spectrogram Calendar is a visual representation of the range of frequencies in the magnetic field at a given location. Similar to how an equalizer displays the frequency content of music played on your stereo, the spectrogram calendar displays the frequency content of a magnetic field. Instead of showing a brief snapshot, it shows changes over a period of time, in this case 3 days.
The local magnetic field is a dynamic field that changes constantly because of variations in the ionosphere and sun and many other influences not yet fully understood. The range of variation displayed in the spectrogram chart is from 0 to 40 cycles per second. The vertical axis is frequency and the horizontal axis is time. The amplitude of a particular frequency at a specific time is represented by the intensity of color (green, yellow, white) of each point in the image.