Gaia Portal Preliminaries Finish. By Interstellar.
Below the Gaia Portal October 9 2019 message with our free interpretation in rough English.
Clicks on the Ads Keep Us Alive
Preliminaries Finish
A series of very encouraging phrases, surely we all hope they are the snapshot of the situation!
In this introductory sentence the message is clear, the last message
spoke of the Completion of the Missions and now we have the Finish of
the Preliminaries. We would now move on to the full phase, which many
might call Red October or mass arrests, others hope Compression
Breakthrough, the definitive fall of the Veil.
Intermediaries Are Incorporated Into The Reception Of The Higher Cosmics At This Time
In this second sentence the
reference could be to those who have continued to anchor in the Light on
the Planet until now, who have acted as intermediaries between the
various Energetic and Vibrational Levels trying to bring them to the
denser areas. In this moment in which the Preliminaries are finished,
they would be completely integrated, they will probably have a direct
connection with the Upper Existential Plans.
hu=manity Begins The Full Surrender Process
hu=manity is a new term, probably
the symbol = could represent those who have been manipulated so as to be
all equal, a sort of flock of indistinguishable sheep. It seems we are
at a time when manipulation is failing, the global awakening seems to be
imminent. The total surrender in itself give the idea of an army that
surrenders on the battlefield, total chaos between losers and winners.
Hue-Manity Rises To Assist All
This sentence seems to be perfectly
connected with the previous two, once the Intermediaries are
incorporated they will be able to guide and contribute to help all the
part of Humanity with a higher Vibrational Frequency to help the
“losers” and place them on the path of the Light.
The Light Crystallizes The Solution
In this last sentence we find the
summary of the movement in progress, humanity in its totality will
converge on a single path that leads to existential experiences that can
help to maintain a Vibrational Frequency in slow but steady increase,
this dynamic position will have its Strength, Solution and Continuity in
the Light, that symbolically will Crystallize this plasticity.
In final analysis a series of phrases that make us very hopeful and
that reinforce the sensations that the beginning of Shift is upon us.
Over time there have been various moments in which the Energy has
reached remarkable levels but never “resolvers” and therefore without
ever being “crystallized”, perhaps this is the moment?
Gaia Portal
GaiaPortal conveys messages regarding changes and progress
in Mother Earth’s planetary energy phases. The messages contained herein
are to inform, assist, and alert those drawn to it, to energetic events
transpiring moment to moment.
Those drawn to this site will know instantaneously if it is theirs to read.
The authors of this site are Star Beings connected to the sacred land of Éire, and embody the original sacred feminine energy of that place.
Major movements by the negative rulers towards the surface population for complete control of Earth is coming to a halt.
This agenda has been reversed engineered shall we say and a push towards a more positive timeline is being activated.
Clicks on the Ads Keep Us Alive
A year or so ago the Draco Alliance
made a major push for an end of the world programming using Loosh
energy to open up a portal to bring in back up.
But, at the same time, a positive surface ground crew anchored in the
physical, shut down that particular portal to reset the original
timeline and open up more Galactic consciousness to the programmed
surface population.
Anchoring Positive Energy
Everything Is Connected
This operation by these positive beings also captured and quarantined some major players.
The Dark forces have been in survival mode for more than a year now and are pushing for more and more fuel.
This is why we are seeing so much social unrest, unstable weather, natural disasters, wars and rumors of war.
These Dark rulers have been running on razors edge for sometime now
milking enough negative energy out of humanity to fulfill their end of
the the world Armageddon agenda.
Without us they have no batteries and this is a major reason there
will never be another world ending war like the annihilation of Maldek
and the destruction of Mars atmosphere. Simply, because they need their
livestock.
Anchoring Positive Energy
Everything Is Connected
They are reaching the end of what their manipulation can handle without the collapse of their entire system.
But, many are starting to see the collapse of the old world and are cultivating the bringing in of the New World.
The reason why many of us are here at this time in Earth’s history is
to bring in these higher energies that are ushering in this New World
as painless as possible.
We are coming into some major times of chaos before the major transition.
We all know there is something massive coming for humanity, something brilliant, something pure.
Our path has never been more clear and we are beginning to see where it all leads.
You
can’t reach anything if you don’t dream about it. Everything in
existence, was before conceived like a dream, everything achieved, was
before thought. One thing is sure, if you can’t imagine… you can’t
achieve.
Stephen Littleword
Share this: Send the word out using these buttons!
American Airlines joins Southwest in abandoning hope 737 MAX will fly again this year.
2 dead, several injured in German synagogue shooting; Attackers wore combat-style clothing, had several weapons.
Scotland’s highest court asked to intervene if Boris Johnson refuses to ask the European Union for a Brexit delay.
Trump on Syria troop withdrawal: US should have never been in the Middle East.
Video game producer Blizzard removed from its Grandmasters
tournament a Hearthstone player who called for the “liberation” of HKG
and zeroed $10,000 in prize money.
Radical Islamist police officer who killed his Paris colleagues had Top Secret security clearance & info on Undercover Cops.
Twitter used the phone numbers and email addresses of some users
provided for two-factor authentication for targeted advertising.
Germany shooting live streamed on Amazon’s Twitch site.
Hunter Biden’s BHR owns stake in Chinese company blacklisted by US.
Strongest EQ in Europe M3.8 Greece Strongest EQ in US M3.3 California Strongest EQ on the Planet M5.5 New Zealand
News Burst 10 October 2019
Share this: Send the word out using these buttons!
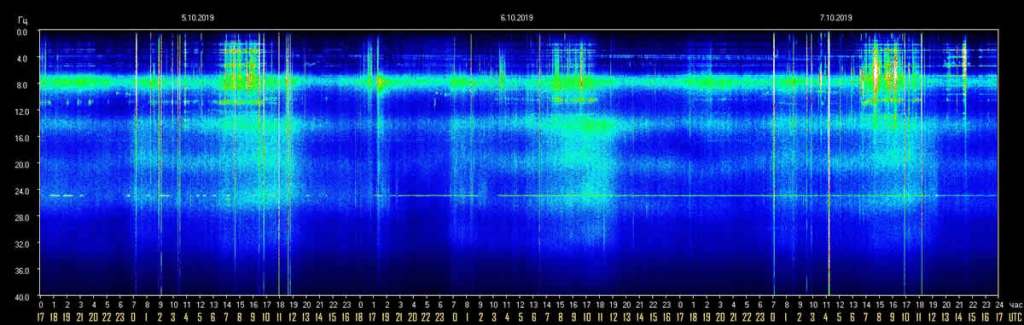
Editor’s Note: Another day of “almost” seeing Schumann Resonance energies which are emitted by the Earth in response to receiving just the right frequency/amplitude of cosmic energy. This minor pattern has been playing out for a few days now.
Have these specific frequencies aimed at Earth now put on hold as other.higher energies continue to stream to the Earth? Perhaps the “Pleiades Messages” may hold a clue.
Please view this graph, know that whatever cosmic/solar energies are being used…boy are they effective (!), and BE…
Schumann Resonance Today. We will
try to keep you updated about the variations of the Resonance with this
page. The great variations that nobody can explain but that give us a
clear sign that the planet is changing. The Earth is vibration higher
and higher, just like us!
The Chart time is based on Tomsk – Russia – UTC +7Source
RS Base Frequency 7.83 Hz.
Schumann Resonance Today Peaks:
10/6 17:00 UTC – Even
today very light activity, the maximum of 17 Hz was reached shortly
after 4 UTC. This slight activity however lasted from midnight to 15
UTC.
10/6 17:00 UTC – Calm.
10/5 17:00 UTC – Calm.
10/4 17:00 UTC – Practically calm, peak at 13 Hz at 11 UTC.
10/3 17:00 UTC – The pattern of slight daily increase, seems to be
underway again, the activity saw a first isolated peak at 1 UTC which
reached 17 CC and later, during a more relevant phase, 22 CC at 6:30
UTC.
10/2 17:00 UTC – Slight activity limited to a period of about 10 hours, from 1 to 11 UTC, the maximum peak at 9 to 14 CC.
10/1 17:00 UTC – Very light activity during the central part of the day, the only significant peak reached 26 Hz at 4 UTC.
9/30 17:00 UTC – A new peak at 30 Hz closed the activity in today’s the chart but the light movements seems to continue.
9/30 10:00 UTC – Light and medium variations are continuing since
yesterday. From 9 UTC yesterday, so for the past 24 hours we have been
seeing continuous slight movements, in the new graph the highest peaks
are shown at 2, corresponding to 19 UTC yesterday, and at 9:30 UTC
today, at 30 Hz.
9/29 17:00 UTC – Today’s graphs show a sequence of isolated peaks of
ever-increasing magnitude starting from 15 and ending at a maximum of
43 Hz at 12:45. This stronger peak occurred within a more intense period
of activity, from 12:45 to 14 UTC, with various peaks around 40 Hz.
9/28 17:00 UTC – Today’s activity was concentrated in about 5 hours from 2 to 7 UTC as described above. Calm followed.
9/28 10:00 UTC – Light activity started around 23 UTC yesterday,
with a constantly increase it reached the maximum of 35 Hz at 4 UTC. The
movements continued on these values until 7 UTC when there was a rapid
decline.
9/27 17:00 UTC – Even today the moderate period of activity, from midnight to 11 UTC, the maximum peak was 26 Hz at 8 UTC.
9/26 17:00 UTC – After a pause of about 12 hours, at midnight UTC
slight variations began, around 13 o’clock the two strongest peaks of
the day were evicted, 35 and 37 Hz. The entity of the variations began
then to go down until it reached again calm at 13 UTC.
9/25 17:00 UTC – Today almost calm, the light activity began just
before midnight UTC and lasted until 10, the peaks were between 10 and
15 Hz.
9/24 17:00 UTC – Even today, a day of medium activity. It started
around midnight UTC and the central part was from 5 to 9 UTC during
which the strongest peak of today occurred, 47 Hz at 7:40. After this
animated phase there was a reduction in the variations with few isolated
peaks at 26 Hz. From 13:30 UTC it’s calm.
9/23 17:00 UTC – After the movements reported previously the
activity continued to increase and shortly after, at 6:30 UTC, there was
the strongest peak of the day that reached 62 Hz. After this, the
variations were reduced with some isolated spike around the 20 Hz
threshold.
9/23 08:30 UTC – After a brief pause of about 6 hours the slight
movements started again lightly at 23 UTC. A series of most significant
peaks took place from 4:30 am with a maximum of 21 Hz around 6 UTC.
9/22 17:00 UTC – Today the movements started at 4 UTC and from that
moment we can see numerous peaks around 20 Hz, the strongest reached 25
Hz at 9:30 UTC. The activity is continuing.
9/21 17:00 UTC – Today’s movements lasted about 14 hours, from 23
UTC yesterday, the highest peaks are those reported previously. The
situation now is calm.
9/21 10:30 UTC – The strong activity of yesterday was followed by a
period of calm that lasted about 9 hours, until 23 UTC yesterday. From
that moment on, a moderate but continuous activity began which generated
various peaks at 25 Hz between 7 and 8:30 UTC.
9/20 17:00 UTC – Today’s activity lasted, in its maximum expression,
around 9 hours, from 5 to 14 UTC. During this period the values
remained above 60 Hz for about 6 hours, from 6 to 12. The time period
above 40 Hz was from 6 to 12:30 UTC. Currently the values are back to
normal. The 99 Hz were reached at 10:20 UTC.
9/20 10:30 UTC – We are getting close to 100 Hz, 98 at 10 UTC.
9/20 09:00 UTC – After a period of calm lasted several hours, at
midnight UTC a new cycle of movements began, peaks remained moderate
around 15 Hz for about 4 hours. At 5 UTC, however, started a very strong
activity which in about 2 hours, at 7:20 UTC, led to a massive peak at
95 Hz.
9/19 17:00 UTC – The activity reported previously was the only one
today, started at 6 and returned to normal values at 11:30 UTC.
9/19 10:00 UTC – Much of today has been calm, the first sign of
movement was at 4:30 UTC and anticipated a strong activity that seems to
be of short duration, about 2 hours; at 9 UTC we have had what up to
now is the largest movement at 66 Hz.
9/18 17:00 UTC – Today, practically continuous activity, even if of
very moderate magnitude, the most “lively” part was from midnight to 11
UTC with a maximum peak at 20 Hz at 4:20 UTC.
9/17 17:00 UTC – The peak reported previously was the first of a 40
Hz activity phase that lasted 4 hours, from 12:30 to 16:30 UTC. The peak
at 40 Hz occurred at 13:20.
9/17 14:30 UTC – The activity remained in a calm condition until
midnight UTC when slight movements began. Suddenly at 6:30 and 7 UTC two
peaks occurred, the first at 30 and the second at 38 Hz. These were
followed by a further calm until a 38 Hz movement at 13:45.
9/16 17:00 UTC – Calm.
9/16 08:30 UTC – Usual activity around the 17th of the month. Today
the movements started in a rather sudden and powerful way but initially
with isolated peaks, the first was just before midnight UTC at 30 Hz.
This was followed by 44 Hz at 6 UTC and then what is now the strongest,
63 Hz at 8 UTC.
9/15 17:00 UTC – After about 8 hours of calm, at 1 UTC, a slight activity began with no significant peaks.
9/14 17:00 UTC – The activity, even if light-moderate, continues
incessantly. As in the last three days it has been a constant
oscillation on 10-15 Hz with sporadic more significant movements. Today
the relevant part goes from 10 to 16 UTC with a series of spikes the
highest of which reached 34 Hz at 14:30 UTC.
9/13 17:00 UTC – The activity that started yesterday at 18 UTC
lasted 5 hours, until 23 UTC, it has been a powerful movement even if
the maximum peak was 38 Hz. For the rest of the day there was a
continuous slight background activity.
9/12 21:30 UTC – The new graph shows what appears to be the
beginning of a significant activity, these movements started at 18 UTC
and are in progress, the highest value so far has been 37 Hz.
9/12 17:00 UTC – After the solitary spike previously reported, the activity continued but of low entity.
9/12 10:00 UTC – The new graph shows a first peak last night at 6 pm
UTC which reached 28 Hz, followed by a period of relative calm until
5:30 UTC when a powerful spike reached 49 Hz.
9/11 17:00 UTC – Even after previous significant activity the
movements continued, but with relatively low peaks, 20 Hz, and are
continuing around this magnitude.
9/11 10:00 UTC – There was no actual pause after yesterday’s
activity, the movements continued with a peak to 29 Hz at 20 UTC while a
more powerful activity occurred from 8 UTC with two peaks above 40 Hz
the strongest of which to 43 Hz at 9 UTC.
9/10 17:00 UTC – Calm. The movements ended at 10 UTC.
9/10 10:30 UTC – Today’s chart shows an activity similar to
yesterday’s, with isolated peaks, but slightly more continuous. The
movements started at 23 UTC yesterday with slight variations. The most
significant peaks occurred in rapid succession from 8 UTC with the
maximum value 34 Hz at 8:20 UTC.
9/9 17:00 UTC – After the two peaks previously reported, another one occurred at 20 Hz at 10:30 UTC after which it was calm.
9/9 11:00 UTC – A pair of isolated peaks has been the activity of
today until now, the first at 7:30 UTC has reached 27 Hz, the second
peak 1 hour later at 8:30 UTC has been at 37 Hz.
9/8 17:00 UTC – Even today, looking at the chart, one has the
feeling that the activity, in the last four days, is gradually
decreasing. Today the movements lasted 6 hours, from 6 to 12 UTC, the
maximum peak was 23 Hz at around 7 UTC.
9/7 17:00 UTC – Today’s graph shows that in the last 3 days there
has been a decline in the intensity of the activity. Today the movements
started at 5 and lasted until 11:30 UTC, during this period the maximum
peak was 30 Hz at 8:30 UTC.
9/6 17:00 UTC – Today’s activity period lasted for about 12 hours,
from 23 UTC yesterday to 11 UTC today, now the situation is calm.
9/6 10:30 UTC – The activity today started at midnight UTC with
small variation on the 15 Hz threshold, from 4 UTC the values increased
slightly reaching 20 Hz, at 8 UTC we had the strongest peak until now
that reached 44 Hz.
9/5 17:00 UTC – The activity after the strong movement described
earlier remained calm. The black band is due to lack of data for that
time period.
9/5 10:00 UTC – The TSU site had some glitches until now, the
surprise update shows us a strong activity. The opening was given by an
isolated peak at 55 Hz followed by a period of about 2 hours of strong
movements culminating with a 67 Hz spike at at 8:30 UTC.
9/4 17:00 UTC – Another spike at 27 Hz occurred during a short period of activity lasted 1 hour from 11:30 UTC.
9/4 10:00 UTC – The activity continued uninterrupted even today, the
most significant part up to now has started at 7 UTC and has led to a
peak at 40 Hz just before 8 UTC.
9/3 17:00 UTC – Even in today’s chart we can see that there wasn’t a
real calm. The periods of most intense activity were two: the first
from 7 to 9 UTC which reached the maximum at 20 Hz; the second from 14
to 15 UTC with the maximum at 36 Hz.
9/2 17:00 UTC – The situation, after the previous peaks, is in a phase of calm.
9/2 11:30 UTC – The variations continued practically without
interruption even if with moderate values, at 7 UTC a more significant
activity began which led to a peak at 69 Hz at 8 UTC followed by another
at 40 Hz about an hour later. This period of elevated activity lasted
about 2 hours.
9/1 17:00 UTC – There has been no pause, although without excessive
values the activity has been continuous and seems to last longer. An
isolated peak at 37 Hz occurred at 12:20 UTC.
9/1 09:00 UTC – Movements restarted shortly after the midnight shown
on the chart, corresponding to 17 UTC. Peaks were moderate with the
strongest that reached 36 Hz at 20:30 UTC. After this a period of
variations started with the average value being at 20 Hz for 6
continuous hours, from 23 to 5 UTC this morning.
Frequency means how many wave cycle happen in a second, 1 Hz.
means 1 cycle per second, 40 Hz. means 40 cycles per second, Amplitude
is the size of the vibration, how big is the wave, the chart shows the
frequency variation in Hz and the amplitude using the white color.
Note
The Ancient Indian Rishis called 7.83 Hz the frequency of OM. It also happens to be Mother Earth’s natural heartbeat rhythm
Schumann resonances are named after professor
Schumann who was involved in early German secret space program and was
later paper-clipped into the United States. The frequencies of Schumann resonances are fairly stable and are mainly defined by the physical size of the ionospheric cavity.
The amplitude of Schumann resonances does
change and is bigger when ionospheric plasma gets excited. Ionospheric
plasma excitation happens because of solar activity, thunderstorms, use
of scalar plasma weapons and HAARP and lately also when the Light forces
are clearing the plasma anomaly.
Dependencies of Amplitudes Schumann Resonance October 7 2019
Dependencies of Quality Schumann Resonance October 7 2019
Dependencies of Frequency Schumann Resonance October 7 2019
All the SR daily images in one single pageSee the Images
Explanation of The Chart
The Schumann Resonance Spectrogram Chart
The Schumann Resonance Chart displays data from the magnetic field
detector to monitor the resonances occurring in the plasma waves
constantly circling the earth in the ionosphere. These three days
spectrograms show the activity occurring at the various resonant
frequencies from 1 to 40 Hz. Within the spectrogram, the power, or
intensity level of each frequency is displayed as a color, with white
being the most intense. The Schumann Resonances appear as the horizontal
lines at 0.0, 4.0, 8.0, 12.0, 16.0, 20.0, 24.0, 28.0, 32.0, 36.0 &
40.0 Hz. This chart is based on Tomsk, Russia, time UTC +7 (UTC =
Universal Time Coordinated).
What is a Spectrogram?
The Spectrogram Calendar is a visual representation of the range of
frequencies in the magnetic field at a given location. Similar to how an
equalizer displays the frequency content of music played on your
stereo, the spectrogram calendar displays the frequency content of a
magnetic field. Instead of showing a brief snapshot, it shows changes
over a period of time, in this case 3 days.
The local magnetic field is a dynamic field that changes constantly
because of variations in the ionosphere and sun and many other
influences not yet fully understood. The range of variation displayed in
the spectrogram chart is from 0 to 40 cycles per second. The vertical
axis is frequency and the horizontal axis is time. The amplitude of a
particular frequency at a specific time is represented by the intensity
of color (green, yellow, white) of each point in the image.