Google hires Karen DeSalvo, who served during the Obama administration, as new chief health officer.
2016 Wikileaks email resurfaces revealing John Podesta was mastermind behind Tulsi Gabbard’s Congressional win.
Chile orders new curfew as violent protests rage.
San Diego woman living in van gives up all 300 of her pet rats.
Apple begins to manufacture iPhones in India.
Ukrainian Government ready to cooperate with FBI on case of laundering hundreds of millions of IMF aid money.
Fight to keep 8kun shut is continuing with the intervention of Alibaba Cloud US.
Looking at “Russia Hoax” and “Impeachment Hoax” Rep and Dem politicians consider American People a bunch of idiots.
UK documentary coming out about Prince Andrew’s having an orgy with Jeffrey Epstein and 9 girls, some of whom were underage.
Hole in the ozone is now the smallest it has been on record since it was discovered in 1982, NASA confirms.
Carter is hospitalized from another fall.
Vespa Scooter launches a new cargo robot that can carry your stuff.
China intends to replace Hong Kong Chief Executive Carrie Lam with a new “interim” chief until the 2022 end of her term.
Outbreak of Legionnaires’ disease at US state fair kills 4, sickens more than 100.
Death threats and suicide: Hong Kong protests have taken toll on young activists.
Strongest EQ in Europe M3.9 Greece Turkey Border Strongest EQ in US M3.7 Kansas Strongest EQ on the Planet M5.8 Tonga Deepest EQ M4.1 293 km Japan
News Burst 23 October 2019
Share this: Send the word out using these buttons!
Editor’s Note: Wow…another day of relative “silence” in terms of the Schumann Resonance. Let’s think about this a bit. Either (a) this influence of the Schumann Resonance frequency is no longer needed on Earth (wonder what the reading is today?), or…just another break in the energies coming to Earth which are responsible for generating Schumann Resonance energies. You choose? 🙂
At any rate, reports of “enough” of the human collective to be able to trigger the Ascension of humanity may have an impact on the Schumann Resonance energies. So…read here, know that Ascension is here, and BE…
Schumann Resonance Today. We will
try to keep you updated about the variations of the Resonance with this
page. The great variations that nobody can explain but that give us a
clear sign that the planet is changing. The Earth is vibration higher
and higher, just like us!
The Chart time is based on Tomsk – Russia – UTC (Universal Time Coordinated) +7Source
RS Base Frequency 7.83 Hz.
Schumann Resonance Today Peaks:
10/21 17:00
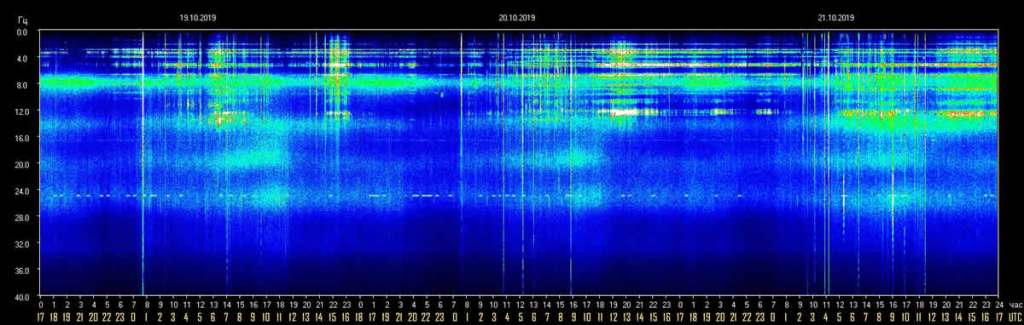
UTC – Another day of light activity, the only significant movement
reached 11 at 11 chart local time, corresponding to 4 UTC.
10/20 17:00 UTC – Very light activity, Power 10.
10/20 10:00 UTC – Not much to report, the most relevant movement reached an amplitude of Power 16 just before 9 am UTC.
10/19 17:00 UTC – Calm.
10/18 17:00 UTC – The only significant activity of today has been reported previously, we are now in a situation of calm.
10/18 10:00 UTC – A light activity continued after the previous
series of peaks, the average has been around Power 20 from 18 to 22 UTC.
Is seems the functionality on the TSU is still not fully recovered.
10/17 17:00 UTC – In the part of the graph available for today we
note 3 peaks one of Power 53, reported previously, the second of Power
57 at 10:15 UTC and the last minor at 25 at 12:40 UTC.
10/17 08:30 UTC – From 6 UTC the data are available again and, like
every self-respecting 17 in this last period, even today we have our
peak with a power of 53 at 7:20 UTC. We hope that the problem has been
solved and we can return to a normal flow of data.
10/16 17:00 UTC – Still frozen at yesterday’s image, other sources report peaks for today at 20.
10/15 17:00 UTC – Pitch black.
10/15 10:00 UTC – This is the little we have for the last few days,
lack of data. Other stations with different measurement report calm.
10/14 17:00 UTC – For the little we can see the situation remained calm.
10/14 09:30 UTC – The TSU site is back live but the interruption
data is not available as seen from the large blank space in the chart.
Looking for information on the web it seems that during this “void”
period the situation remained almost calm. Currently we see very light
movements at about 10 Hz.
10/13 22:00 UTC – TSU website still down.
10/12 17:00 UTC – TSU website is down, we will post an update as soon as it will return live.
10/11 17:00 UTC – After several days of calm, from yesterday at 7:30
UTC, we are seeing a medium activity which, despite being
uninterrupted, generated peaks of average amplitude. From 12 UTC today, a
period of more significant movements began which reached the maximum
peak at 59 Hz shortly after 15 UTC.
10/10 17:00 UTC – Today the activity has returned more significantly
since 1 UTC. The first significant variation started at 7:30 UTC and
within few hours reached the maximum of 42 Hz at 9:45 UTC. The movements
are continuing.
10/9 17:00 UTC – The light activity continues, the peak of today has
reached 13 Hz shortly after 9 UTC. A black vertical line is visible in
the chart, it’s due to missing data.
10/8 17:00 UTC – Almost calm, maximum 13 Hz at 10 UTC.
10/7 17:00 UTC – Even today very light activity, the maximum of 17
Hz was reached shortly after 4 UTC. This slight activity however lasted
from midnight to 15 UTC.
10/6 17:00 UTC – Calm.
10/5 17:00 UTC – Calm.
10/4 17:00 UTC – Practically calm, peak at 13 Hz at 11 UTC.
10/3 17:00 UTC – The pattern of slight daily increase, seems to be
underway again, the activity saw a first isolated peak at 1 UTC which
reached 17 CC and later, during a more relevant phase, 22 CC at 6:30
UTC.
10/2 17:00 UTC – Slight activity limited to a period of about 10 hours, from 1 to 11 UTC, the maximum peak at 9 to 14 CC.
10/1 17:00 UTC – Very light activity during the central part of the day, the only significant peak reached 26 Hz at 4 UTC.
Frequency means how many wave cycle happen in a second, 1
Hz. means 1 cycle per second, 40 Hz. means 40 cycles per second,
Amplitude is the size of the vibration, how big is the wave, the chart
shows the frequency variation in Hz and the amplitude using the white
color.
Note
The Ancient Indian Rishis called 7.83 Hz the frequency of OM. It also happens to be Mother Earth’s natural heartbeat rhythm
Schumann resonances are named after professor
Schumann who was involved in early German secret space program and was
later paper-clipped into the United States. The frequencies of Schumann resonances are fairly stable and are mainly defined by the physical size of the ionospheric cavity.
The amplitude of Schumann resonances does
change and is bigger when ionospheric plasma gets excited. Ionospheric
plasma excitation happens because of solar activity, thunderstorms, use
of scalar plasma weapons and HAARP and lately also when the Light forces
are clearing the plasma anomaly.
Dependencies of Amplitudes Schumann Resonance October 21 2019
Dependencies of Quality Schumann Resonance October 21 2019
Dependencies of Frequency Schumann Resonance October 21 2019
All the SR daily images in one single pageSee the Images
Explanation of The Chart
The Schumann Resonance Spectrogram Chart
The Schumann Resonance Chart displays data from the magnetic field
detector to monitor the resonances occurring in the plasma waves
constantly circling the earth in the ionosphere. These three days
spectrograms show the activity occurring at the various resonant
frequencies from 1 to 40 Hz. Within the spectrogram, the power, or
intensity level of each frequency is displayed as a color, with white
being the most intense. The Schumann Resonances appear as the horizontal
lines at 0.0, 4.0, 8.0, 12.0, 16.0, 20.0, 24.0, 28.0, 32.0, 36.0 &
40.0 Hz. This chart is based on Tomsk, Russia, time UTC +7 (UTC =
Universal Time Coordinated).
What is a Spectrogram?
The Spectrogram Calendar is a visual representation of the range of
frequencies in the magnetic field at a given location. Similar to how an
equalizer displays the frequency content of music played on your
stereo, the spectrogram calendar displays the frequency content of a
magnetic field. Instead of showing a brief snapshot, it shows changes
over a period of time, in this case 3 days.
The local magnetic field is a dynamic field that changes constantly
because of variations in the ionosphere and sun and many other
influences not yet fully understood. The range of variation displayed in
the spectrogram chart is from 0 to 40 cycles per second. The vertical
axis is frequency and the horizontal axis is time. The amplitude of a
particular frequency at a specific time is represented by the intensity
of color (green, yellow, white) of each point in the image.
Editor’s Note: This is a repeat of the same graph as yesterday on 10/20. It is very likely that transmissions from the site monitoring Schumann Resonance energies have been compromised in some way.
Stay tuned…the best is yet to be, and more importantly, BE…
Schumann Resonance Today. We will
try to keep you updated about the variations of the Resonance with this
page. The great variations that nobody can explain but that give us a
clear sign that the planet is changing. The Earth is vibration higher
and higher, just like us!
The Chart time is based on Tomsk – Russia – UTC (Universal Time Coordinated) +7Source
RS Base Frequency 7.83 Hz.
Schumann Resonance Today Peaks:
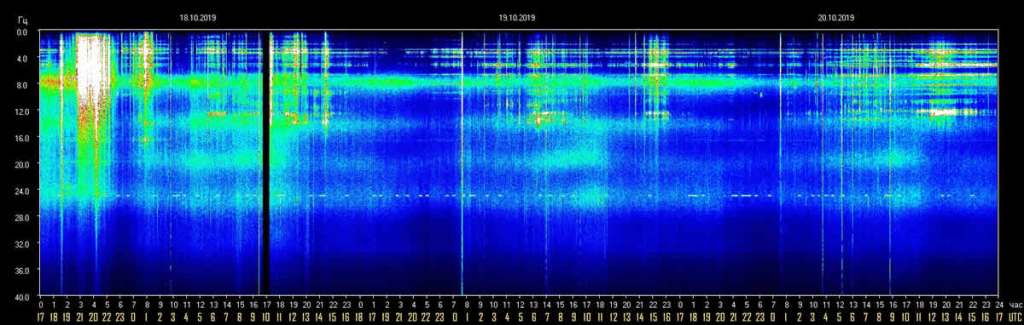
10/20 17:00 UTC – Very light activity, Power 10.
10/20 10:00 UTC – Not much to report, the most relevant movement reached an amplitude of Power 16 just before 9 am UTC..
10/19 17:00 UTC – Calm.
10/18 17:00 UTC – The only significant activity of today has been reported previously, we are now in a situation of calm.
10/18 10:00 UTC – A light activity continued after the previous
series of peaks, the average has been around Power 20 from 18 to 22 UTC.
Is seems the functionality on the TSU is still not fully recovered.
10/17 17:00 UTC – In the part of the graph available for today we
note 3 peaks one of Power 53, reported previously, the second of Power
57 at 10:15 UTC and the last minor at 25 at 12:40 UTC.
10/17 08:30 UTC – From 6 UTC the data are available again and, like
every self-respecting 17 in this last period, even today we have our
peak with a power of 53 at 7:20 UTC. We hope that the problem has been
solved and we can return to a normal flow of data.
10/16 17:00 UTC – Still frozen at yesterday’s image, other sources report peaks for today at 20.
10/15 17:00 UTC – Pitch black.
10/15 10:00 UTC – This is the little we have for the last few days,
lack of data. Other stations with different measurement report calm.
10/14 17:00 UTC – For the little we can see the situation remained calm.
10/14 09:30 UTC – The TSU site is back live but the interruption
data is not available as seen from the large blank space in the chart.
Looking for information on the web it seems that during this “void”
period the situation remained almost calm. Currently we see very light
movements at about 10 Hz.
10/13 22:00 UTC – TSU website still down.
10/12 17:00 UTC – TSU website is down, we will post an update as soon as it will return live.
10/11 17:00 UTC – After several days of calm, from yesterday at 7:30
UTC, we are seeing a medium activity which, despite being
uninterrupted, generated peaks of average amplitude. From 12 UTC today, a
period of more significant movements began which reached the maximum
peak at 59 Hz shortly after 15 UTC.
10/10 17:00 UTC – Today the activity has returned more significantly
since 1 UTC. The first significant variation started at 7:30 UTC and
within few hours reached the maximum of 42 Hz at 9:45 UTC. The movements
are continuing.
10/9 17:00 UTC – The light activity continues, the peak of today has
reached 13 Hz shortly after 9 UTC. A black vertical line is visible in
the chart, it’s due to missing data.
10/8 17:00 UTC – Almost calm, maximum 13 Hz at 10 UTC.
10/7 17:00 UTC – Even today very light activity, the maximum of 17
Hz was reached shortly after 4 UTC. This slight activity however lasted
from midnight to 15 UTC.
10/6 17:00 UTC – Calm.
10/5 17:00 UTC – Calm.
10/4 17:00 UTC – Practically calm, peak at 13 Hz at 11 UTC.
10/3 17:00 UTC – The pattern of slight daily increase, seems to be
underway again, the activity saw a first isolated peak at 1 UTC which
reached 17 CC and later, during a more relevant phase, 22 CC at 6:30
UTC.
10/2 17:00 UTC – Slight activity limited to a period of about 10 hours, from 1 to 11 UTC, the maximum peak at 9 to 14 CC.
10/1 17:00 UTC – Very light activity during the central part of the day, the only significant peak reached 26 Hz at 4 UTC.
Frequency means how many wave cycle happen in a second, 1
Hz. means 1 cycle per second, 40 Hz. means 40 cycles per second,
Amplitude is the size of the vibration, how big is the wave, the chart
shows the frequency variation in Hz and the amplitude using the white
color.
Note
The Ancient Indian Rishis called 7.83 Hz the frequency of OM. It also happens to be Mother Earth’s natural heartbeat rhythm
Schumann resonances are named after professor
Schumann who was involved in early German secret space program and was
later paper-clipped into the United States. The frequencies of Schumann resonances are fairly stable and are mainly defined by the physical size of the ionospheric cavity.
The amplitude of Schumann resonances does
change and is bigger when ionospheric plasma gets excited. Ionospheric
plasma excitation happens because of solar activity, thunderstorms, use
of scalar plasma weapons and HAARP and lately also when the Light forces
are clearing the plasma anomaly.
Dependencies of Amplitudes Schumann Resonance October 20 2019
Dependencies of Quality Schumann Resonance October 20 2019
Dependencies of Frequency Schumann Resonance October 20 2019
All the SR daily images in one single pageSee the Images
Explanation of The Chart
The Schumann Resonance Spectrogram Chart
The Schumann Resonance Chart displays data from the magnetic field
detector to monitor the resonances occurring in the plasma waves
constantly circling the earth in the ionosphere. These three days
spectrograms show the activity occurring at the various resonant
frequencies from 1 to 40 Hz. Within the spectrogram, the power, or
intensity level of each frequency is displayed as a color, with white
being the most intense. The Schumann Resonances appear as the horizontal
lines at 0.0, 4.0, 8.0, 12.0, 16.0, 20.0, 24.0, 28.0, 32.0, 36.0 &
40.0 Hz. This chart is based on Tomsk, Russia, time UTC +7 (UTC =
Universal Time Coordinated).
What is a Spectrogram?
The Spectrogram Calendar is a visual representation of the range of
frequencies in the magnetic field at a given location. Similar to how an
equalizer displays the frequency content of music played on your
stereo, the spectrogram calendar displays the frequency content of a
magnetic field. Instead of showing a brief snapshot, it shows changes
over a period of time, in this case 3 days.
The local magnetic field is a dynamic field that changes constantly
because of variations in the ionosphere and sun and many other
influences not yet fully understood. The range of variation displayed in
the spectrogram chart is from 0 to 40 cycles per second. The vertical
axis is frequency and the horizontal axis is time. The amplitude of a
particular frequency at a specific time is represented by the intensity
of color (green, yellow, white) of each point in the image.
Editor’s Note: This is the daily report of Global News snippets furnished by Disclosure News Italia. Please read, investigate items of interest, and BE…