Schumann Resonance Today – Update ~ November 5, 2019


Editor’s Note: Above, we can see the latest graph for the Schumann Resonance which shows a very light scattering of short, but intense “feathering” of these energies. It is of significance for me to see this happening at the well-established pattern of 10-15 hour intervals.

Please view this graph, read the report, realize these energies are issued from the Earth is response to it’s receiving cosmic, photonic energies which affect all life on Earth, and BE…

InJoy!

___________________________________________________________________________________________

12

Schumann Resonance Today. We will try to keep you updated about the variations of the Resonance with this page. The great variations that nobody can explain but that give us a clear sign that the planet is changing. The Earth is vibration higher and higher, just like us!

The Chart time is based on Tomsk – Russia – UTC (Universal Time Coordinated) +7 Source

RS Base Frequency 7.83 Hz.

Schumann Resonance Today Peaks:

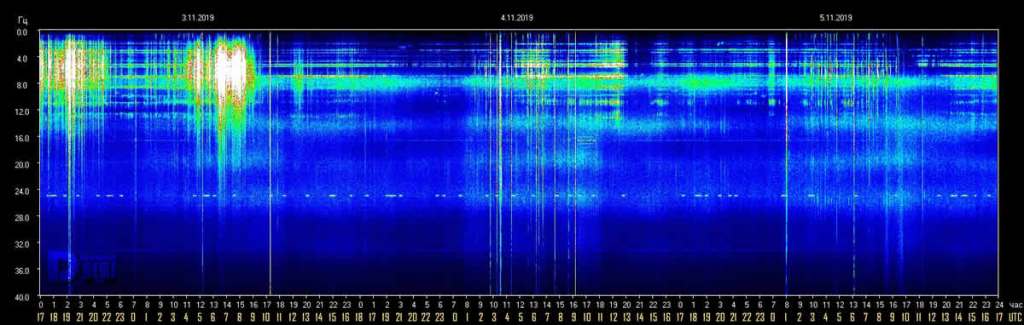
  • 11/4 17:00 UTC – Today’s activity is very similar to that of yesterday, slight movements from 1 to 8 UTC with the maximum value reached of Power 12.
  • 11/4 17:00 UTC – Today the calm has been almost total, very slight variations have reached Power 15 between 6 and 10 UTC.
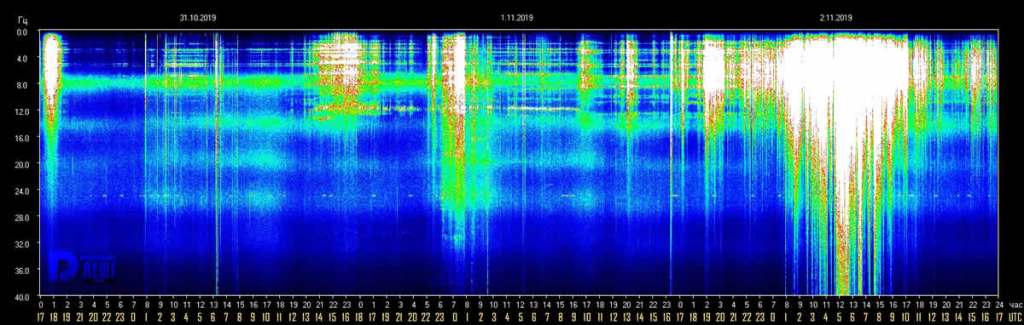
  • 11/3 17:00 UTC – During the last 24 hours reported in the chart there were only 3 significant short-term events, the first happened at 19 UTC of yesterday at Power 25, the second movement, which lasted about 2 hours, reached today’s maximum of Power 32 at 6:30 UTC and the last at 10 UTC at 23.
  • 11/2 17:00 UTC – We could recap today activity with how long the amplitude remained above 40: 6 hours, from 3 to 9 UTC. Today’s maximum is Power 98 as previously reported. From 11 UTC the values are back to normal.
  • 11/2 09:30 UTC – The strong activity that we see in progress at this time started decisively at the turn of the local midnight, corresponding to 17 UTC. Initially with peaks at Power 20, within two hours it reached 30 around 19 UTC. These first movements were followed by a period during which the amplitude was constantly oscillating between 10 and 20. At 1 UTC today, the very powerful activity began, bringing the amplitude close to Power 100. The maximum of Power 98 was reached at 5:30 UTC.
  • 11/1 17:00 UTC –  The situation shows the continuation of the variations also in this second part of the day where the greatest peak of today was had at Power 21.
  • 11/1 12:30 UTC – The new chart shows slight movements around midnight UTC that have reached Power 18, for the rest just ‘background’ movements around 10.
  • 10/31 17:00 UTC – Calm.
  • 10/31 11:30 UTC – At the local midnight, in the graph shown in white and corresponding to 17 UTC, we saw two slight variations that reached Power 20, from 19 UTC yesterday the situation is practically calm.
  • 10/30 17:00 UTC – In this second part of the day it was mainly calm except for an episode to 21 just before the 17 UTC.
  • 10/30 09:30 UTC – The situation seems to have calmed down, since the end of the activity yesterday around 15 UTC there were no fluctuations of amplitude until 1 UTC this morning when we begin to see slight movements. Up to now the maximum value has been around Power 21.
  • 10/29 17:00 UTC – Considering the beginning of this powerful movement, indicated on the graph on October 27th at 5 am, the almost continuous period of activity was of about 65 hours.
  • 10/29 13:30 UTC – Today up to now it has almost been a total white, for several hours, from 7 to 9 and from 10 to 11 UTC the amplitude was constantly above Power 70 with various exceedances even of the threshold of 80. The highest peak still remains that previously reported.
  • 10/29 08:30 UTC – We entered the third consecutive day of strong activity, after a few hours of pause at the local time midnight passage, from 22 UTC a new powerful movement began with amplitude variations that reached 40 at first to arrive with a gradual increase to Power 87 at 8 UTC.
  • 10/28 23:30 UTC – The new graph shows the activity still in progress, after a few hours of calm, thus bringing the consecutive hours of movements to 48. The last peak in order of time occurred at 22 UTC and reached Power 43.
  • 10/28 17:00 UTC – The peaks on the 40 are continuing, although in the last few hours there has been a slowdown now towards the end of today’s chart is shown an intensification of the variations, again around Power 40.
  • 10/28 11:00 UTC – The strong activity continues without interruption. This phase began on October 26th at 22 UTC so we are now at about 36 consecutive hours. Today’s peak was the strongest of this phase and reached Power 60 at 23 UTC yesterday. Currently the peaks are around 40.
  • 10/27 23:00 UTC – The strong activity did not stop, after a brief slowdown has resumed, from 20 UTC, with peaks over 40 Hz.
  • 10/27 17:00 UTC – The most significant part of today’s movements was from 11 to 15 UTC, during which the maximum peak of the day has been reached. The oscillations are continuing around Power 15.
  • 10/27 14:00 UTC – Today the activity started quite suddenly and within two hours it reached its first significant peak at 45 Hz at around midnight UTC. This was followed by other minor peaks up to the beginning of another phase of very intense activity that began at 10 UTC. From 11 UTC the amplitude was above 40 with a maximum at 50 at 12:30 UTC.
  • 10/26 17:00 UTC – Much of the day today was calm, the only activity, that reached a maximum amplitude of 25 occurred between 5 and 11 UTC.
  • 10/25 17:00 UTC – From 10 UTC the situation is calm.
  • 10/25 11:00 UTC – Today the activity is completely on another level compared to the last days. The series of movements in progress began yesterday at 13 UTC on the 25 Hz level, a few hours later, at 18 UTC it approached 30 and after a period of moderate fluctuations it reached its maximum peak so far, 58 at 3:30 UTC. After this strong movement we see a series of minor peaks on the 25 threshold.AUGUST Interactive PDF Archive
  • 10/24 17:00 UTC – A bit of movement returned from 13 to 15 UTC with two peaks that exceeded 20, the first at 24 and the second at 22. For the rest of the day it was calm.
  • 10/23 17:00 UTC – The sort of ‘vibration’ that we noticed yesterday is perceived to have continued until the morning of today, unfortunately it reached its maximum during the arc in which the data were not recorded, the peak is shown at 10 Hz during the descent of the amplitude towards normal values apparently started at 4 UTC.
  • 10/22 17:00 UTC – In today’s amplitude graph we can see a very slight and constantly increasing variation that began on the night between 20 and 21 October, it seems a sort of increasing vibration, as it is an amplitude it could be compared to an Om which from nothing increases, little by little but constantly. Now we are around Power 8.
  • 10/21 17:00 UTC – Another day of light activity, the only significant movement reached 11 at 11 chart local time, corresponding to 4 UTC.
  • 10/20 17:00 UTC – Very light activity, Power 10.
  • 10/20 10:00 UTC – Not much to report, the most relevant movement reached an amplitude of Power 16 just before 9 am UTC.
  • 10/19 17:00 UTC – Calm.
  • 10/18 17:00 UTC – The only significant activity of today has been reported previously, we are now in a situation of calm.
  • 10/18 10:00 UTC – A light activity continued after the previous series of peaks, the average has been around Power 20 from 18 to 22 UTC. Is seems the functionality on the TSU is still not fully recovered.
  • 10/17 17:00 UTC – In the part of the graph available for today we note 3 peaks one of Power 53, reported previously, the second of Power 57 at 10:15 UTC and the last minor at 25 at 12:40 UTC.
  • 10/17 08:30 UTC – From 6 UTC the data are available again and, like every self-respecting 17 in this last period, even today we have our peak with a power of 53 at 7:20 UTC. We hope that the problem has been solved and we can return to a normal flow of data.
  • 10/16 17:00 UTC – Still frozen at yesterday’s image, other sources report peaks for today at 20.
  • 10/15 17:00 UTC – Pitch black.
  • 10/15 10:00 UTC – This is the little we have for the last few days, lack of data. Other stations with different measurement report calm.
  • 10/14 17:00 UTC – For the little we can see the situation remained calm.
  • 10/14 09:30 UTC – The TSU site is back live but the interruption data is not available as seen from the large blank space in the chart. Looking for information on the web it seems that during this “void” period the situation remained almost calm. Currently we see very light movements at about 10 Hz.
  • 10/13 22:00 UTC – TSU website still down.
  • 10/12 17:00 UTC – TSU website is down, we will post an update as soon as it will return live.
  • 10/11 17:00 UTC – After several days of calm, from yesterday at 7:30 UTC, we are seeing a medium activity which, despite being uninterrupted, generated peaks of average amplitude. From 12 UTC today, a period of more significant movements began which reached the maximum peak at 59 Hz shortly after 15 UTC.
  • 10/10 17:00 UTC – Today the activity has returned more significantly since 1 UTC. The first significant variation started at 7:30 UTC and within few hours reached the maximum of 42 Hz at 9:45 UTC. The movements are continuing.
  • 10/9 17:00 UTC – The light activity continues, the peak of today has reached 13 Hz shortly after 9 UTC. A black vertical line is visible in the chart, it’s due to missing data.
  • 10/8 17:00 UTC – Almost calm, maximum 13 Hz at 10 UTC.
  • 10/7 17:00 UTC – Even today very light activity, the maximum of 17 Hz was reached shortly after 4 UTC. This slight activity however lasted from midnight to 15 UTC.
  • 10/6 17:00 UTC – Calm.
  • 10/5 17:00 UTC – Calm.
  • 10/4 17:00 UTC – Practically calm, peak at 13 Hz at 11 UTC.
  • 10/3 17:00 UTC – The pattern of slight daily increase, seems to be underway again, the activity saw a first isolated peak at 1 UTC which reached 17 CC and later, during a more relevant phase, 22 CC at 6:30 UTC.
  • 10/2 17:00 UTC – Slight activity limited to a period of about 10 hours, from 1 to 11 UTC, the maximum peak at 9 to 14 CC.
  • 10/1 17:00 UTC – Very light activity during the central part of the day, the only significant peak reached 26 Hz at 4 UTC.

Frequency means how many wave cycle happen in a second, 1 Hz. means 1 cycle per second, 40 Hz. means 40 cycles per second, Amplitude is the size of the vibration, how big is the wave, the chart shows the frequency variation in Hz and the amplitude using the white color.

Note

The Ancient Indian Rishis called 7.83 Hz the frequency of OM. It also happens to be Mother Earth’s natural heartbeat rhythm Schumann resonances are named after professor Schumann who was involved in early German secret space program and was later paper-clipped into the United States. The frequencies of Schumann resonances are fairly stable and are mainly defined by the physical size of the ionospheric cavity.   The amplitude of Schumann resonances does change and is bigger when ionospheric plasma gets excited. Ionospheric plasma excitation happens because of solar activity, thunderstorms, use of scalar plasma weapons and HAARP and lately also when the Light forces are clearing the plasma anomaly.

Dependencies Amplitudes Schumann Resonance 31-12-2018

Dependencies of Amplitudes Schumann Resonance November 5 2019

Dependencies of Quality Schumann Resonance

Dependencies of Quality Schumann Resonance Novembre 5 2019

Dependencies of Quality Schumann Resonance

Dependencies of Frequency Schumann Resonance November 5 2019

Schumann Resonance Differential Peaks

Read

Schumann Resonance PDF Archives

Read and Download

Images Archive

All the SR daily images in one single pageSee the Images

Web Hosting
Explanation of The Chart

The Schumann Resonance Spectrogram Chart

The Schumann Resonance Chart displays data from the magnetic field detector to monitor the resonances occurring in the plasma waves constantly circling the earth in the ionosphere. These three days spectrograms show the activity occurring at the various resonant frequencies from 1 to 40 Hz. Within the spectrogram, the power, or intensity level of each frequency is displayed as a color, with white being the most intense. The Schumann Resonances appear as the horizontal lines at 0.0, 4.0, 8.0, 12.0, 16.0, 20.0, 24.0, 28.0, 32.0, 36.0 & 40.0 Hz. This chart is based on Tomsk, Russia, time UTC +7 (UTC = Universal Time Coordinated).

What is a Spectrogram?

The Spectrogram Calendar is a visual representation of the range of frequencies in the magnetic field at a given location. Similar to how an equalizer displays the frequency content of music played on your stereo, the spectrogram calendar displays the frequency content of a magnetic field. Instead of showing a brief snapshot, it shows changes over a period of time, in this case 3 days.

The local magnetic field is a dynamic field that changes constantly because of variations in the ionosphere and sun and many other influences not yet fully understood. The range of variation displayed in the spectrogram chart is from 0 to 40 cycles per second. The vertical axis is frequency and the horizontal axis is time. The amplitude of a particular frequency at a specific time is represented by the intensity of color (green, yellow, white) of each point in the image.

Ampiezza e Periodo

What is the Schumann Resonance?

The Herathbeat of Planet EarthRead

🙂

Clicks on the Ads Keep Us Alive

Pills Disclosure News Italia

Violence

Returning violence for violence multiplies violence, adding deeper darkness to a night already devoid of stars. Darkness cannot drive out darkness: only love can do that.

Martin Luther King

Moments Of Discomfort – Aya – Pleiadian Collective ~ November 4, 2019


Editor’s Note: Below are words of comfort that all is not lost as we continue our journey of 3D life.No…circumstances can be not as many would choose, and this is the time to remain focus, or refocus, on Love and the power of Love!

Please read below, are you in Love with this 3D life (?), and BE…

InJoy!

___________________________________________________________________________________________

Moments Of Discomfort – Pleiadian Collective. By Kabamur Taygeta.

AYA

About Kabamur – One of Many, Many of One – Pleiadian Collective
🙂

Clicks on the Ads Keep Us Alive

Moments Of Discomfort - Aya - Pleiadian Collective

I

When Perceived Moments Of Discomfort Or Anxiety,

Seem To Settle Over You And Disrupt Your Field And Change Your Plans;

Perhaps Exactly In The Moment You Felt All Was Finally Going Your Way;

Moments Of Discomfort - Aya - Pleiadian Collective

II

When You Followed All The Prescriptions Of Wisdom,

And You Finally Got That Smile Back!

And You Were Just Coasting Along Feeling, ‘I Got This!’

Then Suddenly, The Ground Seems To Give Way Beneath Your Feet!

Moments Of Discomfort - Aya - Pleiadian Collective

III

The Sky Turns Dark And It Is Cold And Bleak.

Friends Or Family Let You Down And The News You Hear Is Clearly Lies!

Beloved Ones! Sweet Angels!

What Is Going On?

Breathe!

Moments Of Discomfort - Aya - Pleiadian Collective

IV

Each Moment Is Happening For You And Not Against You!

Each Moment Will Not Look Great But Nothing Stays The Same!

When There Is A Space Of Loss, No Matter What The Cause,

The Universe Will Fill That Space With A Higher Frequency Of Beings And Events!

Be Still And Allow!

Moments Of Discomfort - Aya - Pleiadian Collective

V

Do Not Move Or Decide Anything While Feeling Chaotic!

This Is Only Energy And Allow It To Settle.

Close Your Eyes And Ask God To Bring The Best Outcome For You!

This Might Come To You In A Very Different Form Than You Would Choose While Upset!

Moments Of Discomfort - Aya - Pleiadian Collective

VI

Become Serene In Knowing That All Things Work Together For Good To Those That Choose Love!

See The Big Picture And Refuse To Engage In Conflict!

No Doctrine, One Creator! One Love! One Peace!

Moments Of Discomfort - Aya - Pleiadian Collective

VII

Fall In Love With All That Is Good,

And Allow Source Creator To Take Care Of The Rest!

I Love You With My Whole Being!

Soon We Rise!

Moments Of Discomfort

Aya

We Are The Pleiadian Collective!

Pleiadian Collective

See all Posts

🙂

Clicks on the Ads Keep Us Alive

Pills Disclosure News Italia

Man

Our virtues and our failings are inseparable, like force and matter. When they separate, man is no more.

Nikola Tesla

News Burst 4 November 2019 ~ November 4, 2019


News Burst 4 November 2019. By Disclosure News.

🙂

Clicks on the Ads Keep Us Alive

News Burst 4 November 2019

  • France is about to introduce an educational module to its high school curriculum that covers Bitcoin and Cryptocurrencies.
  • Democrat Beto O’Rourke dropped out of the crowded 2020 U.S. presidential race on Friday, saying it had become clear his campaign did not have the resources to continue to seek his party’s nomination.
  • Hong Kong anti-government protesters crowded a shopping mall in running clashes with police on Sunday during which a man with a knife slashed several people and apparently bit off part of a local politician’s ear.
  • British Prime Minister Boris Johnson said Sunday he would rule out a new referendum on Scottish independence, saying he would not give the go-ahead for another legally-binding vote while he is at 10 Downing Street.
  • The national capital of India, Delhi, was on Sunday engulfed by a dense, noxious smog that reduced visibility, brought air quality to its worst level since 2016, 16 times safe limit.

Daylight Saving Time

  • Benjamin Franklin is often credited with the idea of Daylight Saving Time because, in a satirical letter to the authors of The Journal of Paris, he suggested the French wake earlier to take advantage of “using sunshine instead of candles.”
  • DST as we know it was proposed by a New Zealand entomologist, George Vernon Hudson, who wanted longer hours for insect study.
  • The first locality to enact DST was Port Arthur (now Thunder Bay, Ontario), Canada, in 1908. The first country to enact DST was Germany on Apr. 30, 1916, although the Germans dropped the time change at war’s end.
  • American farmers were opposed to DST because, regardless of what the clock said, their cows weren’t ready to be milked until later in the day during DST.
  • A resort in Madagascar created its own DST, which runs an hour ahead of the rest of the country, so the lemurs would “naturally join us in the Oasis garden… for the ‘5 O’clock tea.’”
  • Some ancient civilizations are known to have used practices similar to DST. Roman water clocks, for example, used different scales for different times of the year.

Strongest EQ in Europe M3.3 Bosnia
Strongest EQ in US M4.2 California
Strongest EQ on the Planet M5.7 Argentina
Deepest EQ M4.3 626 km Vanuatu – M4.6 578 km South of Fiji News Burst 4 November 2019

Schumann Resonance Today – Update ~ November 3, 2019


Editor’s Note: Oops…no new graph of the Schumann Resonance is available today. These graphs stem from Tomsk, Russia…perhaps transmission problems are the issue?

However, please not the intense energies released by Mother Earth yesterday in response to receiving yet more (and more) cosmic energies. This undoubtedly raising the frequency of our planet, and…you and I! Please read below, learn why you may feel the way you do, and BE…

inJoy!

___________________________________________________________________________________________

98

Schumann Resonance Today. We will try to keep you updated about the variations of the Resonance with this page. The great variations that nobody can explain but that give us a clear sign that the planet is changing. The Earth is vibration higher and higher, just like us!

The Chart time is based on Tomsk – Russia – UTC (Universal Time Coordinated) +7 Source

RS Base Frequency 7.83 Hz.

Schumann Resonance Today Peaks:

  • 11/2 17:00 UTC – We could recap today activity with how long the amplitude remained above 40: 6 hours, from 3 to 9 UTC. Today’s maximum is Power 98 as previously reported. From 11 UTC the values are back to normal.
  • 11/2 09:30 UTC – The strong activity that we see in progress at this time started decisively at the turn of the local midnight, corresponding to 17 UTC. Initially with peaks at Power 20, within two hours it reached 30 around 19 UTC. These first movements were followed by a period during which the amplitude was constantly oscillating between 10 and 20. At 1 UTC today, the very powerful activity began, bringing the amplitude close to Power 100. The maximum of Power 98 was reached at 5:30 UTC.
  • 11/1 17:00 UTC –  The situation shows the continuation of the variations also in this second part of the day where the greatest peak of today was had at Power 21.
  • 11/1 12:30 UTC – The new chart shows slight movements around midnight UTC that have reached Power 18, for the rest just ‘background’ movements around 10.
  • 10/31 17:00 UTC – Calm.
  • 10/31 11:30 UTC – At the local midnight, in the graph shown in white and corresponding to 17 UTC, we saw two slight variations that reached Power 20, from 19 UTC yesterday the situation is practically calm.
  • 10/30 17:00 UTC – In this second part of the day it was mainly calm except for an episode to 21 just before the 17 UTC.
  • 10/30 09:30 UTC – The situation seems to have calmed down, since the end of the activity yesterday around 15 UTC there were no fluctuations of amplitude until 1 UTC this morning when we begin to see slight movements. Up to now the maximum value has been around Power 21.
  • 10/29 17:00 UTC – Considering the beginning of this powerful movement, indicated on the graph on October 27th at 5 am, the almost continuous period of activity was of about 65 hours.
  • 10/29 13:30 UTC – Today up to now it has almost been a total white, for several hours, from 7 to 9 and from 10 to 11 UTC the amplitude was constantly above Power 70 with various exceedances even of the threshold of 80. The highest peak still remains that previously reported.
  • 10/29 08:30 UTC – We entered the third consecutive day of strong activity, after a few hours of pause at the local time midnight passage, from 22 UTC a new powerful movement began with amplitude variations that reached 40 at first to arrive with a gradual increase to Power 87 at 8 UTC.
  • 10/28 23:30 UTC – The new graph shows the activity still in progress, after a few hours of calm, thus bringing the consecutive hours of movements to 48. The last peak in order of time occurred at 22 UTC and reached Power 43.
  • 10/28 17:00 UTC – The peaks on the 40 are continuing, although in the last few hours there has been a slowdown now towards the end of today’s chart is shown an intensification of the variations, again around Power 40.
  • 10/28 11:00 UTC – The strong activity continues without interruption. This phase began on October 26th at 22 UTC so we are now at about 36 consecutive hours. Today’s peak was the strongest of this phase and reached Power 60 at 23 UTC yesterday. Currently the peaks are around 40.
  • 10/27 23:00 UTC – The strong activity did not stop, after a brief slowdown has resumed, from 20 UTC, with peaks over 40 Hz.
  • 10/27 17:00 UTC – The most significant part of today’s movements was from 11 to 15 UTC, during which the maximum peak of the day has been reached. The oscillations are continuing around Power 15.
  • 10/27 14:00 UTC – Today the activity started quite suddenly and within two hours it reached its first significant peak at 45 Hz at around midnight UTC. This was followed by other minor peaks up to the beginning of another phase of very intense activity that began at 10 UTC. From 11 UTC the amplitude was above 40 with a maximum at 50 at 12:30 UTC.
  • 10/26 17:00 UTC – Much of the day today was calm, the only activity, that reached a maximum amplitude of 25 occurred between 5 and 11 UTC.
  • 10/25 17:00 UTC – From 10 UTC the situation is calm.
  • 10/25 11:00 UTC – Today the activity is completely on another level compared to the last days. The series of movements in progress began yesterday at 13 UTC on the 25 Hz level, a few hours later, at 18 UTC it approached 30 and after a period of moderate fluctuations it reached its maximum peak so far, 58 at 3:30 UTC. After this strong movement we see a series of minor peaks on the 25 threshold.AUGUST Interactive PDF Archive
  • 10/24 17:00 UTC – A bit of movement returned from 13 to 15 UTC with two peaks that exceeded 20, the first at 24 and the second at 22. For the rest of the day it was calm.
  • 10/23 17:00 UTC – The sort of ‘vibration’ that we noticed yesterday is perceived to have continued until the morning of today, unfortunately it reached its maximum during the arc in which the data were not recorded, the peak is shown at 10 Hz during the descent of the amplitude towards normal values apparently started at 4 UTC.
  • 10/22 17:00 UTC – In today’s amplitude graph we can see a very slight and constantly increasing variation that began on the night between 20 and 21 October, it seems a sort of increasing vibration, as it is an amplitude it could be compared to an Om which from nothing increases, little by little but constantly. Now we are around Power 8.
  • 10/21 17:00 UTC – Another day of light activity, the only significant movement reached 11 at 11 chart local time, corresponding to 4 UTC.
  • 10/20 17:00 UTC – Very light activity, Power 10.
  • 10/20 10:00 UTC – Not much to report, the most relevant movement reached an amplitude of Power 16 just before 9 am UTC.
  • 10/19 17:00 UTC – Calm.
  • 10/18 17:00 UTC – The only significant activity of today has been reported previously, we are now in a situation of calm.
  • 10/18 10:00 UTC – A light activity continued after the previous series of peaks, the average has been around Power 20 from 18 to 22 UTC. Is seems the functionality on the TSU is still not fully recovered.
  • 10/17 17:00 UTC – In the part of the graph available for today we note 3 peaks one of Power 53, reported previously, the second of Power 57 at 10:15 UTC and the last minor at 25 at 12:40 UTC.
  • 10/17 08:30 UTC – From 6 UTC the data are available again and, like every self-respecting 17 in this last period, even today we have our peak with a power of 53 at 7:20 UTC. We hope that the problem has been solved and we can return to a normal flow of data.
  • 10/16 17:00 UTC – Still frozen at yesterday’s image, other sources report peaks for today at 20.
  • 10/15 17:00 UTC – Pitch black.
  • 10/15 10:00 UTC – This is the little we have for the last few days, lack of data. Other stations with different measurement report calm.
  • 10/14 17:00 UTC – For the little we can see the situation remained calm.
  • 10/14 09:30 UTC – The TSU site is back live but the interruption data is not available as seen from the large blank space in the chart. Looking for information on the web it seems that during this “void” period the situation remained almost calm. Currently we see very light movements at about 10 Hz.
  • 10/13 22:00 UTC – TSU website still down.
  • 10/12 17:00 UTC – TSU website is down, we will post an update as soon as it will return live.
  • 10/11 17:00 UTC – After several days of calm, from yesterday at 7:30 UTC, we are seeing a medium activity which, despite being uninterrupted, generated peaks of average amplitude. From 12 UTC today, a period of more significant movements began which reached the maximum peak at 59 Hz shortly after 15 UTC.
  • 10/10 17:00 UTC – Today the activity has returned more significantly since 1 UTC. The first significant variation started at 7:30 UTC and within few hours reached the maximum of 42 Hz at 9:45 UTC. The movements are continuing.
  • 10/9 17:00 UTC – The light activity continues, the peak of today has reached 13 Hz shortly after 9 UTC. A black vertical line is visible in the chart, it’s due to missing data.
  • 10/8 17:00 UTC – Almost calm, maximum 13 Hz at 10 UTC.
  • 10/7 17:00 UTC – Even today very light activity, the maximum of 17 Hz was reached shortly after 4 UTC. This slight activity however lasted from midnight to 15 UTC.
  • 10/6 17:00 UTC – Calm.
  • 10/5 17:00 UTC – Calm.
  • 10/4 17:00 UTC – Practically calm, peak at 13 Hz at 11 UTC.
  • 10/3 17:00 UTC – The pattern of slight daily increase, seems to be underway again, the activity saw a first isolated peak at 1 UTC which reached 17 CC and later, during a more relevant phase, 22 CC at 6:30 UTC.
  • 10/2 17:00 UTC – Slight activity limited to a period of about 10 hours, from 1 to 11 UTC, the maximum peak at 9 to 14 CC.
  • 10/1 17:00 UTC – Very light activity during the central part of the day, the only significant peak reached 26 Hz at 4 UTC.

Frequency means how many wave cycle happen in a second, 1 Hz. means 1 cycle per second, 40 Hz. means 40 cycles per second, Amplitude is the size of the vibration, how big is the wave, the chart shows the frequency variation in Hz and the amplitude using the white color.

Note

The Ancient Indian Rishis called 7.83 Hz the frequency of OM. It also happens to be Mother Earth’s natural heartbeat rhythm Schumann resonances are named after professor Schumann who was involved in early German secret space program and was later paper-clipped into the United States. The frequencies of Schumann resonances are fairly stable and are mainly defined by the physical size of the ionospheric cavity.   The amplitude of Schumann resonances does change and is bigger when ionospheric plasma gets excited. Ionospheric plasma excitation happens because of solar activity, thunderstorms, use of scalar plasma weapons and HAARP and lately also when the Light forces are clearing the plasma anomaly.

Dependencies Amplitudes Schumann Resonance 31-12-2018

Dependencies of Amplitudes Schumann Resonance November 2 2019

Dependencies of Quality Schumann Resonance

Dependencies of Quality Schumann Resonance Novembre 2 2019

Dependencies of Quality Schumann Resonance

Dependencies of Frequency Schumann Resonance November 2 2019

Schumann Resonance Differential Peaks

Read

Schumann Resonance PDF Archives

Read and Download

Images Archive

All the SR daily images in one single pageSee the Images

Web Hosting
Explanation of The Chart

The Schumann Resonance Spectrogram Chart

The Schumann Resonance Chart displays data from the magnetic field detector to monitor the resonances occurring in the plasma waves constantly circling the earth in the ionosphere. These three days spectrograms show the activity occurring at the various resonant frequencies from 1 to 40 Hz. Within the spectrogram, the power, or intensity level of each frequency is displayed as a color, with white being the most intense. The Schumann Resonances appear as the horizontal lines at 0.0, 4.0, 8.0, 12.0, 16.0, 20.0, 24.0, 28.0, 32.0, 36.0 & 40.0 Hz. This chart is based on Tomsk, Russia, time UTC +7 (UTC = Universal Time Coordinated).

What is a Spectrogram?

The Spectrogram Calendar is a visual representation of the range of frequencies in the magnetic field at a given location. Similar to how an equalizer displays the frequency content of music played on your stereo, the spectrogram calendar displays the frequency content of a magnetic field. Instead of showing a brief snapshot, it shows changes over a period of time, in this case 3 days.

The local magnetic field is a dynamic field that changes constantly because of variations in the ionosphere and sun and many other influences not yet fully understood. The range of variation displayed in the spectrogram chart is from 0 to 40 cycles per second. The vertical axis is frequency and the horizontal axis is time. The amplitude of a particular frequency at a specific time is represented by the intensity of color (green, yellow, white) of each point in the image.

Ampiezza e Periodo

What is the Schumann Resonance?

The Herathbeat of Planet EarthRead

🙂

Clicks on the Ads Keep Us Alive

Pills Disclosure News Italia

Together

Me only have one ambition, y’know. I only have one thing I really like to see happen. I like to see mankind live together – black, white, Chinese, everyone – that’s all.

Bob Marley

8kun QAnon Update – November 2 2019 ~ posted November 3, 2019


8kun.net is online, the more mature and savvy replacement of 8chan and its board qresearch and patriotfight. Lets wait and see when we will get the first QAnon bread.

We have made sweeping network architectural changes and there might still be bugs and kinks to work out. Probably we wont be very stable in the first couple days as we adjust to traffic and attacks.

Getting hit with huge traffic right now. Please be patient as we stabilize the network. Could be a few days before things are really working well again. – Ron – @CodeMonkeyZ

That first wave of visitors totally crushed our servers. Needed to reboot. Things may be a little rocky out the gate. We’ll do our best to shore up as needed. – Is It Wet Yet? @isitwetyet

This Is Not a R vs D Battle QAnon

QAnon Achive

Go To Page

🙂

Clicks on the Ads Keep Us Alive

Pills Disclosure News Italia

Creativity

I’m always thinking about creating. My future starts when I wake up every morning… Every day I find something creative to do with my life.

Miles Davis