Editor’s Note: This particular message from our Pleiadian friends seems significant due to the percentages given for various actions all are very close to being completed, just sayin…
Might be a good time to know your heart, Love your individual heart’s place in the bigger picture, and BE…
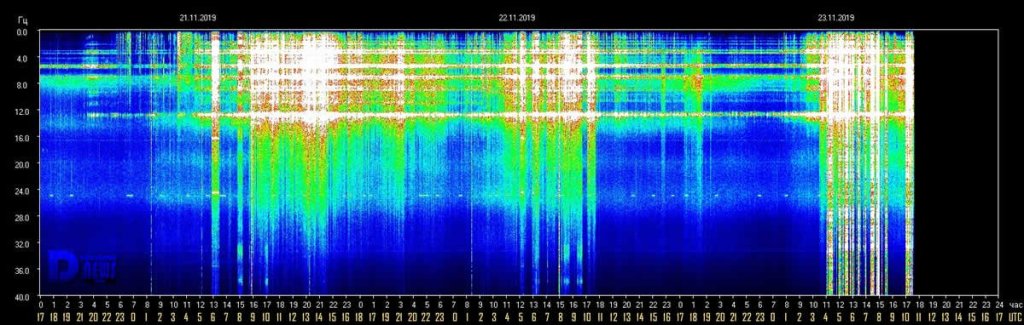
Editor’s Note: We see an updated chart for the Schumann Resonance energies above which shows significant activity for both amplitude and density. This occurred overnight in the USA from 10pm through 5:30am in a series of multiple spikes.
This bout of energy release also follows the well established cyclical pattern for occurring every roughly 10-15 hours. Please view this chart, see how energies of all types are changing our world, and BE…
Schumann Resonance Today. We will
try to keep you updated about the variations of the Resonance with this
page. The great variations that nobody can explain but that give us a
clear sign that the planet is changing. The Earth is vibration higher
and higher, just like us!
The Chart time is based on Tomsk – Russia – UTC (Universal Time Coordinated) +7Source
RS Base Frequency 7.83 Hz.
Schumann Resonance Today Peaks:
11/23 11:00 UTC – The
period of calm lasted about 14 hours, it was interrupted today at 3 UTC
when quite significant variations began which, within two hours, brought
the amplitude values between Power 25 and 30. Remaining constantly on
those values, at 8 am UTC, we had what so far has been the maximum peak
at Power 41. The activity is continuing.
11/22 17:00 UTC – In the early part of today we had the most
significant activity, from 4 to 10 UTC a series of peaks on the 20 with
the maximum at P25 just after 10 UTC.
11/22 11:00 UTC – The activity started yesterday is continuing but
at lower values, today the significant part began at 4 UTC and remained
on Power 20 threshold since than with a peak Power 25 at 10 UTC.
11/21 17:00 UTC – From this morning to 5 UTC since this period of
activity began, there has been a constant increase in the maximum values
reached, Power 33 was reached at 14 UTC. Right now we are around Power
15.
11/21 11:00 UTC – After 3 days of calm today we are seeing new
activity, from 5 UTC there have been some variations initially at Power
20 and at 10 UTC at the peak until now at Power 23.
11/20 17:00 UTC – Third day of total calm.
11/19 17:00 UTC – Calm.
11/18 17:00 UTC – Today we returned to a condition of very light
activity, there were only two movements that exceeded Power 10, 16 at 6
UTC and 11 at 11 UTC.
11/17 17:00 UTC – The strong activity, that seems to have ended at 9
UTC today, lasted 20 hours. The highest peaks occurred in its initial
part which took place yesterday, today the highest value was Power 30 as
previously reported.
11/17 09:00 UTC – Today is the 17th, lately a day of recurring SR
activity, and the movements started yesterday continued uninterrupted,
the peaks are not at very high values, Power 37 was reached at 00 UTC
today, but the values remained constantly around Power 30.
11/16 23:00 UTC – The strong activity continued but with slightly
less intensity, this period of strong variations started at 6 UTC and
has been above Power 40 for 2 hours, from 15 to 17 UTC. At this time the
maximum values are around Power 30.
11/16 17:00 UTC – Today’s chart shows an initial long period of flat
calm until 1 UTC when very light movements have brought the variations
to reach Power 10 at 9 UTC. From here the movements started to become
more consistent up to starting a strong activity period from 13 UTC
during which the today’s maximum value of Power 46 was reached. It seems
that the movements should also continue in the new chart of Nov. 17th.
11/15 17:00 UTC – The movements continued and grew steadily until 10
UTC when it reached today’s high at Power 22 to returned to normal
values just after.
11/15 09:00 UTC – Shortly after midnight local time from the graph,
corresponding to 17 UTC, we saw a slow and gradual increase in amplitude
values that reached Power 17 at 8 UTC. It seems that the activity
should continue.
11/14 17:00 UTC – Virtually calm, only a few slight movements between 3 and 5 UTC with a maximum of Power 13.
11/13 17:00 UTC – Calm.
11/13 15:00 UTC – The first part of today’s chart day shows absolute
calm, from 1 UTC there are very light movements that have given way to
the light activity of today that lasted for the central part of today’s
chart. During this phase there were 3 peaks that exceeded 20 and others
that touched it, Power 24 was reached at around 6 UTC.
11/12 17:00 UTC – Today’s activity took place over a period of 9
hours, from 3 to 12 UTC, the most intense part with the maximum value of
today as reported previously was from 5 to 8 UTC. The situation is now
shown to be calm.
11/12 08:00 UTC – After several days of intense calm we come to a
new series of movements characterized by rather significant peaks. The
changes started suddenly at 3 UTC and in the span of four hours, at 7
UTC, there was the strongest peak so far at Power 48.
11/11 17:00 UTC – Today was mostly calm, the only variations with a maximum of Power 14 occurred from 7:30 to 9:30 UTC.
11/10 17:00 UTC – Calm.
11/10 11:00 UTC – Not much to say, compared to the calm we see only the “streaks” on the Power 10.
11/9 17:00 UTC – The series of light movements continued without
interruption, a slight drop to values close to calm took place in the
last hours.
11/9 11:30 UTC – In this first part of the day the movements
continued, increasing numerically but with less powerful amplitude
variations whose maximum was Power 25 at 2:30 UTC.
11/8 17:00 UTC – The series of most significant movements of today
lasted about eight hours, from 3 to 11 UTC with the peaks previously
reported, this period has been followed by more slight movements.
11/8 10:30 UTC – From today’s image, we can see how in the last
three days there has been a sort of sequence of movements characterized
by a constant increasing trend, will this coincidentally reach its
maximum on 11 November? The significant peaks of today started at 3, at 6
UTC reached 35 and just before 10 the maximum value of these last 3
days, Power 43.
11/7 17:00 UTC – Slight movements have continued throughout the day,
the highest peak is the one reported previously but shortly after 9 UTC
we can see another variation that has reached Power 27.
11/7 09:00 UTC – The graph in the first part of today shows how the
constant slight movement that began yesterday is continuing. Today we
have had the strongest peak of these last 3 days and reached Power 32 at
3 UTC.
11/6 17:00 UTC – After a couple of days of relative calm today,
shortly after midnight UTC, movements began again which gradually
brought the current peak value of Power 23 to 9:30 UTC. Activity has not
stopped but has continued and at present it seems to see a crescendo
that will lead to higher values.
11/5 17:00 UTC – Today’s activity is very similar to that of
yesterday, slight movements from 1 to 8 UTC with the maximum
value reached of Power 12.
11/4 17:00 UTC – Today the calm has been almost total, very slight variations have reached Power 15 between 6 and 10 UTC.
11/3 17:00 UTC – During the last 24 hours reported in the chart
there were only 3 significant short-term events, the first happened at
19 UTC of yesterday at Power 25, the second movement, which lasted about
2 hours, reached today’s maximum of Power 32 at 6:30 UTC and the last
at 10 UTC at 23.
11/2 17:00 UTC – We could recap today activity with how long the
amplitude remained above 40: 6 hours, from 3 to 9 UTC. Today’s maximum
is Power 98 as previously reported. From 11 UTC the values are back to
normal.
11/2 09:30 UTC – The strong activity that we see in progress at this
time started decisively at the turn of the local midnight,
corresponding to 17 UTC. Initially with peaks at Power 20, within two
hours it reached 30 around 19 UTC. These first movements were followed
by a period during which the amplitude was constantly
oscillating between 10 and 20. At 1 UTC today, the very powerful
activity began, bringing the amplitude close to Power 100. The maximum of Power 98 was reached at 5:30 UTC.
11/1 17:00 UTC – The situation shows the continuation of the
variations also in this second part of the day where the greatest peak
of today was had at Power 21.
11/1 12:30 UTC – The new chart shows slight movements around
midnight UTC that have reached Power 18, for the rest just ‘background’
movements around 10.
Frequency means how many wave cycle happen in a second, 1
Hz. means 1 cycle per second, 40 Hz. means 40 cycles per second,
Amplitude is the size of the vibration, how big is the wave, the chart
shows the frequency variation in Hz and the amplitude using the white
color.
Note
The Ancient Indian Rishis called 7.83 Hz the frequency of OM. It also happens to be Mother Earth’s natural heartbeat rhythm
Schumann resonances are named after professor
Schumann who was involved in early German secret space program and was
later paper-clipped into the United States. The frequencies of Schumann resonances are fairly stable and are mainly defined by the physical size of the ionospheric cavity.
The amplitude of Schumann resonances does
change and is bigger when ionospheric plasma gets excited. Ionospheric
plasma excitation happens because of solar activity, thunderstorms, use
of scalar plasma weapons and HAARP and lately also when the Light forces
are clearing the plasma anomaly.
Dependencies of Amplitudes Schumann Resonance November 23 2019
Dependencies of Quality Schumann Resonance Novembre 22 2019
Dependencies of Frequency Schumann Resonance November 22 2019
All the SR daily images in one single pageSee the Images
Explanation of The Chart
The Schumann Resonance Spectrogram Chart
The Schumann Resonance Chart displays data from the magnetic field
detector to monitor the resonances occurring in the plasma waves
constantly circling the earth in the ionosphere. These three days
spectrograms show the activity occurring at the various resonant
frequencies from 1 to 40 Hz. Within the spectrogram, the power, or
intensity level of each frequency is displayed as a color, with white
being the most intense. The Schumann Resonances appear as the horizontal
lines at 0.0, 4.0, 8.0, 12.0, 16.0, 20.0, 24.0, 28.0, 32.0, 36.0 &
40.0 Hz. This chart is based on Tomsk, Russia, time UTC +7 (UTC =
Universal Time Coordinated).
What is a Spectrogram?
The Spectrogram Calendar is a visual representation of the range of
frequencies in the magnetic field at a given location. Similar to how an
equalizer displays the frequency content of music played on your
stereo, the spectrogram calendar displays the frequency content of a
magnetic field. Instead of showing a brief snapshot, it shows changes
over a period of time, in this case 3 days.
The local magnetic field is a dynamic field that changes constantly
because of variations in the ionosphere and sun and many other
influences not yet fully understood. The range of variation displayed in
the spectrogram chart is from 0 to 40 cycles per second. The vertical
axis is frequency and the horizontal axis is time. The amplitude of a
particular frequency at a specific time is represented by the intensity
of color (green, yellow, white) of each point in the image.
This video is a perfect example of how repetition of the same
talking points/phrases is used to brainwash the public aka “Operation
Mockingbird”.
QAnon November 22 2019 – Think non_public
“A finding of alleged wrongdoing from Horowitz could further
fuel Republican criticism and conspiracies about previous investigators’
targeting of Trump associates”
CNN published this story tonight at 6:32pm. Q one min later (6:33pm): “Information warfare.”
LM@LindseyGrahamSC says IG rpt re: FISA abuse to be released on 9
Dec & Horowitz will testify on 11 Dec. CNN already leaking &
spinning. Drop from 28 Jul ’18 gives us a preview of what we will see in
the report. FISA = START.
Game over for Deep State.
QAnon November 22 2019 – Think non_public
THE GREAT AWAKENING. You are the news now. Handle w/ care. Q
This was taken at #ThePeoplesBridge in Chicago. @whaleswarrior
is red pilling Chicago one sign at a time! Kudos to @Solmemes1 for the Q
shout-out!
QAnon November 22 2019 – Think non_public
From 27 Apr ’18: #”2/S/P 302 mod?” McCabe (#2), Strzok, Page modified a 302 (interview report/summary).
The CNN story is about edits to a FISA doc (presumably for Carter
Page). The story has been updated to reflect the individual is a former
FBI lawyer. Lisa Page?
QAnon November 22 2019 – Think non_public
Q !!mG7VJxZNCI ID: 000000 No.7359354 Nov 21 2019 02:16:49 (EST)
There is a scheduled salt rotation for this coming Monday@8pm est. This is a routine procedure; when it happens, bans are reset, post histories start fresh, and secure tripcodes change.
/CM/ Platform not fully functional / stable. Pic uploads not secure / functional. Suggest update delay to prevent IDEN re-check re: trip update failure until platform stabilized. Q
@CodeMonkeyZ explained weeks ago Q’s tripcode is hashed with
server side salt > same trip used on 8chan. Tonight he tweeted re:
salt rotation which would change all tripcodes. Q suggests a delay so
they won’t need to revalidate identity with new tripcode.
QAnon November 22 2019 – Think non_public
Q !!mG7VJxZNCI ID: 000000 No.7359408 Nov 22 2019 02:18:33 (EST)
Ron ID: 000000 No.7359370 Nov 21 2019 02:39:58 (UTC)
>>7359354
Images that are served via TOR broke yesterday, we are checking why and should have it fixed up soon. Caching is still a bit buggy, and likewise we should have that fixed up soon. I will do my best to have these things fixed up before the end of the weekend.
An easy way to verify yourself after the upcoming salt rotation is: 1. Migrate /patriotsfight/ before the rotation 2. Post with current tripcode on /patriotsfight/ 3. After salt rotation, post with new tripcode on /patriotsfight/ 4. Qresearch BO adds your updated tripcode to the /qresearch/ whitelist
The salt rotation is an important maintenance task, and will help improve overall site stability.
Our current tasks to get back to full stability:
0. Salt rotation 1. Fix quality-of-life bugs (caching, images, etc) 2. Launch project odin (checkmate against deplatforming) 3. Finish board migration 4. Migrate to a new ISP currently being setup (will improve site access speeds and stability) 5. Bring back board creation (with a simple vetting process) 6. Install the new captcha system that we are building 7. Extinguish fires that pop up
>>7359370 /pf/ was taken down [cleared of content] just prior to platform TERM [specific reason]. NAT SEC [charter] prevents use of ‘keys’ to establish IDEN via public utility/domain – non_reg. Formation of ‘clean’ board possible to lock in trip(s) > issues w/ safeguards. Q
Q with sequence for Q to validate Identity on /patriotfights/
before salt rotation. Q deleted content from /patriotfights/ before
8chan terminated. Use of Public Key Certificates to establish IDEN on
public domain prohibited by national security regulations/charter. May
establish new clean board.
QAnon November 22 2019 – Think non_public
Q conversing with codemonkey. Due to Nat Sec reasons Q cannot
follow the steps Codemonkey suggesting to migrate patriots fight to
8kun.
QAnon November 22 2019 – Think non_public
Q !!mG7VJxZNCI ID: 000000 No.7359511 Nov 22 2019 05:48:42 (EST)
Q !!mG7VJxZNCI ID: 000000 No.7359408 Nov 22 2019 05:18:33 (EST)
>7359370 /pf/ was taken down [cleared of content] just prior to platform TERM [specific reason]. NAT SEC [charter] prevents use of ‘keys’ to establish IDEN via public utility/domain – non_reg. Formation of ‘clean’ board possible to lock in trip(s) > issues w/ safeguards. Q
Non public access granted. Pretty Good Privacy (PGP) is a method
used to encrypt emails. There was a vulnerability discovered. Q granted
access to deep state actors to hack track who they were. Encryption
failing was intentional to trap them.
QAnon November 22 2019 – Think non_public
Coordinated and planned? Spy_insert(s)? Puppets have masters. Senate was the target. Q
Anyone surprised? Vindman is CIAramella’s handler. CIA
operation. Clear as day. Imagine the cross examination material during
the senate impeachment trial! @potus will have a field day!
QAnon November 22 2019 – Think non_public
Russian alternative to Wikipedia to be fully launched by summer
of 2022, says publisher. The online encyclopedia does not have a name
yet.
Moscow suggests Malaysian experts should look into Russian data on MH17 crash.
Yazid Sufaat, a biochemist accused of having close ties to Al-Qaeda,
has been freed from prison after serving two years behind bars in
Malaysia. Authorities say he will be monitored closely.
Astronomers capture brightest light ever seen by humanity, more energy in seconds than 10bn years of our Sun.
Beijing has warned that it will implement retaliatory measures after
the US Congress passed a bill purportedly designed to safeguard ‘human
rights’ in Hong Kong.
Russia wants to turn Sakhalin island in Far East into major air hub for Asia & Americas.
The U.S. Justice Department’s internal watchdog said he expects to
be able to release a long-awaited report relating to the origins of
investigations into alleged Russian interference in the 2016 U.S.
presidential election on December 9.
Undersea robot going on test in Antarctic ice as NASA prepares for
alien life search. Scientists hope that one day the submersible will be
sent to Jupiter’s moon Europa.
Australia ablaze: Haze covers Sydney as nature face burning danger.
Dangerous bushfires continue to ravage Australia amid extreme heat.
Two men were killed when a routine training mission out of Vance Air
Force Base went awry on Thursday morning. Two T-38 trainer aircraft
were flying a routine mission out of the Oklahoma base when an
unspecified mishap occurred.
Rudy Giuliani claims that US diplomats have been acting to
further the interests of billionaire George Soros in Ukraine in what he
described as a “massive pay-for-play” scheme which included falsifying
evidence against President Trump.
Prince Andrew didn’t step back from royal duties – Queen Elizabeth
‘fired’ him. “It is unlikely he will ever perform royal duties again. He
is disgraced.”
The Duke of York is preparing to give formal evidence to a US
criminal investigation into the disgraced paedophile Jeffrey Epstein.
One of Epstein’s prison guards, charged with falsifying records to
cover an unauthorized period of absence, now says she wants to cooperate
with Federal prosecutors and spill details about the night Epstein
committed ‘suicide’.
Ousted Bolivian President Evo Morales said he has “zero doubt” that a
mechanical failure that occurred on a helicopter he was traveling on
last month was an “assassination attempt” and no accident.
CBS News executive: Jeffrey Epstein & Ghislaine Maxwell worked for Israeli intelligence.
The first beta test of Elon Musk’s “Starship” Mark 1 prototype exploded during a pressurization test on Wednesday. Video
Epstein’s NY mansion had secret ‘media room’ to record bedrooms and bathrooms: Accuser.
Sinogene is one company working with the Chinese Government to make
animal clones. Bio-technology laws are less strict in China so that’s
where a lot of this is happening.
Strongest EQ in Europe M3.1 Greece Strongest EQ in US M3.3 California Strongest EQ on the Planet M6.1 Thailand Deepest EQ M4.5 605 km Fiji
News Burst 22 November 2019
Share this: Send the word out using these buttons!
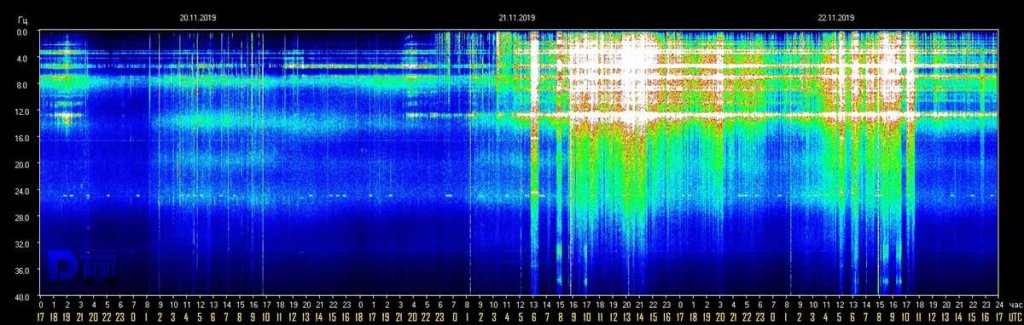
Editor’s Note: Wonderful! In the graph above, we see the non-stop appearance of moderate amplitude/moderate density Schumann Resonance energies for over 30 hours ending at 6am today on 11/22.
Keep your eyes on this graph, keep your focus on your heart, watch your world change, and BE…
Schumann Resonance Today. We will
try to keep you updated about the variations of the Resonance with this
page. The great variations that nobody can explain but that give us a
clear sign that the planet is changing. The Earth is vibration higher
and higher, just like us!
The Chart time is based on Tomsk – Russia – UTC (Universal Time Coordinated) +7Source
RS Base Frequency 7.83 Hz.
Schumann Resonance Today Peaks:
11/22 17:00 UTC – In the
early part of today we had the most significant activity, from 4 to 10
UTC a series of peaks on the 20 with the maximum at P25 just after 10
UTC.
The activity started yesterday is continuing but at lower values,
today the significant part began at 4 UTC and remained on Power 20
threshold since than with a peak Power 25 at 10 UTC.
11/21 17:00 UTC – From this morning to 5 UTC since this period of
activity began, there has been a constant increase in the maximum values
reached, Power 33 was reached at 14 UTC. Right now we are around Power
15.
11/21 11:00 UTC – After 3 days of calm today we are seeing new
activity, from 5 UTC there have been some variations initially at Power
20 and at 10 UTC at the peak until now at Power 23.
11/20 17:00 UTC – Third day of total calm.
11/19 17:00 UTC – Calm.
11/18 17:00 UTC – Today we returned to a condition of very light
activity, there were only two movements that exceeded Power 10, 16 at 6
UTC and 11 at 11 UTC.
11/17 17:00 UTC – The strong activity, that seems to have ended at 9
UTC today, lasted 20 hours. The highest peaks occurred in its initial
part which took place yesterday, today the highest value was Power 30 as
previously reported.
11/17 09:00 UTC – Today is the 17th, lately a day of recurring SR
activity, and the movements started yesterday continued uninterrupted,
the peaks are not at very high values, Power 37 was reached at 00 UTC
today, but the values remained constantly around Power 30.
11/16 23:00 UTC – The strong activity continued but with slightly
less intensity, this period of strong variations started at 6 UTC and
has been above Power 40 for 2 hours, from 15 to 17 UTC. At this time the
maximum values are around Power 30.
11/16 17:00 UTC – Today’s chart shows an initial long period of flat
calm until 1 UTC when very light movements have brought the variations
to reach Power 10 at 9 UTC. From here the movements started to become
more consistent up to starting a strong activity period from 13 UTC
during which the today’s maximum value of Power 46 was reached. It seems
that the movements should also continue in the new chart of Nov. 17th.
11/15 17:00 UTC – The movements continued and grew steadily until 10
UTC when it reached today’s high at Power 22 to returned to normal
values just after.
11/15 09:00 UTC – Shortly after midnight local time from the graph,
corresponding to 17 UTC, we saw a slow and gradual increase in amplitude
values that reached Power 17 at 8 UTC. It seems that the activity
should continue.
11/14 17:00 UTC – Virtually calm, only a few slight movements between 3 and 5 UTC with a maximum of Power 13.
11/13 17:00 UTC – Calm.
11/13 15:00 UTC – The first part of today’s chart day shows absolute
calm, from 1 UTC there are very light movements that have given way to
the light activity of today that lasted for the central part of today’s
chart. During this phase there were 3 peaks that exceeded 20 and others
that touched it, Power 24 was reached at around 6 UTC.
11/12 17:00 UTC – Today’s activity took place over a period of 9
hours, from 3 to 12 UTC, the most intense part with the maximum value of
today as reported previously was from 5 to 8 UTC. The situation is now
shown to be calm.
11/12 08:00 UTC – After several days of intense calm we come to a
new series of movements characterized by rather significant peaks. The
changes started suddenly at 3 UTC and in the span of four hours, at 7
UTC, there was the strongest peak so far at Power 48.
11/11 17:00 UTC – Today was mostly calm, the only variations with a maximum of Power 14 occurred from 7:30 to 9:30 UTC.
11/10 17:00 UTC – Calm.
11/10 11:00 UTC – Not much to say, compared to the calm we see only the “streaks” on the Power 10.
11/9 17:00 UTC – The series of light movements continued without
interruption, a slight drop to values close to calm took place in the
last hours.
11/9 11:30 UTC – In this first part of the day the movements
continued, increasing numerically but with less powerful amplitude
variations whose maximum was Power 25 at 2:30 UTC.
11/8 17:00 UTC – The series of most significant movements of today
lasted about eight hours, from 3 to 11 UTC with the peaks previously
reported, this period has been followed by more slight movements.
11/8 10:30 UTC – From today’s image, we can see how in the last
three days there has been a sort of sequence of movements characterized
by a constant increasing trend, will this coincidentally reach its
maximum on 11 November? The significant peaks of today started at 3, at 6
UTC reached 35 and just before 10 the maximum value of these last 3
days, Power 43.
11/7 17:00 UTC – Slight movements have continued throughout the day,
the highest peak is the one reported previously but shortly after 9 UTC
we can see another variation that has reached Power 27.
11/7 09:00 UTC – The graph in the first part of today shows how the
constant slight movement that began yesterday is continuing. Today we
have had the strongest peak of these last 3 days and reached Power 32 at
3 UTC.
11/6 17:00 UTC – After a couple of days of relative calm today,
shortly after midnight UTC, movements began again which gradually
brought the current peak value of Power 23 to 9:30 UTC. Activity has not
stopped but has continued and at present it seems to see a crescendo
that will lead to higher values.
11/5 17:00 UTC – Today’s activity is very similar to that of
yesterday, slight movements from 1 to 8 UTC with the maximum
value reached of Power 12.
11/4 17:00 UTC – Today the calm has been almost total, very slight variations have reached Power 15 between 6 and 10 UTC.
11/3 17:00 UTC – During the last 24 hours reported in the chart
there were only 3 significant short-term events, the first happened at
19 UTC of yesterday at Power 25, the second movement, which lasted about
2 hours, reached today’s maximum of Power 32 at 6:30 UTC and the last
at 10 UTC at 23.
11/2 17:00 UTC – We could recap today activity with how long the
amplitude remained above 40: 6 hours, from 3 to 9 UTC. Today’s maximum
is Power 98 as previously reported. From 11 UTC the values are back to
normal.
11/2 09:30 UTC – The strong activity that we see in progress at this
time started decisively at the turn of the local midnight,
corresponding to 17 UTC. Initially with peaks at Power 20, within two
hours it reached 30 around 19 UTC. These first movements were followed
by a period during which the amplitude was constantly
oscillating between 10 and 20. At 1 UTC today, the very powerful
activity began, bringing the amplitude close to Power 100. The maximum of Power 98 was reached at 5:30 UTC.
11/1 17:00 UTC – The situation shows the continuation of the
variations also in this second part of the day where the greatest peak
of today was had at Power 21.
11/1 12:30 UTC – The new chart shows slight movements around
midnight UTC that have reached Power 18, for the rest just ‘background’
movements around 10.
Frequency means how many wave cycle happen in a second, 1
Hz. means 1 cycle per second, 40 Hz. means 40 cycles per second,
Amplitude is the size of the vibration, how big is the wave, the chart
shows the frequency variation in Hz and the amplitude using the white
color.
Note
The Ancient Indian Rishis called 7.83 Hz the frequency of OM. It also happens to be Mother Earth’s natural heartbeat rhythm
Schumann resonances are named after professor
Schumann who was involved in early German secret space program and was
later paper-clipped into the United States. The frequencies of Schumann resonances are fairly stable and are mainly defined by the physical size of the ionospheric cavity.
The amplitude of Schumann resonances does
change and is bigger when ionospheric plasma gets excited. Ionospheric
plasma excitation happens because of solar activity, thunderstorms, use
of scalar plasma weapons and HAARP and lately also when the Light forces
are clearing the plasma anomaly.
Dependencies of Amplitudes Schumann Resonance November 22 2019
Dependencies of Quality Schumann Resonance Novembre 22 2019
Dependencies of Frequency Schumann Resonance November 22 2019
All the SR daily images in one single pageSee the Images
Explanation of The Chart
The Schumann Resonance Spectrogram Chart
The Schumann Resonance Chart displays data from the magnetic field
detector to monitor the resonances occurring in the plasma waves
constantly circling the earth in the ionosphere. These three days
spectrograms show the activity occurring at the various resonant
frequencies from 1 to 40 Hz. Within the spectrogram, the power, or
intensity level of each frequency is displayed as a color, with white
being the most intense. The Schumann Resonances appear as the horizontal
lines at 0.0, 4.0, 8.0, 12.0, 16.0, 20.0, 24.0, 28.0, 32.0, 36.0 &
40.0 Hz. This chart is based on Tomsk, Russia, time UTC +7 (UTC =
Universal Time Coordinated).
What is a Spectrogram?
The Spectrogram Calendar is a visual representation of the range of
frequencies in the magnetic field at a given location. Similar to how an
equalizer displays the frequency content of music played on your
stereo, the spectrogram calendar displays the frequency content of a
magnetic field. Instead of showing a brief snapshot, it shows changes
over a period of time, in this case 3 days.
The local magnetic field is a dynamic field that changes constantly
because of variations in the ionosphere and sun and many other
influences not yet fully understood. The range of variation displayed in
the spectrogram chart is from 0 to 40 cycles per second. The vertical
axis is frequency and the horizontal axis is time. The amplitude of a
particular frequency at a specific time is represented by the intensity
of color (green, yellow, white) of each point in the image.