Editor’ Note: The Schumann Resonance energies released by the Earth were seen today on Dec. 21 (any surprise there?) with very dense energies of a moderate amplitude released continuously from 10:30 am through 12N (EST, USA) when the graph ended.
We have been told the Earth is receiving tremendous energies designed to waken our cellular DNA (DNA is actually an antenna system!) allowing humans to think differently leading to different behavior leading to more positive “outcomes” on Planet Earth. Despite chaos from those not accepting these energy changes well (not a vibratory match?)…all things are well on Planet Earth.
My advice? Buckle up, let’s ride out the “Storm” of change, breath deeply, know you are loved, and BE…
InJoy!
___________________________________________________________________________________________
Schumann Resonance Today. We will try to keep you updated about the variations of the Resonance with this page. The great variations that nobody can explain but that give us a clear sign that the planet is changing. The Earth is vibration higher and higher, just like us!
The Chart time is based on Tomsk – Russia – UTC (Universal Time Coordinated) +7 Source
RS Base Frequency 7.83 Hz.
Schumann Resonance Today Peaks:
We added a new image as a visual reference for the month of December so far. Probably on smaller screen is difficult to read but you can click and on it go to a slightly larger image.
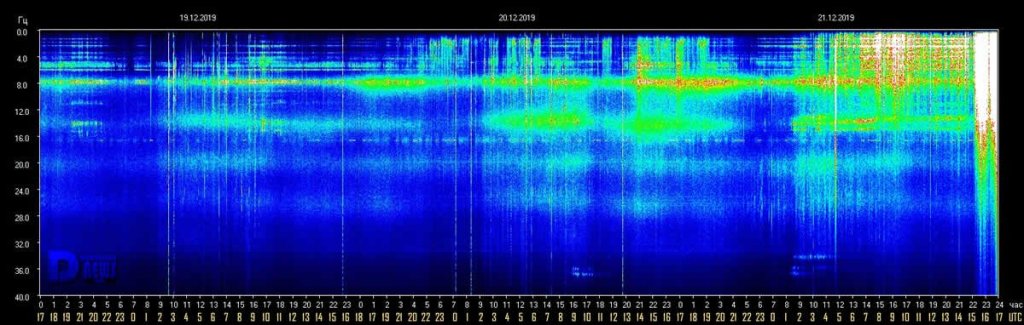
- 12/21 17:00 UTC – A slight activity began today in the last hours shown in the graph, the first change in amplitude occurred just before 5 UTC at Power 18 followed by minor variations. Shortly after 15 UTC the movements became more intense with first Power 31 and then the maximum of today’s chart at Power 35 just before 17 UTC.
- 12/20 17:00 UTC – Today it was still calm, the little variations seen in the graph reached Power 11.
- 12/19 17:00 UTC – Calm.
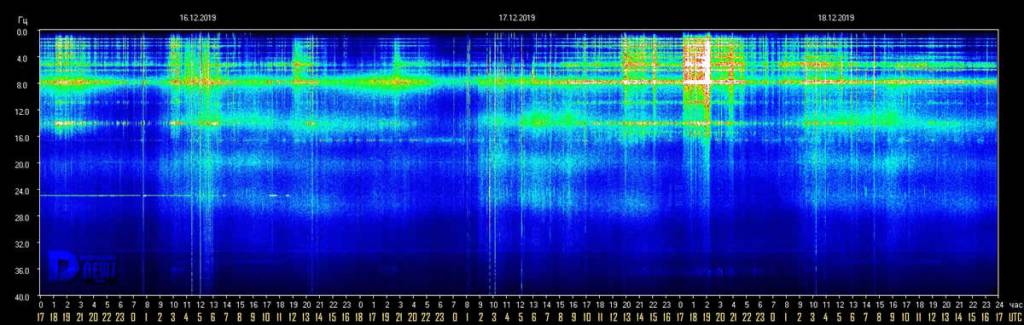
- 12/18 17:00 UTC – Technically we had an event that stands out as often happens lately on the 17th of the month, a peak at Power 17 on December 17th at 19 UTC (corresponding to today’s 2 am on the chart). For the rest, still calm.
- 12/17 17:00 UTC – Calm, many consecutive days of complete cam are not common.
- 12/16 17:00 UTC – Calm.
- 12/15 17:00 UTC – Another calm day, just a wriggle at 3 UTC that reached Power 15.
- 12/14 17:00 UTC – Calm.
- 12/13 17:00 UTC – Calm.
- 12/13 11:00 UTC – Significant activity even today and as in the last few days consisted mainly in isolated peaks. Those of today were 2, very strong, the first at 6 UTC reached Power 60, the second shortly after at 6:40 UTC reached Power 51.
- 12/12 17:00 UTC – Calm.
- 12/12 14:00 UTC – There we have it, the Coincidence 17 again today, the Amplitude has reached Power 74 between 16 and 17 on the chart. corresponding to 9-10 UTC. In this case we could start thinking about how many times it must happen before it becomes impossible…
- 12/12 07:30 UTC – It is clearly a time of pillars, even today we had 30 very intense minutes; from 6 to 6:30 UTC there was the first movement with the amplitude values that reached Power 63 shortly after 6 UTC.
- 12/11 17:00 UTC – Calm continued.
- 12/10 17:00 UTC – After the umpteenth “Coincidence 17” it has been calm.
- 12/10 11:30 UTC – Powerful activity once more, even if limited in time. It was calm until just after 3 UTC when a first isolated peak reached Power 54. From 5:30 to 6:30 it was the most intense part with the maximum value at Power 67. The last peak so far is was reached near 17 h on the chart, 10 UTC, and was at P50.
- 12/9 17:00 UTC – The short but intense period of activity was all for today.
- 12/9 11:30 UTC – It is no surprise that today this strong peak occurred and reached Power 74, it would have been a surprise if it had been a calm day. This strong series of movements lasted about 50 minutes, from 8:40 to 9:40 UTC, at 9:15 the maximum value.
- 12/8 17:00 UTC – Calm.
- 12/8 11:30 UTC – The situation today shows total calm until around 10 UTC when very slight variations in Amplitude started.
- 12/7 17:00 UTC – Much of today’s activity has been concentrated in the first part of the UTC day, from midnight until 6, where maximum values have been reached. Other slight sporadic variations at P15 also occurred at 10: 30 UTC.
- 12/7 09:00 UTC – After the record high of yesterday the variations continued sporadically at lower levels, the maximums were around Power 15. From midnight UTC a very active phase started again which kept the Amplitude above Power 50 for about 4 hours, from 1 to 5 UTC; during this period the maximum value achieved was Power 64.
- 12/6 17:00 UTC – After the incredible Amplitude spike at Power 158 other strong movements continued, the period of activity in which the Amplitude has been above 100 lasted about 1 hour, from 7:45 am to 8:45 UTC. At 10:30 UTC there was a further flicker at Power 28, after which a slight background activity continues.
- 12/6 10:30 UTC – The today’s graph began in a condition of general calm until 3 am UTC when the variations started. Immediately they reached Power 32 at 4 UTC; the movements continued with less magnitude until 7:45 UTC when some impressive movements started and reached Power 100 in around 15 minutes, at 8 UTC. This, despite the already impressive value, is still not the maximum for today, at 8:30 am the amplitude has further increased and reached an incredible Power 158, the most powerful peak of the last 2 years! In addition to the main and the amplitude graphs, the massive variation can also be seen in the other two charts, the Quality, which shows a value of 25, and that of the frequency of the SR, which shows a value of 8.80.
- 12/5 17:00 UTC – Calm.
- 12/4 17:00 UTC – Yesterday we saw a single peak, today the activity was very similar, 2 peaks, one at Power 23 at 21:30 UTC yesterday and another today at Power 19 this morning at 1:30 UTC. For the rest of the day it was calm.
- 12/3 17:00 UTC – Total calm, the only wriggle at 7 UTC reached Power 13.
- 12/2 17:00 UTC – Today the activity was not long lasting but very intense, in addition to the previous peak, which marked the beginning of the active period at 8:30 UTC, after a while, at 9 UTC, there was the maximum of today at Power 55, this was followed shortly after by a further movement on the 30s after which, from 10 UTC, the calm returned. Still, another movement around 17 hours of the graph.
- 12/2 09:30 UTC – Today’s chart shows once again a stato of calm, the last significant peak at Power 20 was Nov. 30 at 19 UTC so it took about 36 hours before the amplitude values returned above P10. Today, however, it’s back, the peak was at Power 37 8:30 UTC.
- 12/1 17:00 UTC – A single peak isolated at Power 25 in the first part of today’s chart and then calm.
Frequency means how many wave cycle happen in a second, 1 Hz. means 1 cycle per second, 40 Hz. means 40 cycles per second, Amplitude is the size of the vibration, how big is the wave, the chart shows the frequency variation in Hz and the amplitude using the white color.
Note
The Ancient Indian Rishis called 7.83 Hz the frequency of OM. It also happens to be Mother Earth’s natural heartbeat rhythmSchumann resonances are named after professor Schumann who was involved in early German secret space program and was later paper-clipped into the United States. The frequencies of Schumann resonances are fairly stable and are mainly defined by the physical size of the ionospheric cavity. The amplitude of Schumann resonances does change and is bigger when ionospheric plasma gets excited. Ionospheric plasma excitation happens because of solar activity, thunderstorms, use of scalar plasma weapons and HAARP and lately also when the Light forces are clearing the plasma anomaly.

Dependencies of Amplitudes Schumann Resonance December 21 2019

Dependencies of Quality Schumann Resonance December 21 2019
Dependencies of Frequency Schumann Resonance December 21 2019
Schumann Resonance Differential Peaks
Schumann Resonance PDF Archives
Images Archive
All the SR daily images in one single pageSee the Images

Explanation of The Chart
The Schumann Resonance Spectrogram Chart
The Schumann Resonance Chart displays data from the magnetic field detector to monitor the resonances occurring in the plasma waves constantly circling the earth in the ionosphere. These three days spectrograms show the activity occurring at the various resonant frequencies from 1 to 40 Hz. Within the spectrogram, the power, or intensity level of each frequency is displayed as a color, with white being the most intense. The Schumann Resonances appear as the horizontal lines at 0.0, 4.0, 8.0, 12.0, 16.0, 20.0, 24.0, 28.0, 32.0, 36.0 & 40.0 Hz. This chart is based on Tomsk, Russia, time UTC +7 (UTC = Universal Time Coordinated).
What is a Spectrogram?
The Spectrogram Calendar is a visual representation of the range of frequencies in the magnetic field at a given location. Similar to how an equalizer displays the frequency content of music played on your stereo, the spectrogram calendar displays the frequency content of a magnetic field. Instead of showing a brief snapshot, it shows changes over a period of time, in this case 3 days.
The local magnetic field is a dynamic field that changes constantly because of variations in the ionosphere and sun and many other influences not yet fully understood. The range of variation displayed in the spectrogram chart is from 0 to 40 cycles per second. The vertical axis is frequency and the horizontal axis is time. The amplitude of a particular frequency at a specific time is represented by the intensity of color (green, yellow, white) of each point in the image.

What is the Schumann Resonance?
The Herathbeat of Planet EarthRead


Wise Men
Wise men speak because they have something to say; Fools because they have to say something.
Plato