Editor’s Note: From the graph above, we see a very light scattering for the Schumann Resonance energies of varying strengths. Please bear in mind a portal opened today for the Goddess energy to envelop Gaia (Earth) with Love which will not be apparent from this graph (wrong wavelength?).
Thanks for continuing to monitor the Schumann Resonance energies, while keeping in mind the “other” cosmic energies that are all working in conjunction to change our world for the better, which allows us to BE…
Injoy!
___________________________________________________________________________________________
Schumann Resonance Today. We will try to keep you updated about the variations of the Resonance with this page. The great variations that nobody can explain but that give us a clear sign that the planet is changing. The Earth is vibration higher and higher, just like us!
The Chart time is based on Tomsk – Russia – UTC (Universal Time Coordinated) +7 Source
RS Base Frequency 7.83 Hz.
Schumann Resonance Today Peaks:


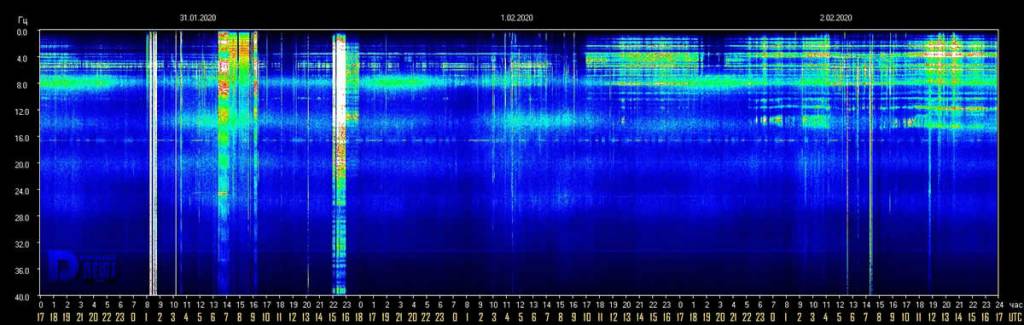
- 2/2 17:00 UTC – The only part of the day in which there were fluctuations was from 11 UTC until now, although always with Power 10 as the sporadic maximum.
- 2/2 10:30 UTC – After yesterday’s 24 hours of almost total calm, even today it seems that we will continue along these lines, some flicker has touched Power 10 between 5 and 9 UTC.
- 2/1 17:00 UTC – Today was basically a calm day, a very light activity started in this last part of the day even if it did not produce any significant variation. In the Quality chart we can see a value of 28 at 16 UTC.
- 2/1 09:00 UTC – Calm.
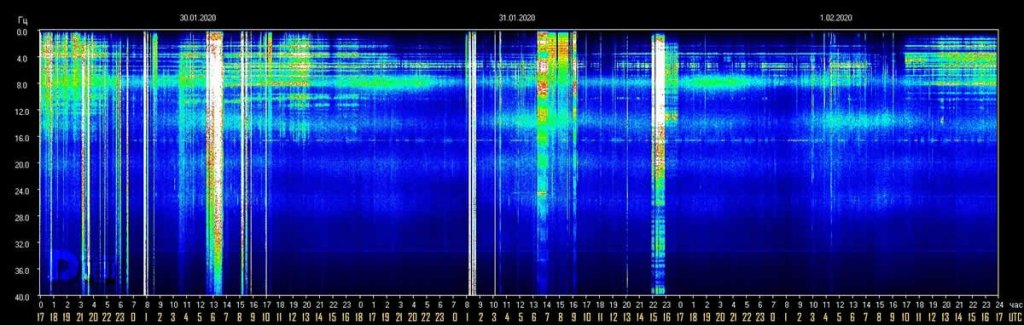
- 1/31 17:00 UTC – Today there were two significant peaks, at 1 UTC reached Power 35 and the second one shortly after 15 at Power 34. In between some light variations.
- 1/31 10:00 UTC – Once again the first opening movement was at 1 UTC after 12 hours of calm, true calm; the value reached was Power 35, followed by other isolated peaks with decreasing values.
- 1/30 17:00 UTC – Calm.
- 1/30 13:00 UTC – 17 @17
- 1/30 09:00 UTC – After yesterday’s activity there was no calm but a constant series of minor variations until 1 UTC when, as usual in the last few days, the first spike reached Power 39. Other movements between Power 15 and 20 also occurred between 5 and 7 UTC.
- 1/29 17:00 UTC – If you look at the image of Dependencies of Amplitude below you can see how in the last 3 days there has been a certain symmetry in the activity, in the last two days there are almost mirrored movements and “during office hours “- based on the local time timeline – from 8 to 17, three peaks … peculiar. The difference is that today it did not revert back to calm but instead we are in continuous variations that sometimes reach Power 15.
- 1/29 11:30 UTC – Even today the pattern continues, 14 hours of calm, from 11 yesterday until 1 UTC this morning when a first variation at 35 Hz broke the silence. This first movement was followed by two other significant ones, spaced 4 hours apart, again r 35 at 5 UTC and 39 Hz at 9 UTC.
- 1/28 17:00 UTC – Calm.
- 1/28 13:00 UTC – From 9 to 10 UTC we had probably the most intense part of today, shortly after 9 we had a further increase in amplitude up to Power 54 and shortly after a new peak to 29, calm from 11 UTC.
- 1/28 08:00 UTC – Once again at 1 UTC there was the opening with a series of movements, lasted 20 minutes, that reached the maximum at Power 34, these were followed again by a period of minor changes until, from 5 to 7 UTC, there was what so far is the most powerful movement of the day, Power 47 at 7:30 UTC. Note: Yesterday the maximum value for the A1 apparatus has been 63 while for the A2 it was 74.
- 1/27 23:30 UTC – The background ‘buzz’ remains, sporadically reaching Power 14, this period started about 12 hours ago.
- 1/27 17:00 UTC – After the previous strong peak at 63 the movement quickly decreased in amplitude to descent below Power 15 at 10 UTC ant to remain as a background light ‘noise’ for the rest of the graph.
- 1/27 08:30 UTC – The calm lasted just over 35 hours, from 15 UTC on 25 January to 1 UTC today, Jan 27. The first opening movement reached Power 15 and it seemed immediately to see the beginning of some significant activity, in fact, after a few hours, at 5 UTC, a series of peaks began at around Power 25 and lasted until 7 UTC when, shortly thereafter at 8 UTC, a powerful movement brought the amplitude to Power 63.
- 1/26 17:00 UTC – Calm, Power 12, the maximum of today, was at 6 UTC.
- 1/25 17:00 UTC – Looking at today’s chart, we we can see that it is practically 3 consecutive days of activity and that every day has been slightly more active than the previous one. We will see if this short break in progress from 15 UTC will last or if we will have new business. As a side note, the earthquake shock in Turkey of M6.7 occurred on 24th at 17:55 UTC. As for the values, after today’s peak mentioned below, we had one more spike that reached Power 46 at 11:30 UTC.
- 1/25 09:30 UTC – We entered the second consecutive day of activity and the maximum values continued their gradual increase, but today we also see a strong increase in the number of variations. Across midnight UTC there have been two hours during which the Resonance remained constantly above Power 40 with a peak at 47 at 1 UTC. The following wave was even stronger with the maximum of Power 51 reached at 7 UTC. At the time of publication we are at about 30 increasing.
- 1/24 23:30 UTC – For a moment it seemed as if the situation had calmed down but it was not so, there was only a period of about two hours at the turn of the new day in the local timeline with low values but immediately afterwards they went back up to reach 18 then 25 and at the time of this post Power 40 and going.
- 1/24 17:00 UTC – The long strip of activity in progress that we see in the graph began at 1 UTC on January 23, so now we are at 40 consecutive hours of movements. It started lightly but always gradually and slowly increasing. Today the peak period was from 5 to 9 UTC with Power 43, 25 and 40 in orderly succession. After these three movements, a slow decline started toward the calm.
- 1/24 09:00 UTC – The constant and continuous increase is still in progress but now the variations are more spaced in time, after reaching Power 26 at 1 UTC we went back for a few hours to around 15 and then up to the maximum value so far, Power 42 at 6:15 UTC. This was followed by Power 26 at 8 UTC. Significant activity is ongoing, we crossing Power 40 at the moment of this update.
- 1/24 00:00 UTC – The movements continued in the new graph and the values of the amplitude of the resonance continued in the constant increase, from around 18 UTC for about 2 hours it remained at Power 25. Subsequently there was a slight decrease but always with oscillations around 20.
- 1/23 17:00 UTC – The activity continued, slightly intensifying, without interruption, the maximum value has been Power 22 at 15 UTC. Today the activity was not strong but there was no calm.
- 1/23 10:30 UTC – If you had the opportunity to follow the evolution of the variations during the hours before this update you will certainly have noticed the preparation for what is becoming the “Coincidence 17”. Even today from 1 UTC small variations in constant slight increase, Power 15 after 8 hours of ‘buzz’ at 9 UTC barely touching Power 17 at 17 chart local time (10 UTC). The activity seems continuing.
- 1/22 10:00 UTC – Today in total the activity lasted about 9 hours, from 1 to 9:30 UTC, there were two twin series of peaks, the first is the one previously reported with Power 55 and 60 in rapid succession; the second series also lasting about two hours, started at 7:30 and in a few minutes reached Power 57 and after about 45 minutes, at 8:15, Power 42. After this last movement the calm returned.
- 1/22 10:00 UTC – Another coincidence, for the 3rd day in a row we are having Power 56 at 9 UTC/16 on the chart’s timeline.
- 1/22 08:00 UTC – Today as well the pattern repeats, after about 14 hours of complete calm at 1 UTC, as for the last three days, there was a slight movement that reached 15 Hz, this was the opening. Later on, from 5 to 5:30 UTC, we had the first ‘discharge’ that reached Power 55 and shortly thereafter, from 5:50 to 6:20 UTC, another strong activity that reached Power 60.
- 1/21 17:00 UTC – From 10:30 UTC we are in a calm condition, this time it seems to be quite flat, for now.
- 1/21 10:00 UTC – As often happens we are seeing a sort of pattern, the situation remains calm for a number of hours and then we have strong variations. Although there was no real clam, a slight background activity occurred for about 20 hours, during this period, between 1 and 2 UTC there was a very significant variation but of lesser power, 13. The most relevant activity, on the other hand, was between 8 and 10 UTC (15-17 in the graph). At 8:20 UTC there was a powerful peak that within few minutes reached Power 56, lasting about 30 minutes, once again the same value as yesterday. This was followed by other movements around Power 50. Power 17 was reached just before 17 on the timeline.
- 1/20 17:00 UTC – After the strong activity that lasted about 1 hour, from 9:15 to 10:14 UTC, the situation gradually normalized until the calm, reached at 14.
- 1/20 10:30 UTC – From 9 UTC the movements seem to have changed pace, they went first to Power 30 at 9:30 UTC and then to Power 57 at 10:20.
- 1/20 09:00 UTC – The first part of today’s chart shows an initial calm situation that ended at 2 UTC when a peak at Power 18 gave the go to series of slight movement that are currently underway.
- 1/19 17:00 UTC – Today’s activity took place over a period of 12 hours, from 2 to 14 UTC, the peaks are those previously reported.
- 1/19 11:00 UTC – Last two days have been of strong activity and today seems like will be the third, even if less powerful. After the last update yesterday we had 9 hours of calm until 2 am UTC this morning when a light and continuous movement started that topped several times at Power 14. From 8 UTC the power increase reaching Power 30. The image below illustrate the yesterday’s peaks, Amplitude 1 and Amplitude 2.

- 1/18 17:00 UTC – Analyzing the graph of today’s Amplitude, in the second part of the day we can see a pair of peaks at high values which were recorded by the apparatus A2 characterized by the line and the yellow reference numbers. The two peaks indicated are also shown in the main graph in the form of thin lines that reach the bottom of the scale. The measured values are Power 57 (at 11:45 UTC) and 41 (at 20:40 UTC) and only the second had a similar movement in the other measurement, the white A1. However, it does not seem that the activity is over, a peak at Power 40 occurred at 16:30 UTC.
- 1/18 07:30 UTC – Significant activity continued until 6 UTC this morning when values appear to have returned to normal. After the peak that reached Power 41 reported below there was another variation at 1:30 UTC at Power 30. If we consider 5 UTC as the end of the strong movements, these continued for a period of 36 hours.
- 1/18 00:30 UTC – There doesn’t seem to be any interruption, there has been a constant and continuous increase that has brought the amplitude of the resonance to Power 41 at midnight UTC.
- 1/17 21:00 UTC – The activity is continuing even if for now without very high peaks. After a period of about 5 hours in which the amplitude remained below Power 15, from 17 it returned constantly above. The new graph shows a maximum value at Power 28 at 18 UTC.
- 1/17 17:00 UTC – Since 17 UTC yesterday, now 0 in the graph, there have been 24 hours of continuous activity, the three relevant peaks occurred in succession, 67 (identical to yesterday’s peak) at 6:30, 60 at 8:15 and 53 at 10 UTC. After the latter peak, the amplitude returned to oscillate between Power 10 and 20 until the end of today’s graph.
- 1/17 08:30 UTC – What the graph shows today is what is lovingly called the ‘Coincidence 17th’ but this time could recall also ‘Dark To Light’. As soon as January 17 started on the graph, corresponding to 17 UTC yesterday, a light activity started and lasted about 9 hours. Little before of 3 am UTC strong amplitude variations began and in two hours the values repeatedly exceeded Power 40. The strongest peak so far reached Power 67. So far the amplitude has remained above Power 30 for 5 consecutive hours from 3 am. In the last 2 hours we have always been over Power 40 while from 6 to 7:30 UTC the amplitude has remained constantly above Power 50.
- 1/16 17:00 UTC – To summarize, the blackout started on January 14th at 8 pm and ended on the 16th at 7:30 am, 35 hours and 30 minutes. As the data returned we had the significant peak at 67 followed by a minor move to Power 25, today’s movements occurred from 9 to 10:15 UTC.
- 1/16 10:00 UTC – It seems that the blackout is over, and we find that there is a strong activity ongoing. At 9 UTC, about 2 hours after the data came back live, immediately a ‘pillar’ that reaches Power 68.
- 1/16 08:00 UTC – Still no data, we are entering the second consecutive day of total black, coincidence?
- 1/15 17:00 UTC – No changes, we are now beyond 21 hours of ‘darkness’.
- 1/15 12:00 UTC – Pitch black.
- 1/15 07:00 UTC – We are still in blackout mode, it is now about 12 hours from the last update. The last massive outage was exactly on almost same days in October 2019, started on October 13 to end on the 18th.

- 1/15 00:00 UTC – The chart stopped updating at 19:30 when a slight activity apparently started again, it is not uncommon to have some ‘blank’ hours every now and than.
- 1/13 17:00 UTC – The first part of today’s chart shows complete calm, from just after midnight UTC some slight movements started which slightly exceeded Power 10. A ‘background buzz’ then continued for the rest of the day.
- 1/13 17:00 UTC – Calm.
- 1/13 09:00 UTC – Today began with a slight ‘background’ activity around Power 10, these slight variations continued until 8 am. During this period, an isolated peak at Power 33 occurred at 4:15 UTC.
- 1/12 17:00 UTC – Only movement today at 5 am UTC has reached Power 25.
- 1/11 23:00 UTC – The Power 40 lasted almost 1 hour across 17 UTC, most of the time above Power 30
- 1/11 17:00 UTC – 31 hours of total calm until shortly after 16 UTC when a new activity started, and which is currently underway; so far the maximum amplitude has reached Power 40.
- 1/11 11:00 UTC – Total Calm.
- 1/10 17:00 UTC – After the first three previous ‘pillars’ there was also the fourth, between 8 and 9 UTC and reached Power 47. Today’s activity took place in the period from 2 am to 9 am UTC. In the amplitude graph, over the last 3 days, can be noted a gradual increase in the amplitude values and duration.
- 1/10 08:30 UTC – Yesterday we had a short series of isolated ‘pillars’, today the same thing but of greater magnitude, both in the maximum amplitude value and in the duration of the peaks. The first ‘introductory’ movement took place at 1 UTC at Power 20; the second peak was at Power 46 from 4 to 5 UTC; the last peak so far has been at Power 65 and lasted about 30 minutes from 5:30 UTC.
- 1/9 17:00 UTC – Calm.
- 1/9 10:30 UTC – Today’s chart is characterized by two major ‘pillars’ accompanied by others of smaller size, all isolated. The most significant: from 5:30 to 6 UTC at Power 50; from 6:30 to 7 UTC at Power 58; from 9:15 to 9:30 UTC at Power 25.
- 1/8 17:00 UTC – Calm.
- 1/8 08:30 UTC – For this first part of today’s chart nothing significant except a Pillar that lasted about 40 minutes and reached Power 18 at 4:15 UTC. The below news report of ‘something’ on the 6th, we had 18 hours of flat calm while… January 6th, something unexpected happened in the soil of northern Norway. “Electrical currents started flowing… It seemed to be some kind of shockwave… My instruments detected a sudden, strong variation in both ground currents and our local magnetic field” reported Rob Stammes, who monitors ground currents at the Polar Light Center geophysical observatory in Lofoten archipelago in NW Norway. NASA’s ACE spacecraft detected something as well. Approximately 15 minutes before the disturbance in Norway, the interplanetary magnetic field (IMF) near Earth abruptly swung around 180 degrees, and the solar wind density jumped more than 5-fold. The sudden surge at around 19:30 UTC. electroverse.net
- 1/7 17:00 UTC – Today’s chart shows a period of around 18 hours of flat calm, very few swings, it started at 8 am UTC yesterday and ended at 2 am UTC this morning. After this ‘silence’ some light background movements started, Power 15 was today’s maximum at 7 UTC.
- 1/6 17:00 UTC – Total Calm.
- 1/5 17:00 UTC – Calm.
- 1/5 8:00 UTC – Today, together with the second part of yesterday, was characterized by fairly powerful but isolated peaks; two have occurred, the first at Power 21 took place at 00 UTC, the second, much more powerful, reached Power 48 at 4:45 UTC.
- 1/4 17:00 UTC – Today the activity has almost been continuous, in the first part of the day shown on the graph the amplitude peaked around 15 while in the second half the variations were more sporadic but reached the peak of Power 43 at 13:40 UTC. The situation is now calm.
- 1/4 8:00 UTC – After the not so uncommon data blackout, but peculiar for it’s duration, the restored flow shows a light activity that topped several times between Power 13 and 15, maximum for now was at 6 UTC.
- 1/3 17:00 UTC – Calm until the end of the chart when some variations seems about to start.
- 1/3 10:00 UTC – We are back to normal operations after the data blackout which lasted approximately 17 hours. The first available data show a calm situation.
- 1/2 18:00 UTC – The publication of the new data stopped at 16 local time in Tomsk, corresponding to 9 UTC. So far the darkening has lasted 9 hours.
- 1/2 15:30 UTC – The activity continued in a very moderate way throughout the day, the maximum at about power 14 has been temporarily reached at 1 and 6 UTC.
- 1/1 17:00 UTC – The second part of today’s graph shows a marked increase in activity even if the peaks have remained relatively low. The movements started at 12 UTC and lasted until 17, the highest peak was at Power 25.
- 1/1 11:00 UTC – Today, like yesterday, it seems a calm day, the maximum values once again reached Power 10 momentarily around 6 am UTC.
Frequency means how many wave cycle happen in a second, 1 Hz. means 1 cycle per second, 40 Hz. means 40 cycles per second, Amplitude is the size of the vibration, how big is the wave, the chart shows the frequency variation in Hz and the amplitude using the white color.
Note
The Ancient Indian Rishis called 7.83 Hz the frequency of OM. It also happens to be Mother Earth’s natural heartbeat rhythm Schumann resonances are named after professor Schumann who was involved in early German secret space program and was later paper-clipped into the United States. The frequencies of Schumann resonances are fairly stable and are mainly defined by the physical size of the ionospheric cavity. The amplitude of Schumann resonances does change and is bigger when ionospheric plasma gets excited. Ionospheric plasma excitation happens because of solar activity, thunderstorms, use of scalar plasma weapons and HAARP and lately also when the Light forces are clearing the plasma anomaly.

Dependencies of Amplitudes Schumann Resonance February 2 2020

Dependencies of Quality Schumann Resonance February 2 2019

Dependencies of Frequency Schumann Resonance February 2 2019
Schumann Resonance Differential Peaks
Schumann Resonance PDF Archives
Images Archive
All the SR daily images in one single pageSee the Images

Explanation of The Chart
The Schumann Resonance Spectrogram Chart
The Schumann Resonance Chart displays data from the magnetic field detector to monitor the resonances occurring in the plasma waves constantly circling the earth in the ionosphere. These three days spectrograms show the activity occurring at the various resonant frequencies from 1 to 40 Hz. Within the spectrogram, the power, or intensity level of each frequency is displayed as a color, with white being the most intense. The Schumann Resonances appear as the horizontal lines at 0.0, 4.0, 8.0, 12.0, 16.0, 20.0, 24.0, 28.0, 32.0, 36.0 & 40.0 Hz. This chart is based on Tomsk, Russia, time UTC +7 (UTC = Universal Time Coordinated).
What is a Spectrogram?
The Spectrogram Calendar is a visual representation of the range of frequencies in the magnetic field at a given location. Similar to how an equalizer displays the frequency content of music played on your stereo, the spectrogram calendar displays the frequency content of a magnetic field. Instead of showing a brief snapshot, it shows changes over a period of time, in this case 3 days.
The local magnetic field is a dynamic field that changes constantly because of variations in the ionosphere and sun and many other influences not yet fully understood. The range of variation displayed in the spectrogram chart is from 0 to 40 cycles per second. The vertical axis is frequency and the horizontal axis is time. The amplitude of a particular frequency at a specific time is represented by the intensity of color (green, yellow, white) of each point in the image.

What is the Schumann Resonance?
The Herathbeat of Planet EarthRead
🙂

Violence
Violence is the last refuge of the incompetent.
Isaac Asimov