Tension continues at the Greek Evros border, with chemicals and stones ‘raining‘ down on the Greek forces from illegal immigrants and Turkish police on the other side of the fence. The war-like scenery begun again when illegal immigrants attempted to storm and ‘tear down’ parts of the fence. It has also come to light from Turkish media footage, that the migrant camp on their side of the fence is being disinfected. This evidence raises questions if there are coronavirus cases among the illegal immigrants, or if the Turkish authorities are concerned for their health.
News Burst 24 March 2020
[Moar Pelosi] Anons are tired. This long game has been played with little to no reward. The carrot is becoming dull and mediocre. We’re tired boss. [ALL THESE POLITICIANS]
The EU Economic and Financial Affairs Council approved the proposal of the European Commission to suspend for the first time the Stability and Growth Pact – the baseline document of the Euro zone – for economic support measures in response to the Wuhan Virus pandemic, the EU Council says in a statement released on Monday.
German police arrested a 51-year-old man late last week after investigators determined he purposefully removed bolts from the tracks of a high-speed rail bridge in a possible attempt to cause a derailment. The man, who is now facing charges of attempted murder, was found to have “specialist equipment” used for loosening track bolts in his vehicle. Authorities were made aware of the situation by an Intercity Express operator who reported that he saw “something unusual” on the bridge during his Friday shift.
India: In a slew of extraordinary measures, authorities announced a complete lockdown of 75 districts in 22 States and Union Territories and suspended all passenger trains, inter-state buses and metro services across the country till March 31. Delhi, Jharkhand, Punjab and Nagaland declared a statewide lockdown, exempting only essential services, while similar curbs were announced in a number of districts in Bihar, Haryana, Uttar Pradesh and West Bengal. Mumbai’s local trains have been suspended till March 31, and Section 144 of the CrPC is being invoked in several cities and towns in Maharashtra to prevent people from gathering at a spot.
Quote of the Day: “Do you know what the American people are thinking right now? They’re thinking that the brain is an amazing organ. It starts working in a mother’s womb, and it doesn’t stop working until you get elected to Congress.”
Police in Greece arrested members of a Turkish terrorist organisation after a tunnel containing a cache of military-grade weapons was discovered under Athens. Eleven members of the Revolutionary People’s Liberation Party (DHKP-C) were arrested. Police discovered a 47-metre (154-foot) tunnel that contained an arsenal of weapons including an anti-tank rocket launcher, grenade launchers, AK-47 rifles, and pistols, according to the Greek newspaper Kathimerini. The Revolutionary People’s Liberation Party is a revolutionary communist organisation that is classified as a terrorist organisation and wishes to topple Islamist president Recep Tayyip Erdogan and establish a Marxist state.
Singapore Airlines will cut 96% of its capacity that had been scheduled up to the end of April, said the airline on Monday (Mar 23). About 138 SIA and SilkAir planes, out of a total fleet of 147, will be grounded as a result. Scoot, the company’s low-cost unit, will suspend “most of its network” and will ground all but two of its 49 planes. This comes amid the “greatest challenge that the SIA Group has faced in its existence”, the company said.
[For What It Matters] It is a bad idea to publish coronavirus data from China as if it were factual, given ample anecdotal evidence the numbers are inaccurate and the CCP’s persistent history of lying about such things. There is 0 chance the Chinese numbers are accurate.
A Chinese kindergarten run by a US-listed group is under investigation after claims of sexual molestation and needle marks on children. The scandal broke out at the nursery in Beijing’s eastern suburb of Guanzhuang. The incidents were reported in two groups; each had some 25 children aged from 2 to 6. The kindergarten is run by RYB Education Institution, which is currently listed on the New York Stock Exchange. Several parents found needle marks on her children’s bodies, Caixin media group, which initially reported the story, said on Thursday. Medical examination of eight children confirmed that the injuries were indeed caused by needles, Guanzhuang police later said. Mr. Joel A. Getz is Independent Director of the Company. Prior to that, Mr. Getz served as Director of Development for the William J. Clinton Foundation in New York and was President of the Mayor’s Fund to Advance New York City.
The PG&E Corporation has agreed to plead guilty to charges of felony involuntary manslaughter for its role in sparking a wildfire in Butte County, California, that killed 84 people in 2018. The indictment charges the company with 84 counts of manslaughter and one count of unlawfully causing a fire. “PG&E acted with criminal negligence, which is a much higher standard than ordinary negligence. … They acted in a way that created a high risk of death,” said Butte County District Attorney Mike Ramsey. This indictment ends a year-long criminal investigation led by Ramsey. A centerpiece of Ramsey’s investigation was a piece of metal called a “C-hook,” which broke off from a transmission tower, allowing a high-voltage power to fall and start a fire in the brush below the tower. Fire investigators determined that the hook had worn through about 80% before finally snapping. The ensuing flames essentially destroyed the town of Paradise, California, in addition to becoming the deadliest wildfire in state history.
Tension continues at the Greek Evros border, with chemicals and stones ‘raining‘ down on the Greek forces from illegal immigrants and Turkish police on the other side of the fence. The war-like scenery begun again when illegal immigrants attempted to storm and ‘tear down’ parts of the fence. “Evros won’t fall” patch on the shoulder of a Greek soldier. The immigrants who want to illegally enter Greece and Europe, are encouraged by Turkish police, who launched tear gas grenades against the Greek defending forces. In response, a specialised armoured vehicle ‘DAVID’ was sent to the Kastanies border. The firefighting vehicle which has a tank capacity of 12.5 tons (12500 kg) of water and a ‘cannon’ range of about 35 meters, can extinguish fires in particularly inaccessible areas. It has also come to light from Turkish media footage, that the migrant camp on their side of the fence is being disinfected. This evidence raises questions if there are coronavirus cases among the illegal immigrants, or if the Turkish authorities are concerned for their health.
The National Health Commission of the Mainland claimed that 39 new cases of Wuhan pneumonia were confirmed the day before yesterday, but all of them were imported from abroad. There have been no new confirmed cases in the country for two consecutive days. However, Japanese media Kyodo News quoted Wuhan doctors as saying that authorities had suspended some tests, official figures were unreliable, and a second wave of outbreaks appeared at any time. The doctor quoted by Kyodo News Agency said that the Chinese Communist Party General Secretary Xi Jinping had visited Wuhan earlier, and the number of local diagnoses of Wuhan pneumonia was officially “manipulated.” Many symptomatic patients were suddenly released without isolation for less than 14 days to show that “Xi Jinping’s government successfully repelled the epidemic.”
Sun Activity
So far this year, the sun has been blank, without sunspots, 76% of the time. That’s verging on the Space Age record set just last year in 2019 when the sun was blank 77% of the time. This means Solar Minimum is still underway despite recent signs of life from the next solar cycle. Stay tuned for more quiet. -spaceweather.com
Strongest EQ in Europe M3.9 Greece Strongest EQ in North America M4.3 California Strongest EQ on the Planet 5.1 Off the coast of Chile Deepest EQ M5.3 497 km South of the Fiji Islands News Burst 24 March 2020
Share this: Send the word out using these buttons!
Editor’s Note: Wow, just wow! Today, on March 22, we see a massive amount of Schumann Resonance energy coming to Earth on a fairly steady basis from midnight through 12 Noon. (all times are EST, USA).
These energies, as well as others not monitored, are escalating and affecting our geo-political environment, which of course, affects our personal thoughts, and our vibratory stance.
Join me in rejoicing as our world changes for the better, which of course will result in a happier life style, which leads to positive thoughts, which leads to a higher vibratory state, which in turn leads to holding and BEing in…
60 Schumann Resonance Today. We will try to keep you updated about the variations of the Resonance with this page. The great variations that nobody can explain but that give us a clear sign that the planet is changing. The Earth is vibration higher and higher, just like us!
The Chart time is based on Tomsk – Russia – UTC (Universal Time Coordinated) +7Source
RS Base Frequency 7.83 Hz.
Schumann Resonance Today Peaks:
“Every second, a multitude of pulses travel around the world in this unique, resonant chamber between Earth and the ionosphere, sending colluding signals to all microorganisms. These signals couple us to the Earth’s magnetic field. Named after their discoverer, these Schumann Resonances (SR) drive the harmonizing pulse for life in our world.” Eric Thompson
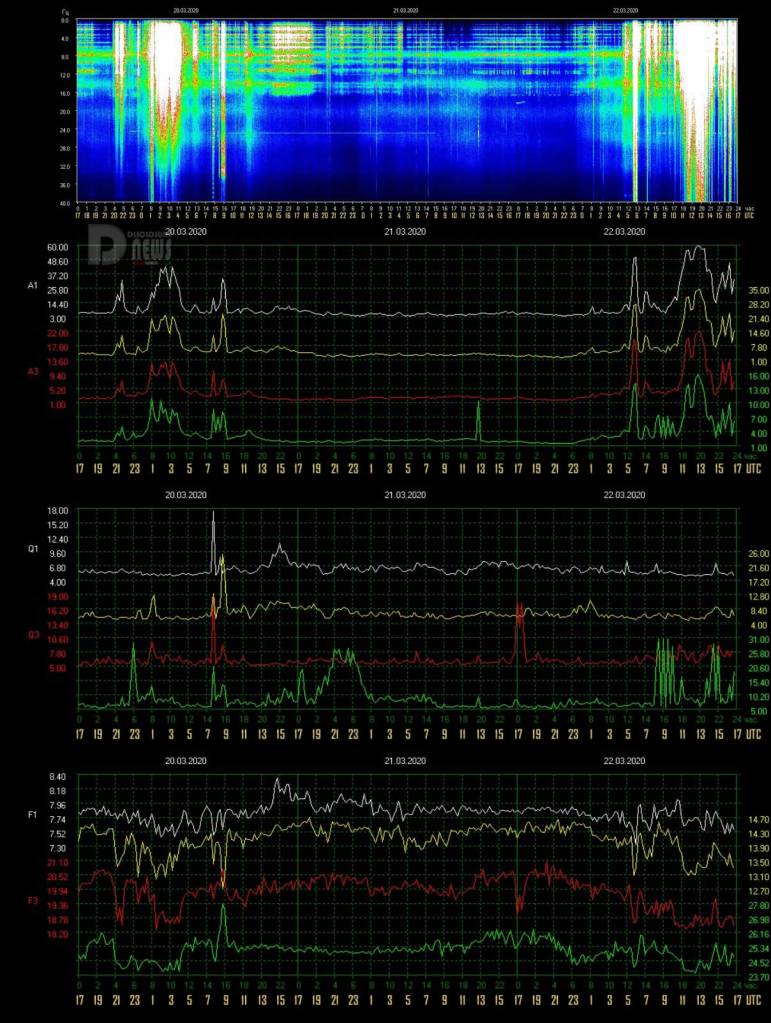
3/22 17:00 – Let’s summarize the activity shown in today’s chart. The movements lasted 12 hours, from 5 to 17 UTC. The most important part started at 10 UTC and is still ongoing. The peaks were initially Power 50 and then moved to Power 60 around 13 UTC. At the time of this update there are strong isolated peaks but very close to each other that reach between Power 40 and 45.
3/22 15:00 – This wave of very strong activity has reduced fro now, started at 10 UTC went above Power 40 at 11 and has returned below the threshold of 40 at 14 UTC, 3 hours of very strong activity in which the average was Power 50.
3/22 12:30 – Big movements in progress, after the ‘opening’ at Power 50 a much more powerful activity started at 9 UTC and brought the maximum to Power 56. The changes have been significant in all parameters and at the time of this update Gaia is still telling us something.
3/22 08:30 – We’re back to a condition of strong activity, at 5 UTC we had a first movement and within 40 minutes we had a powerful peak at Power 50 for the duration of 20 minutes until 6 UTC. This initial spike has been followed by another, Power 23 at 7 UTC. The movements seem to continue.
3/21 17:00 – Today was a mild activity day, the slight variations that colored the main graph were of the Quality and Frequency. A line around 24 Hz can be seen in the primary graph, it started at 9 UTC yesterday and stopped almost exactly 24 hours later at 9 UTC today. The detector that generated this line seems to be that of the Frequency, the F4 detector has measured almost the same value for 24 hours.
3/20 17:00 – After the maximum peaks occurred during the UTC night, the movements continued with ups and downs but never stopped. At 9 UTC a surge in amplitude reached Power 34 and then lowered around Power 10, and so it remained practically until this update. In the last hours of the main graph a “colored” activity is shown, in this regard the cause of this “coloring” is due to the wide variations both in Quality and Frequency, the latter increasing. In this regard, although the variations in frequency may seem minor, these have a strong impact on the main graph and consequently on the Energy of the Collective Consciousness.
3/20 09:30 – Even today strong activity, for three days the movements have been almost continuous and at the time of this update we are above Power 30. The most massive part so far has started just after midnight UTC, the changes have brought the amplitude gradually to Power 44, this value was practically maintained for almost two consecutive hours, from about 2 am to 3:30 UTC. Thereafter there wasn’t a real pause, but only a decrease in the amplitude of these movements which once again reached a significant peak at 9 UTC with Power 34.
3/19 22:00 – As anticipated, after a series of slight movements straddling the change of graphs, from 21 UTC there has been about an hour of activity that brought the amplitude of the SR first to Power 22 and then to Power 32 just before 22 UTC.
3/19 17:00 – The activity has decreased in the period from 12 to 17 UTC but in the last two hours there are fluctuations in the Quality which, together with a slight increase in the Amplitude, suggest a restart of the movements.
3/19 11:00 – Even today we are having some activity, isolated peaks with increasing amplitude started from 1 UTC, the most significant movements were at 7:30 UTC with Power 28 and at 9:30 UTC with Power 32.
3/18 17:00 – The activity lasted about 20 hours, from 19 UTC yesterday to 15 UTC today. Now the movements have decreased significantly.
3/18 09:30 – A day of strong activity, Gaia is responding to the moment of strong impact. The strongest peaks so far have occurred in the UTC night when at midnight the amplitude reached Power 50, they were not isolated movements but a set of variations of all the values reported. From 7 UTC to now, even if the amplitude fluctuates around Power 40, both the Quality and Frequency are having very strong movements, bringing the ECC to 85.
3/18 00:00 – The new graphs started with a bang, after a first peak at Power 36 at 19:30 UTC the activity continued as predicted and continued to increase, from 21 UTC the movements increased in intensity to reach Power 45 at 22 UTC, from what we can see it seems that there will be be further activity.
3/17 21:00 – The new charts, of March 18 but technically still on 17 in UTC time, show a moderate activity that started shortly after 18 UTC and that in about 1 hour brought the amplitude to Power 36. The activity seems to continue.
3/17 17:00 – Calm.
3/17 10:30 – Another day of light activity, so far the maximum has been reached at 00 UTC today with Power 14.
3/16 17:00 – Today we saw quite significant movements started at 3 UTC and continued until 14. The maximum values did not reach high peaks but the variations of all three parameters gave a much more intense coloring than yesterday. Now it seems that we have entered a period of calm, we shall see if “Coincidence 17” will be repeated with the new graphs.
3/16 07:30 – Today’s activity has become more relevant but not so much for the variations in amplitude but rather for the movements that we can see in the line graph of the Quality and the drop in that of Frequency. This series of movements is highlighted in the main graph in the period from 3 to 7 UTC. The activity is continuing.
3/15 17:00 – No changes, slight background activity.
3/15 11:00 – The activity continued with slight movements as yesterday but with a slight increase, the strongest peak in the new charts occurred shortly after 19 UTC yesterday and reached Power 32. Subsequently, the background hum remained with variations of both Quality and Frequency, from these the lively coloring of the main graph.
3/14 17:00 – Today’s, shown in the graphs, is divided into two parts, the first characterized by calm, the second by slight movements around Power 10 that seem to continue.
3/14 11:30 – Today’s graphs show that from 2 UTC the light movements are almost continuous, the amplitude of these variations is moderate reaching several times the maximum of Power 13.
3/13 17:00 – After the peak previously reported at Power 42, which was the strongest of the day, light movements continued until 11 UTC with a final jump to Power 13 and since then it has been calm.
3/13 10:30 – In the new graphs we can see that from just after midnight UTC slight movements began which, up to 7 UTC, had oscillations of amplitude around Power 10. From 7 to 8 UTC there was a strong peak that led the amplitude at Power 42, after this movement we went back to a slight background activity.
3/12 17:00 – After the strong peak at Power 57 between 8 and 9 UTC, the activity completely and suddenly subsided returning to a calm state.
3/12 9:00 – March 12 is a special day, we would have liked to make a prediction… In any case, the activity had a small surge in yesterday’s UTC evening, between 19 and 22, with variations in amplitude that reached Power 20. These were followed by relative calm until 6 UTC when we had an isolated peak at Power 24. At 7 UTC the strongest activity so far began, and brought amplitude to Power 57 between 8 and 8:30 UTC. The ECC for this peak turns out to be 90, see table below.
3/11 22:00 – As anticipated, with the new charts we see that the activity has returned with a crescendo that, from 19 UTC, has led the amplitude to reach Power 20 at 21 UTC. The activity seems to continue.
3/11 17:00 – Slight movements continued after 7 UTC reaching a maximum of Power 8 at 14 UTC. Not much after, just at the time of this update seems like new movements are starting.
3/11 13:00 – The latest updated graphs show a period of calm that lasted from 10 UTC yesterday until 1 am when a series of very light movements around Power 10 started, these oscillations continued until 7 UTC, from that moment calm seems to have returned.
3/10 17:00 – Always and only 17, after the peaks at Power 17 the calm began at 17 local timeline, 10 UTC.
3/10 09:30 – The activity continued even if all along at moderate levels, the peaks continued around Power 17. We got it, 17… 5:5 🙂
3/9 17:00 – Power 17 remained the highest value on today’s chart but there is still a slight background activity.
3/9 13:00 – The new graphs show that a slight activity has always been present for almost 48 hours. The most significant movements, so far, have started around 1 UTC when the amplitude has exceeded Power 10. Around 6 UTC there was a further increase in Power 13 and at 10 UTC we had Power 16. The crescendo is continuing and at the time of this update we are at Power 17.
3/8 17:00 – From 13 UTC the activity started to subside.
3/8 15:00 – The last 24 hours have been characterized by an average activity with the most intense part in the hours preceding midnight UTC. For the remaining part, the movements were continuous but limited around Power 10, shortly after 17 of the local timeline (10:30 UTC) there was a movement that reached Power 17.
3/7 22:00 – We had anticipated that we could have a significant activity and so it is. The rise was constant until 21 UTC when a powerful peak reached Power 41.
3/7 17:00 – Around 15 UTC started what appears to be the beginning of an activity that could become significant, the amplitude exceeded Power 10 just before 17 UTC.
3/7 13:00 – Not much to report except that the very light background movements have continued, in today’s graph we can note two isolated peaks, one at 18 UTC yesterday that reached Power 13, and one at 11 UTC today that reached Power 14.
3/6 17:00 – After a calm night (UTC), very light movements began at 3 UTC which almost cyclically brought the amplitude to Power 13 around 7 am UTC, the maximum value of today, which was repeated at 9 UTC. After these last light isolated peaks, the very slight background movements continued.
3/5 17:00 – After the last isolated peak at Power 22 happened at 13 UTC, the movements quickly subsided and we are now in a calm condition.
3/5 13:00 – The activity in today’s chart occurred in three distinct periods: from 18 to 20 UTC (yesterday) when we had the strongest peak so far at Power 36; around 1 UTC with the maximum of 29 Power; from 9 to 11 UTC with various movements that had the maximum at Power 22. If we analyze the three line graphs we see that the strongest peak, in terms of ECC, was that at 8 where we see significant variations in quality and in frequency, the value is 59.
3/4 20:30 – The slight movements that we saw at the passage of the new chart were the preamble to a series of significant spikes that started around 18 and in a few minutes brought the amplitude to Power 26, which was followed, about an hour later at 19:30 UTC, by a further increase to Power 36.
3/4 17:00 – Minor movements around Power 10 continue.
3/4 09:00 – The calm period lasted about 20 hours, from little after midnight UTC some slight movements started and reached the maximum at Power 9, from 5 UTC the values slightly increased up to Power 11. Looking at the frequency graph we see that it is actually in a downward peak, possible indicator of more powerful activity.
3/4 00:00 – The total calm in which we are in has lasted for more than 12 hours.
3/3 17:00 – The last two isolated movements, before the calm, occurred at 9 and 11 UTC reaching Power 9.
3/3 10:00 – In the new main graph we see a series of very close vertical thin lines that begin shortly after midnight UTC and from 6 am start to fade out. The peaks have been of moderate values, so far the maximum has been Power 13 just before 4 UTC. It can be noted, once again, how the movements that have the most ‘chromatic’ impact on the graph are those that have seen changes also in the Quality.
3/2 17:00 – Other minor movements in the latter part of the day around Power 10 occurred between 9 and 12 UTC, after which it was calm.
3/2 09:00 – Today’s chart shows a calm condition until 1 UTC when few slight isolated movements started, they occurred over a 8 hours hours period, until 9 UTC. The maximum value reached was Power 21 at 5 UTC, this specific movement saw frequency and quality oscillations, in addition to the amplitude, and the ECC value was 43.
3/1 17:00 – Today’s graphs show two different types of activity, one given only by the Amplitude, identified by the isolated white lines, and one given by the other parameters, with various colors of green yellow and red. Today’s periods of greatest activity do not correspond to the maximum amplitude peaks, which reached Power 10 just before 1 UTC. The most intense, relatively speaking, part instead took place from 20 to 21 UTC yesterday.
Frequency means how many wave cycle happen in a second, 1 Hz. means 1 cycle per second, 40 Hz. means 40 cycles per second, Amplitude is the size of the vibration, how big is the wave, the chart shows the frequency variation in Hz and the amplitude using the white color.
Note
The Ancient Indian Rishis called 7.83 Hz the frequency of OM. It also happens to be Mother Earth’s natural heartbeat rhythm Schumann resonances are named after professor Schumann who was involved in early German secret space program and was later paper-clipped into the United States. The frequencies of Schumann resonances are fairly stable and are mainly defined by the physical size of the ionospheric cavity. The amplitude of Schumann resonances does change and is bigger when ionospheric plasma gets excited. Ionospheric plasma excitation happens because of solar activity, thunderstorms, use of scalar plasma weapons and HAARP and lately also when the Light forces are clearing the plasma anomaly. Show entriesSearch:
All the SR daily images in one single page See the Images
Explanation of The Chart
The Schumann Resonance Spectrogram Chart
The Schumann Resonance Chart displays data from the magnetic field detector to monitor the resonances occurring in the plasma waves constantly circling the earth in the ionosphere. These three days spectrograms show the activity occurring at the various resonant frequencies from 1 to 40 Hz. Within the spectrogram, the power, or intensity level of each frequency is displayed as a color, with white being the most intense. The Schumann Resonances appear as the horizontal lines at 0.0, 4.0, 8.0, 12.0, 16.0, 20.0, 24.0, 28.0, 32.0, 36.0 & 40.0 Hz. This chart is based on Tomsk, Russia, time UTC +7 (UTC = Universal Time Coordinated).
What is a Spectrogram?
The Spectrogram Calendar is a visual representation of the range of frequencies in the magnetic field at a given location. Similar to how an equalizer displays the frequency content of music played on your stereo, the spectrogram calendar displays the frequency content of a magnetic field. Instead of showing a brief snapshot, it shows changes over a period of time, in this case 3 days.
The local magnetic field is a dynamic field that changes constantly because of variations in the ionosphere and sun and many other influences not yet fully understood. The range of variation displayed in the spectrogram chart is from 0 to 40 cycles per second. The vertical axis is frequency and the horizontal axis is time. The amplitude of a particular frequency at a specific time is represented by the intensity of color (green, yellow, white) of each point in the image.
Editor’s Note: Not so much activity seen today on the graph showing Schumann Resonance energies and one must wonder about the emergence of these energies in the near future as more and more remain sequestered and free of distraction.
Thanks for following cosmic energies such as the Schumann Resonance as they arrive on Earth, know their affect on humanity in encompassing more Love, allowing all to hold and BE in…
Schumann Resonance Today. We will try to keep you updated about the variations of the Resonance with this page. The great variations that nobody can explain but that give us a clear sign that the planet is changing. The Earth is vibration higher and higher, just like us!
The Chart time is based on Tomsk – Russia – UTC (Universal Time Coordinated) +7Source
RS Base Frequency 7.83 Hz.
Schumann Resonance Today Peaks:
“Every second, a multitude of pulses travel around the world in this unique, resonant chamber between Earth and the ionosphere, sending colluding signals to all microorganisms. These signals couple us to the Earth’s magnetic field. Named after their discoverer, these Schumann Resonances (SR) drive the harmonizing pulse for life in our world.” Eric Thompson
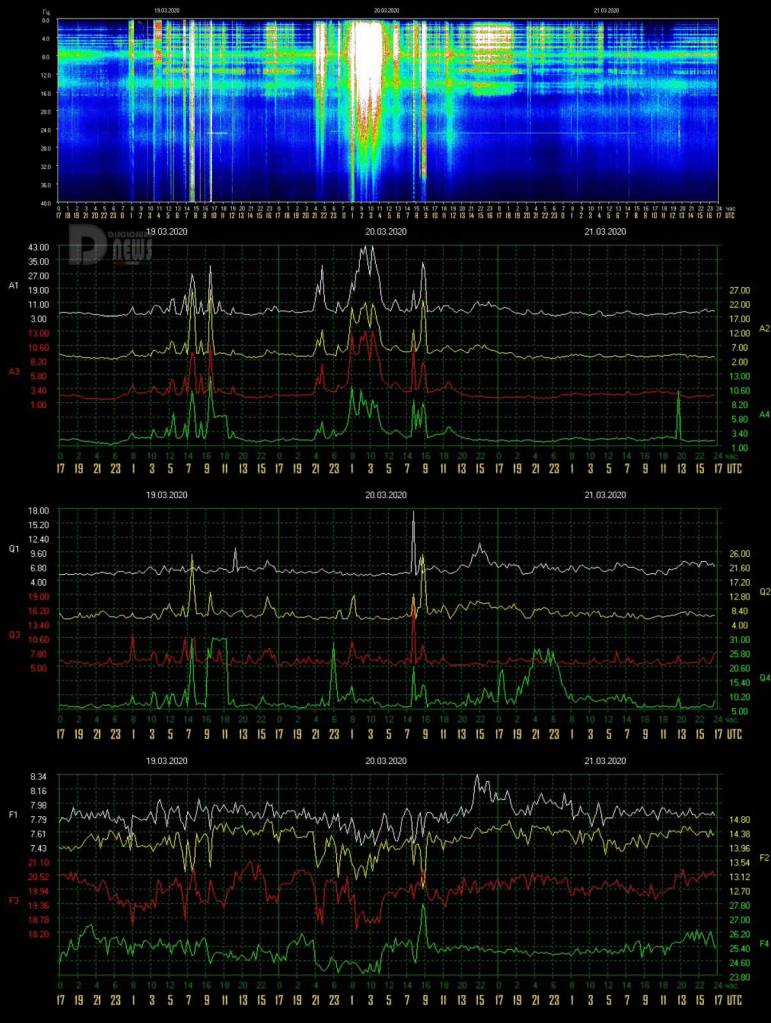
3/21 17:00 – Today was a mild activity day, the slight variations that colored the main graph were of the Quality and Frequency. A line around 24 Hz can be seen in the primary graph, it started at 9 UTC yesterday and stopped almost exactly 24 hours later at 9 UTC today. The detector that generated this line seems to be that of the Frequency, the F4 detector has measured almost the same value for 24 hours.
3/20 17:00 – After the maximum peaks occurred during the UTC night, the movements continued with ups and downs but never stopped. At 9 UTC a surge in amplitude reached Power 34 and then lowered around Power 10, and so it remained practically until this update. In the last hours of the main graph a “colored” activity is shown, in this regard the cause of this “coloring” is due to the wide variations both in Quality and Frequency, the latter increasing. In this regard, although the variations in frequency may seem minor, these have a strong impact on the main graph and consequently on the Energy of the Collective Consciousness.
3/20 09:30 – Even today strong activity, for three days the movements have been almost continuous and at the time of this update we are above Power 30. The most massive part so far has started just after midnight UTC, the changes have brought the amplitude gradually to Power 44, this value was practically maintained for almost two consecutive hours, from about 2 am to 3:30 UTC. Thereafter there wasn’t a real pause, but only a decrease in the amplitude of these movements which once again reached a significant peak at 9 UTC with Power 34.
3/19 22:00 – As anticipated, after a series of slight movements straddling the change of graphs, from 21 UTC there has been about an hour of activity that brought the amplitude of the SR first to Power 22 and then to Power 32 just before 22 UTC.
3/19 17:00 – The activity has decreased in the period from 12 to 17 UTC but in the last two hours there are fluctuations in the Quality which, together with a slight increase in the Amplitude, suggest a restart of the movements.
3/19 11:00 – Even today we are having some activity, isolated peaks with increasing amplitude started from 1 UTC, the most significant movements were at 7:30 UTC with Power 28 and at 9:30 UTC with Power 32.
3/18 17:00 – The activity lasted about 20 hours, from 19 UTC yesterday to 15 UTC today. Now the movements have decreased significantly.
3/18 09:30 – A day of strong activity, Gaia is responding to the moment of strong impact. The strongest peaks so far have occurred in the UTC night when at midnight the amplitude reached Power 50, they were not isolated movements but a set of variations of all the values reported. From 7 UTC to now, even if the amplitude fluctuates around Power 40, both the Quality and Frequency are having very strong movements, bringing the ECC to 85.
3/18 00:00 – The new graphs started with a bang, after a first peak at Power 36 at 19:30 UTC the activity continued as predicted and continued to increase, from 21 UTC the movements increased in intensity to reach Power 45 at 22 UTC, from what we can see it seems that there will be be further activity.
3/17 21:00 – The new charts, of March 18 but technically still on 17 in UTC time, show a moderate activity that started shortly after 18 UTC and that in about 1 hour brought the amplitude to Power 36. The activity seems to continue.
3/17 17:00 – Calm.
3/17 10:30 – Another day of light activity, so far the maximum has been reached at 00 UTC today with Power 14.
3/16 17:00 – Today we saw quite significant movements started at 3 UTC and continued until 14. The maximum values did not reach high peaks but the variations of all three parameters gave a much more intense coloring than yesterday. Now it seems that we have entered a period of calm, we shall see if “Coincidence 17” will be repeated with the new graphs.
3/16 07:30 – Today’s activity has become more relevant but not so much for the variations in amplitude but rather for the movements that we can see in the line graph of the Quality and the drop in that of Frequency. This series of movements is highlighted in the main graph in the period from 3 to 7 UTC. The activity is continuing.
3/15 17:00 – No changes, slight background activity.
3/15 11:00 – The activity continued with slight movements as yesterday but with a slight increase, the strongest peak in the new charts occurred shortly after 19 UTC yesterday and reached Power 32. Subsequently, the background hum remained with variations of both Quality and Frequency, from these the lively coloring of the main graph.
3/14 17:00 – Today’s, shown in the graphs, is divided into two parts, the first characterized by calm, the second by slight movements around Power 10 that seem to continue.
3/14 11:30 – Today’s graphs show that from 2 UTC the light movements are almost continuous, the amplitude of these variations is moderate reaching several times the maximum of Power 13.
3/13 17:00 – After the peak previously reported at Power 42, which was the strongest of the day, light movements continued until 11 UTC with a final jump to Power 13 and since then it has been calm.
3/13 10:30 – In the new graphs we can see that from just after midnight UTC slight movements began which, up to 7 UTC, had oscillations of amplitude around Power 10. From 7 to 8 UTC there was a strong peak that led the amplitude at Power 42, after this movement we went back to a slight background activity.
3/12 17:00 – After the strong peak at Power 57 between 8 and 9 UTC, the activity completely and suddenly subsided returning to a calm state.
3/12 9:00 – March 12 is a special day, we would have liked to make a prediction… In any case, the activity had a small surge in yesterday’s UTC evening, between 19 and 22, with variations in amplitude that reached Power 20. These were followed by relative calm until 6 UTC when we had an isolated peak at Power 24. At 7 UTC the strongest activity so far began, and brought amplitude to Power 57 between 8 and 8:30 UTC. The ECC for this peak turns out to be 90, see table below.
3/11 22:00 – As anticipated, with the new charts we see that the activity has returned with a crescendo that, from 19 UTC, has led the amplitude to reach Power 20 at 21 UTC. The activity seems to continue.
3/11 17:00 – Slight movements continued after 7 UTC reaching a maximum of Power 8 at 14 UTC. Not much after, just at the time of this update seems like new movements are starting.
3/11 13:00 – The latest updated graphs show a period of calm that lasted from 10 UTC yesterday until 1 am when a series of very light movements around Power 10 started, these oscillations continued until 7 UTC, from that moment calm seems to have returned.
3/10 17:00 – Always and only 17, after the peaks at Power 17 the calm began at 17 local timeline, 10 UTC.
3/10 09:30 – The activity continued even if all along at moderate levels, the peaks continued around Power 17. We got it, 17… 5:5 🙂
3/9 17:00 – Power 17 remained the highest value on today’s chart but there is still a slight background activity.
3/9 13:00 – The new graphs show that a slight activity has always been present for almost 48 hours. The most significant movements, so far, have started around 1 UTC when the amplitude has exceeded Power 10. Around 6 UTC there was a further increase in Power 13 and at 10 UTC we had Power 16. The crescendo is continuing and at the time of this update we are at Power 17.
3/8 17:00 – From 13 UTC the activity started to subside.
3/8 15:00 – The last 24 hours have been characterized by an average activity with the most intense part in the hours preceding midnight UTC. For the remaining part, the movements were continuous but limited around Power 10, shortly after 17 of the local timeline (10:30 UTC) there was a movement that reached Power 17.
3/7 22:00 – We had anticipated that we could have a significant activity and so it is. The rise was constant until 21 UTC when a powerful peak reached Power 41.
3/7 17:00 – Around 15 UTC started what appears to be the beginning of an activity that could become significant, the amplitude exceeded Power 10 just before 17 UTC.
3/7 13:00 – Not much to report except that the very light background movements have continued, in today’s graph we can note two isolated peaks, one at 18 UTC yesterday that reached Power 13, and one at 11 UTC today that reached Power 14.
3/6 17:00 – After a calm night (UTC), very light movements began at 3 UTC which almost cyclically brought the amplitude to Power 13 around 7 am UTC, the maximum value of today, which was repeated at 9 UTC. After these last light isolated peaks, the very slight background movements continued.
3/5 17:00 – After the last isolated peak at Power 22 happened at 13 UTC, the movements quickly subsided and we are now in a calm condition.
3/5 13:00 – The activity in today’s chart occurred in three distinct periods: from 18 to 20 UTC (yesterday) when we had the strongest peak so far at Power 36; around 1 UTC with the maximum of 29 Power; from 9 to 11 UTC with various movements that had the maximum at Power 22. If we analyze the three line graphs we see that the strongest peak, in terms of ECC, was that at 8 where we see significant variations in quality and in frequency, the value is 59.
3/4 20:30 – The slight movements that we saw at the passage of the new chart were the preamble to a series of significant spikes that started around 18 and in a few minutes brought the amplitude to Power 26, which was followed, about an hour later at 19:30 UTC, by a further increase to Power 36.
3/4 17:00 – Minor movements around Power 10 continue.
3/4 09:00 – The calm period lasted about 20 hours, from little after midnight UTC some slight movements started and reached the maximum at Power 9, from 5 UTC the values slightly increased up to Power 11. Looking at the frequency graph we see that it is actually in a downward peak, possible indicator of more powerful activity.
3/4 00:00 – The total calm in which we are in has lasted for more than 12 hours.
3/3 17:00 – The last two isolated movements, before the calm, occurred at 9 and 11 UTC reaching Power 9.
3/3 10:00 – In the new main graph we see a series of very close vertical thin lines that begin shortly after midnight UTC and from 6 am start to fade out. The peaks have been of moderate values, so far the maximum has been Power 13 just before 4 UTC. It can be noted, once again, how the movements that have the most ‘chromatic’ impact on the graph are those that have seen changes also in the Quality.
3/2 17:00 – Other minor movements in the latter part of the day around Power 10 occurred between 9 and 12 UTC, after which it was calm.
3/2 09:00 – Today’s chart shows a calm condition until 1 UTC when few slight isolated movements started, they occurred over a 8 hours hours period, until 9 UTC. The maximum value reached was Power 21 at 5 UTC, this specific movement saw frequency and quality oscillations, in addition to the amplitude, and the ECC value was 43.
3/1 17:00 – Today’s graphs show two different types of activity, one given only by the Amplitude, identified by the isolated white lines, and one given by the other parameters, with various colors of green yellow and red. Today’s periods of greatest activity do not correspond to the maximum amplitude peaks, which reached Power 10 just before 1 UTC. The most intense, relatively speaking, part instead took place from 20 to 21 UTC yesterday.
Frequency means how many wave cycle happen in a second, 1 Hz. means 1 cycle per second, 40 Hz. means 40 cycles per second, Amplitude is the size of the vibration, how big is the wave, the chart shows the frequency variation in Hz and the amplitude using the white color.
Note
The Ancient Indian Rishis called 7.83 Hz the frequency of OM. It also happens to be Mother Earth’s natural heartbeat rhythm Schumann resonances are named after professor Schumann who was involved in early German secret space program and was later paper-clipped into the United States. The frequencies of Schumann resonances are fairly stable and are mainly defined by the physical size of the ionospheric cavity. The amplitude of Schumann resonances does change and is bigger when ionospheric plasma gets excited. Ionospheric plasma excitation happens because of solar activity, thunderstorms, use of scalar plasma weapons and HAARP and lately also when the Light forces are clearing the plasma anomaly. Show entriesSearch:
All the SR daily images in one single page See the Images
Explanation of The Chart
The Schumann Resonance Spectrogram Chart
The Schumann Resonance Chart displays data from the magnetic field detector to monitor the resonances occurring in the plasma waves constantly circling the earth in the ionosphere. These three days spectrograms show the activity occurring at the various resonant frequencies from 1 to 40 Hz. Within the spectrogram, the power, or intensity level of each frequency is displayed as a color, with white being the most intense. The Schumann Resonances appear as the horizontal lines at 0.0, 4.0, 8.0, 12.0, 16.0, 20.0, 24.0, 28.0, 32.0, 36.0 & 40.0 Hz. This chart is based on Tomsk, Russia, time UTC +7 (UTC = Universal Time Coordinated).
What is a Spectrogram?
The Spectrogram Calendar is a visual representation of the range of frequencies in the magnetic field at a given location. Similar to how an equalizer displays the frequency content of music played on your stereo, the spectrogram calendar displays the frequency content of a magnetic field. Instead of showing a brief snapshot, it shows changes over a period of time, in this case 3 days.
The local magnetic field is a dynamic field that changes constantly because of variations in the ionosphere and sun and many other influences not yet fully understood. The range of variation displayed in the spectrogram chart is from 0 to 40 cycles per second. The vertical axis is frequency and the horizontal axis is time. The amplitude of a particular frequency at a specific time is represented by the intensity of color (green, yellow, white) of each point in the image.
The Great Awakening (‘Freedom of Thought’), was designed and created not only as a BACKCHANNEL to the public (away from the longstanding ‘mind’ control of the corrupt & heavily biased media) to endure future events through transparency and regeneration of individual thought (breaking the chains of ‘group-think’), but, more importantly, aid in the construction of a vehicle ( A ‘SHIP’ ) that provides the scattered (‘free thinkers’) with a ‘starter’ new social-networking platform which allows for freedom of thought, expression, and patriotism or national pride (the feeling of love, devotion and sense of attachment to a homeland and alliance with other citizens who share the same sentiment). – Q
The Effect of Adrenochrome and Adrenolutin On the Behavior of Animals and the Psychology of Man – This chapter describes the activity of adrenochrome and some of its derived compounds. The effect of adrenochrome is considered first upon simple systems, then more complex systems, then simple animals, and finally, upon the most complex animal, the man. animals that are given adrenochrome range from spiders, fish, and pigeons to the mammals including rats, cats, dogs, monkeys, and man. The chapter gives much original data on cats and man. Chemically, adrenochrome and adrenolutin are very reactive substances. Some of the changes produced by adrenochrome may persist several days, and in some cases, the effects lead to nearly disastrous results. Two cases of prolonged reactions are discussed in the chapter. There is also a discussion regarding the reaction that lasted more than one day after a single administration of adrenolutin as well as reactions up to one week. The changes in thinking induced by adrenochrome are similar to those observed in schizophrenia. Adrenochrome causes an elective inhibition of the process, which determines the content of associative thinking. This occurs in doses that do not heighten the lability of basic processes, do not reduce excitation, and do not loose temporary connections as is the case with LSD. https://www.sciencedirect.com/science/article/pii/S0074774208600252
Ronaldinho scores five goals in Paraguay prison game. The famous footballer ended up in Paraguayan prison over accusations of using a fake passport to enter the country. Several media outlets earlier reported that the now-retired athlete was stripped of his Brazilian and Spanish passports by authorities over debts and unpaid taxes.
Major European airlines are set to axe thousands of jobs and, without bailouts, some are facing collapse as the coronavirus pandemic wreaks havoc on the industry. The French government said it is not considering a bailout of Air France-KLM at this stage, as the airline struggles for survival amidst the public health crisis. Scandanavian Airlines is reportedly laying off 100 pilots and 100 cabin crew on a temporary basis while Swiss International is taking half its fleet out of service and reducing working hours for flight personnel. British Airways reportedly tell employees that it is to ground flights “like never before” and lay off workers both in the short term, and “perhaps long term.” The usually robust Ryanair also told staff they may be forced to take leave from Monday. The wave of uncertainty comes hot on the heels of Flybe, one of biggest airlines, collapsing into administration, leaving flights canceled and passengers stranded.
On March 1, the day after the first coronavirus death in the United States was announced, brothers Matt and Noah Colvin set out in a silver S.U.V. to pick up some hand sanitizer. Driving around Chattanooga, Tenn., they hit a Dollar Tree, then a Walmart, a Staples and a Home Depot. At each store, they cleaned out the shelves. Over the next three days, Noah Colvin took a 1,300-mile road trip across Tennessee and into Kentucky, filling a U-Haul truck with thousands of bottles of hand sanitizer and thousands of packs of antibacterial wipes, mostly from “little hole-in-the-wall dollar stores in the backwoods,” his brother said. “The major metro areas were cleaned out.” Matt Colvin stayed home near Chattanooga, preparing for pallets of even more wipes and sanitizer he had ordered, and starting to list them on Amazon. Mr. Colvin said he had posted 300 bottles of hand sanitizer and immediately sold them all for between $8 and $70 each, multiples higher than what he had bought them for. To him, “it was crazy money.” To many others, it was profiteering from a pandemic. The next day, Amazon pulled his items and thousands of other listings for sanitizer, wipes and face masks. The company suspended some of the sellers behind the listings and warned many others that if they kept running up prices, they’d lose their accounts. EBay soon followed with even stricter measures, prohibiting any U.S. sales of masks or sanitizer.
The largest waste dump in Ethiopia has been converted into an energy plant that turns trash into power. The Koshe waste dump has been operational for nearly 50 years, but after a terrible accident that killed 140 people in March of 2017, local officials began to consider other possible uses for the site. Ultimately, the site was turned into the first energy plant in Africa that converts trash into power and is expected to have the capacity to incinerate 1,400 tons of waste every day. Trash at the site will be burned in a combustion chamber to create heat that will be used to boil water until it turns to steam, which will then drive a turbine generator to produce electricity. It is also said that the plant will have very low emissions, which will comply with the emissions standards of the European Union. The fact that trash won’t be breaking down in the environment is another advantage.
“My biowarfare antiterrorism act was specifically designed to not only to deal with regular biological weapons but also with DNA genetic engineering for biological weapons that was just coming into its infancy when the BWC was being drafted. Even though the BWC would cover DNA genetic engineering, I wanted to make it clear by name that it was covered. I also made it clear [that] it covered synthetic biology as well. So, when these unexplained mysterious illnesses break out, I monitor them a while and usually I just conclude they can be explained by normal reasons: lack of sanitation, poverty, things of that nature. But in Wuhan it seemed pretty suspicious to me. There is this Biosafety Level 4 facility there in Wuhan. It’s the first in China, and it was specifically set up to deal with the coronavirus and SARS. SARS is basically a weaponized version of the coronavirus. There have been leaks before of SARS out of this facility, and indeed the only reason for these BSL-4 facilities, based on my experience, is the research, development, testing and stockpiling of offensive biological weapons. For that reason, I stated my opinion: That this Wuhan coronavirus leaked out of that BSL-4 facility … maybe mid-November … and the Chinese government has been lying about it and covering up ever since.” – Francis Boyle, the one who called for biowarfare legislation at the Biological Weapons Convention of 1972, and the one who drafted the Biological Weapons Anti-Terrorism Act of 1989.
The former finance minister of Greece, Yanis Varoufakis, has released a cache of audio files, secretly recorded in 2015 during the bailout talks with the Eurogroup – a powerful group of eurozone’s finance chiefs. The recordings and their transcripts were released by Varoufakis on the website of his ‘pan-European’ DiEM25 party on Saturday. The files –dubbed ‘Euroleaks’– were recorded between February and July 2015, when cash-strapped Athens was entangled in painful talks with its creditors. In 2015, Varoufakis was the chief negotiator for then-ruling Syriza party, dealing with the Eurogroup and those behind it – the so-called ‘troika.’ It comprises the three main lenders of the eurozone nations – the European Commission, the European Central Bank and the International Monetary Fund. While the Eurogroup is de-jure an informal group, it is actually a powerful decision-making institute that lacks accountability and transparency – and does not keep any records. The main goal in releasing the recordings is to shed light on its secretive activities, Varoufakis said in a video announcing the Euroleaks. The lenders took a tough, ‘take it or leave it’ stance on Greece, effectively presenting it with an ultimatum. At the same time, they blamed Greek negotiators for stalled talks – and no records were available to prove them wrong. “You will hear the [then-]president of the Eurogroup [Jeroen Dijsselbloem] and other ministers warn me that if I dare table written proposals within the Eurogroup meetings, that would be the end of the negotiations,” Varoufakis said. “At the very same time they were leaking to the press that I was arriving at Eurogroup meetings without any proposals.” Apart from bringing into the limelight the “intransparent action by an unelected group of politicians who influence all our lives,” the leaks also serve another purpose. The putting in the public domain of the secret recordings is aimed at fighting attempts by the incumbent Greek government to “weaponize fake news,” produced by the Eurogroup back in 2015 to justify new austerity measures for the country, Varoufakis said. VIDEO
Strongest EQ in Europe M3.8 Iceland Strongest EQ in North America M3.3 California Strongest EQ on the Planet M6.7 Raoul Island, New Zealand Deepest EQ M4.6 617 km Ndoi Island, Fiji News Burst 15 March 2020
Share this: Send the word out using these buttons!
13 Schumann Resonance Today. We will try to keep you updated about the variations of the Resonance with this page. The great variations that nobody can explain but that give us a clear sign that the planet is changing. The Earth is vibration higher and higher, just like us!
The Chart time is based on Tomsk – Russia – UTC (Universal Time Coordinated) +7Source
RS Base Frequency 7.83 Hz.
Schumann Resonance Today Peaks:
“Every second, a multitude of pulses travel around the world in this unique, resonant chamber between Earth and the ionosphere, sending colluding signals to all microorganisms. These signals couple us to the Earth’s magnetic field. Named after their discoverer, these Schumann Resonances (SR) drive the harmonizing pulse for life in our world.” Eric Thompson
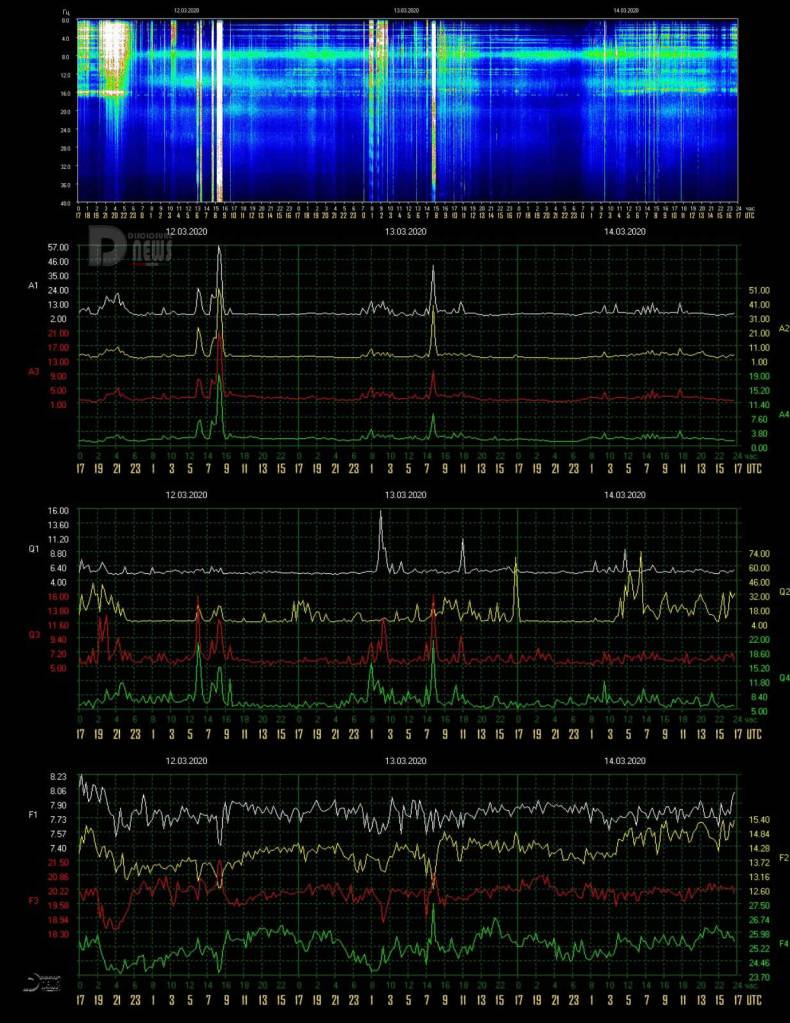
3/14 17:00 – Today’s, shown in the graphs, is divided into two parts, the first characterized by calm, the second by slight movements around Power 10 that seem to continue.
3/14 11:30 – Today’s graphs show that from 2 UTC the light movements are almost continuous, the amplitude of these variations is moderate reaching several times the maximum of Power 13.
3/13 17:00 – After the peak previously reported at Power 42, which was the strongest of the day, light movements continued until 11 UTC with a final jump to Power 13 and since then it has been calm.
3/13 10:30 – In the new graphs we can see that from just after midnight UTC slight movements began which, up to 7 UTC, had oscillations of amplitude around Power 10. From 7 to 8 UTC there was a strong peak that led the amplitude at Power 42, after this movement we went back to a slight background activity.
3/12 17:00 – After the strong peak at Power 57 between 8 and 9 UTC, the activity completely and suddenly subsided returning to a calm state.
3/12 9:00 – March 12 is a special day, we would have liked to make a prediction… In any case, the activity had a small surge in yesterday’s UTC evening, between 19 and 22, with variations in amplitude that reached Power 20. These were followed by relative calm until 6 UTC when we had an isolated peak at Power 24. At 7 UTC the strongest activity so far began, and brought amplitude to Power 57 between 8 and 8:30 UTC. The ECC for this peak turns out to be 90, see table below.
3/11 22:00 – As anticipated, with the new charts we see that the activity has returned with a crescendo that, from 19 UTC, has led the amplitude to reach Power 20 at 21 UTC. The activity seems to continue.
3/11 17:00 – Slight movements continued after 7 UTC reaching a maximum of Power 8 at 14 UTC. Not much after, just at the time of this update seems like new movements are starting.
3/11 13:00 – The latest updated graphs show a period of calm that lasted from 10 UTC yesterday until 1 am when a series of very light movements around Power 10 started, these oscillations continued until 7 UTC, from that moment calm seems to have returned.
3/10 17:00 – Always and only 17, after the peaks at Power 17 the calm began at 17 local timeline, 10 UTC.
3/10 09:30 – The activity continued even if all along at moderate levels, the peaks continued around Power 17. We got it, 17… 5:5 🙂
3/9 17:00 – Power 17 remained the highest value on today’s chart but there is still a slight background activity.
3/9 13:00 – The new graphs show that a slight activity has always been present for almost 48 hours. The most significant movements, so far, have started around 1 UTC when the amplitude has exceeded Power 10. Around 6 UTC there was a further increase in Power 13 and at 10 UTC we had Power 16. The crescendo is continuing and at the time of this update we are at Power 17.
3/8 17:00 – From 13 UTC the activity started to subside.
3/8 15:00 – The last 24 hours have been characterized by an average activity with the most intense part in the hours preceding midnight UTC. For the remaining part, the movements were continuous but limited around Power 10, shortly after 17 of the local timeline (10:30 UTC) there was a movement that reached Power 17.
3/7 22:00 – We had anticipated that we could have a significant activity and so it is. The rise was constant until 21 UTC when a powerful peak reached Power 41.
3/7 17:00 – Around 15 UTC started what appears to be the beginning of an activity that could become significant, the amplitude exceeded Power 10 just before 17 UTC.
3/7 13:00 – Not much to report except that the very light background movements have continued, in today’s graph we can note two isolated peaks, one at 18 UTC yesterday that reached Power 13, and one at 11 UTC today that reached Power 14.
3/6 17:00 – After a calm night (UTC), very light movements began at 3 UTC which almost cyclically brought the amplitude to Power 13 around 7 am UTC, the maximum value of today, which was repeated at 9 UTC. After these last light isolated peaks, the very slight background movements continued.
3/5 17:00 – After the last isolated peak at Power 22 happened at 13 UTC, the movements quickly subsided and we are now in a calm condition.
3/5 13:00 – The activity in today’s chart occurred in three distinct periods: from 18 to 20 UTC (yesterday) when we had the strongest peak so far at Power 36; around 1 UTC with the maximum of 29 Power; from 9 to 11 UTC with various movements that had the maximum at Power 22. If we analyze the three line graphs we see that the strongest peak, in terms of ECC, was that at 8 where we see significant variations in quality and in frequency, the value is 59.
3/4 20:30 – The slight movements that we saw at the passage of the new chart were the preamble to a series of significant spikes that started around 18 and in a few minutes brought the amplitude to Power 26, which was followed, about an hour later at 19:30 UTC, by a further increase to Power 36.
3/4 17:00 – Minor movements around Power 10 continue.
3/4 09:00 – The calm period lasted about 20 hours, from little after midnight UTC some slight movements started and reached the maximum at Power 9, from 5 UTC the values slightly increased up to Power 11. Looking at the frequency graph we see that it is actually in a downward peak, possible indicator of more powerful activity.
3/4 00:00 – The total calm in which we are in has lasted for more than 12 hours.
3/3 17:00 – The last two isolated movements, before the calm, occurred at 9 and 11 UTC reaching Power 9.
3/3 10:00 – In the new main graph we see a series of very close vertical thin lines that begin shortly after midnight UTC and from 6 am start to fade out. The peaks have been of moderate values, so far the maximum has been Power 13 just before 4 UTC. It can be noted, once again, how the movements that have the most ‘chromatic’ impact on the graph are those that have seen changes also in the Quality.
3/2 17:00 – Other minor movements in the latter part of the day around Power 10 occurred between 9 and 12 UTC, after which it was calm.
3/2 09:00 – Today’s chart shows a calm condition until 1 UTC when few slight isolated movements started, they occurred over a 8 hours hours period, until 9 UTC. The maximum value reached was Power 21 at 5 UTC, this specific movement saw frequency and quality oscillations, in addition to the amplitude, and the ECC value was 43.
3/1 17:00 – Today’s graphs show two different types of activity, one given only by the Amplitude, identified by the isolated white lines, and one given by the other parameters, with various colors of green yellow and red. Today’s periods of greatest activity do not correspond to the maximum amplitude peaks, which reached Power 10 just before 1 UTC. The most intense, relatively speaking, part instead took place from 20 to 21 UTC yesterday.
Frequency means how many wave cycle happen in a second, 1 Hz. means 1 cycle per second, 40 Hz. means 40 cycles per second, Amplitude is the size of the vibration, how big is the wave, the chart shows the frequency variation in Hz and the amplitude using the white color.
Note
The Ancient Indian Rishis called 7.83 Hz the frequency of OM. It also happens to be Mother Earth’s natural heartbeat rhythm Schumann resonances are named after professor Schumann who was involved in early German secret space program and was later paper-clipped into the United States. The frequencies of Schumann resonances are fairly stable and are mainly defined by the physical size of the ionospheric cavity. The amplitude of Schumann resonances does change and is bigger when ionospheric plasma gets excited. Ionospheric plasma excitation happens because of solar activity, thunderstorms, use of scalar plasma weapons and HAARP and lately also when the Light forces are clearing the plasma anomaly. Show entriesSearch:
All the SR daily images in one single page See the Images
Explanation of The Chart
The Schumann Resonance Spectrogram Chart
The Schumann Resonance Chart displays data from the magnetic field detector to monitor the resonances occurring in the plasma waves constantly circling the earth in the ionosphere. These three days spectrograms show the activity occurring at the various resonant frequencies from 1 to 40 Hz. Within the spectrogram, the power, or intensity level of each frequency is displayed as a color, with white being the most intense. The Schumann Resonances appear as the horizontal lines at 0.0, 4.0, 8.0, 12.0, 16.0, 20.0, 24.0, 28.0, 32.0, 36.0 & 40.0 Hz. This chart is based on Tomsk, Russia, time UTC +7 (UTC = Universal Time Coordinated).
What is a Spectrogram?
The Spectrogram Calendar is a visual representation of the range of frequencies in the magnetic field at a given location. Similar to how an equalizer displays the frequency content of music played on your stereo, the spectrogram calendar displays the frequency content of a magnetic field. Instead of showing a brief snapshot, it shows changes over a period of time, in this case 3 days.
The local magnetic field is a dynamic field that changes constantly because of variations in the ionosphere and sun and many other influences not yet fully understood. The range of variation displayed in the spectrogram chart is from 0 to 40 cycles per second. The vertical axis is frequency and the horizontal axis is time. The amplitude of a particular frequency at a specific time is represented by the intensity of color (green, yellow, white) of each point in the image.