Editor’s Note: Oops…pretty busy yesterday, so let’s catch up on the significant Schumann Resonance energies which were at play yesterday on July 22. This as another portal day for Earth, and as such significant energies were received by Earth from 9pm through 6am on that date.
Then on July 23, we see a lighter “fluttering” of energies from 2am through 8am (all times EDT, USA). Please remember the Schumann Resonance energies are set from from the Earth in response to receiving cosmic energies…kind of like a bell ringing?
Thanks for staying aware of the energies influencing your life on Planet Earth, and then BE in…
Schumann Resonance Today. We will try to keep you updated about the variations of the Resonance with this page. The great variations that nobody can explain but that give us a clear sign that the planet is changing. The Earth is vibration higher and higher, just like us!
The Chart time is based on Tomsk – Russia – UTC (Universal Time Coordinated) +7 –Source
SR Base Frequency 7.83 Hz. – Schumann Resonance Today’s Peaks
20
Amplitude
5.20
Quality
8.08
Frequency Max
7.52
Frequency Min
10
Ampltude A2
7
Ampltude A3
5
Ampltude A4
“Every second, a multitude of pulses travel around the world in this unique, resonant chamber between Earth and the ionosphere, sending colluding signals to all microorganisms. These signals couple us to the Earth’s magnetic field. Named after their discoverer, these Schumann Resonances (SR) drive the harmonizing pulse for life in our world.” Eric Thompson
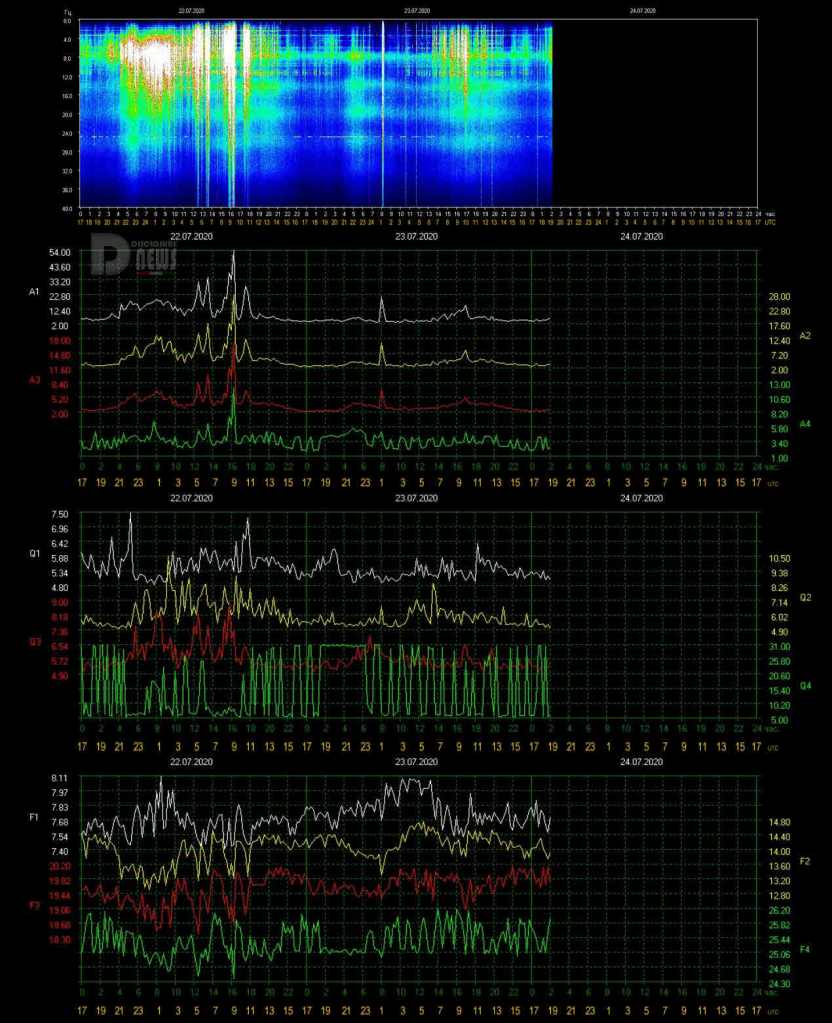
Today’s activity is summed up in an isolated peak at Power 20 at 1 UTC and a series of variations from 7 to 10 UTC with a maximum value of Power 15.
7/23 10:30
The Frequency continued to decrease until it reached 7.50 Hz around 9 UTC when the Amplitude also started to move, passing Power 10 shortly after.
7/23 08:30
Analyzing the Frequency graph, it can be seen how a gradual rise towards the base value began yesterday at 11 UTC, this increase however did not stay long at 7.83 Hz, it continued to rise up to exceed 8 Hz. Note that at 8 UTC there is a dent, which has started the further increase, and this corresponds to the variation of the Amplitude which has reached the maximum value until now, Power 20. Around 6:30, after staying for about 4 hours above 8 Hz, there has been a sharp drop that will probably generate some more light movement in the Amplitude.
7/22 23:00
The Frequency finally returned to the base value of 7.83 Hz with a slow ascent that began at 11 UTC. The situation seems calm, only slight Amplitude fluctuations from 21 UTC.
7/22 17:30
The activity started to decrease significantly from 11 UTC after the last move to Power 29, at the same the the frequency stabilized on 7.66 Hz, six hours with very little variations.
7/22 11:00
There was no calm, the activity that started yesterday at 21 UTC is continuing in a series of waves of increasing amplitude. After a start, yesterday, with approximately 6 continuous hours of Power 20, there was a pause of about 2 hours. At 5 UTC there were two movements at Power 35, corresponding to a sharp drop in frequency below 7.50 Hz. Another one hour break and another peak, this time at Power 55 occurred shortly after 9 UTC. At the time of this update, the frequency fluctuations remain large, going cyclically below 7.50 Hz.
7/21 22:00
The situation is still unstable with the Frequency remaining around 7.60 Hz, this seems to cause ripples in the Amplitude that reached Power 18 at 21.30 UTC.
7/21 17:00
Today’s activity was concentrated in 6 hours, from 5 to 11 UTC, from 7 to 10 was the most intense part with the peak at Power 30 and the long resilience at Power 20. From 11 the situation is calm although, as yesterday, the Frequency is oscillating around 7.60 Hz.
7/21 11:00
The Frequency is keeping the lower side of the spectrum and the Amplitude produced a new maximum, Power 30 at 8:15 UTC and subsequently staying at Power 20 for more than an hour until 10 UTC.
7/21 09:30
With the continued Frequency oscillations a new maximum Amplitude value arrived, Power 30 at 8:20 UTC.
7/21 08:00
In the new graphs we can see how the Frequency, after remaining for almost 17 hours oscillating on the 7.60 Hz thereshold, from 1 UTC raised slightly stabilizing on 7.75 Hz. This maintained a situation of instability that was accentuated at 5 UTC with amplitude oscillations that began to exceed Power 10. Shortly before 7 UTC the frequency had a rapid dip below 7.50 Hz and this seems to have increased the amplitude oscillations leading it to reach Power 22 at 7:45 UTC.
7/20 23:30
The situation of instability continues, the Frequency has remained on average at 7.60 Hz since shortly after 6 UTC, therefore 16 hours.
7/20 17:00
The frequency continues to remain around 7.60 Hz so it is not a completely calm situation with amplitude and quality having small oscillations.
7/20 15:30
After several days of calm, today the activity has returned in a powerful way, the first period lasted about 6 hours, from 21 to 3 am UTC, touching Power 50 three times; the second period started after 4 hours of calm, at 7 UTC, and lasted just over 6 hours, after a steep initial climb to Power 52 and an hour of strong intensity at 50, the amplitude started to increase again until topping to Power 81. The drop after the peak was sudden and at 14 UTC the amplitude was back to normal values. In all this, the frequency, excluded the calm part from 3 to 7, has had wide variations around 7.60 Hz.
7/20 12:30
From 11 UTC there was a further rapid increase that brought the Amplitude to Power 81 shortly before 12 UTC. The frequency remains oscillating around 7.60 Hz.
7/20 11:45
The Freuency remains very low and more Amplitude movements reached again Power 52 at 11:20 UTC.
7/20 11:30
Another powerful period of activity started at 7 UTC, just under four hours after the previous one and, like that one, reached Power 51 quite quickly just before 10 UTC. During this second movement there was a further drop in frequency which reached 7.35 Hz as a minimum value around 10 UTC.
7/20 8:30
Today’s first movement lasted about 6 hours straddling midnight UTC, from 21 to 2 am. From 23 to 2 it was a succession of very strong peaks, Power 48, Power 52 and Power 50. One last move at Power 23 occurred at 2 UTC during the rapid drop in Amplitude towards normal values. The frequency during this phase remained at 7.50 Hz and then returned to the base value from 4 UTC. From 7 the frequency started again a rapid drop towards 7.50 Hz, once again setting the Amplitude in motion that at the time of this update is passing Power 20.
7/20 00:00
The strong movement started at 21 UTC was not anticipated by any particular signal, the Frequency was in a cycle of wide oscillations from 17 UTC. The amplitude started to increase suddenly at 22 UTC and reached the maximum value of Power 52 at 23:40.
7/19 17:00
Not much to report if not the cyclical ripple of the frequency values which did not produced any significant movement.
7/19 15:00
From 9 UTC the Frequency started the cycle down again, reaching 7.50 Hz at 2 pm UTC. Previously, during this descent, at 11:30 a peak was recorded at Power 11.
7/19 09:00
Calm is continuing, the Frequency has started to rise towards the base value at 21 UTC yesterday where it stabilized from 3 UTC today, currently the Amplitude is around Power 5.
7/18 20:30
A downward fluctuation in Frequency that between 18 and 20 UTC reached 7.35 Hz, slightly moved the amplitude that reached Power 10 at 19:30 UTC.
7/18 17:00
Total calm throughout the day, in the last few hours the frequency gradually began to decrease to reach 7.60 Hz at the time of this update. Power 8 is the minum value registered during July 2020 until now.
7/18 14:00
Total calm, maximum value reached was Power 8 at 11 UTC.
Frequency means how many wave cycle happen in a second, 1 Hz. means 1 cycle per second, 40 Hz. means 40 cycles per second, Amplitude is the size of the vibration, how big is the wave, the chart shows the frequency variation in Hz and the amplitude using the white color.
Note
The Ancient Indian Rishis called 7.83 Hz the frequency of OM. It also happens to be Mother Earth’s natural heartbeat rhythm. Schumann resonances are named after professor Schumann who was involved in early German secret space program and was later paper-clipped into the United States. The frequencies of Schumann resonances are fairly stable and are mainly defined by the physical size of the ionospheric cavity. The amplitude of Schumann resonances does change and is bigger when ionospheric plasma gets excited. Ionospheric plasma excitation happens because of solar activity, thunderstorms, use of scalar plasma weapons and HAARP and lately also when the Light forces are clearing the plasma anomaly.
Schumann Resonance Today – Energy of Consciousness Currents
All the SR daily images in one single page See the Images
Explanation of The Chart
The Schumann Resonance Spectrogram Chart
The Schumann Resonance Chart displays data from the magnetic field detector to monitor the resonances occurring in the plasma waves constantly circling the earth in the ionosphere. These three days spectrograms show the activity occurring at the various resonant frequencies from 1 to 40 Hz. Within the spectrogram, the power, or intensity level of each frequency is displayed as a color, with white being the most intense. The Schumann Resonances appear as the horizontal lines at 0.0, 4.0, 8.0, 12.0, 16.0, 20.0, 24.0, 28.0, 32.0, 36.0 & 40.0 Hz. This chart is based on Tomsk, Russia, time UTC +7 (UTC = Universal Time Coordinated).
What is a Spectrogram?
The Spectrogram Calendar is a visual representation of the range of frequencies in the magnetic field at a given location. Similar to how an equalizer displays the frequency content of music played on your stereo, the spectrogram calendar displays the frequency content of a magnetic field. Instead of showing a brief snapshot, it shows changes over a period of time, in this case 3 days.
The local magnetic field is a dynamic field that changes constantly because of variations in the ionosphere and sun and many other influences not yet fully understood. The range of variation displayed in the spectrogram chart is from 0 to 40 cycles per second. The vertical axis is frequency and the horizontal axis is time. The amplitude of a particular frequency at a specific time is represented by the intensity of color (green, yellow, white) of each point in the image.
Editor’s Note: The Schumann Resonance energies have been fairly light over the past 24 hours with the exception of light and “fluttery” energies from midnight through 3pm on 5/28. Slight beams of intense energy lasting for perhaps 5 minutes were also seen during this time.
Thanks for keeping aware of the energetic nature of Earth, and also of you (!), and BE in…
Schumann Resonance Today. We will try to keep you updated about the variations of the Resonance with this page. The great variations that nobody can explain but that give us a clear sign that the planet is changing. The Earth is vibration higher and higher, just like us!
The Chart time is based on Tomsk – Russia – UTC (Universal Time Coordinated) +7 –Source
SR Base Frequency 7.83 Hz. – Schumann Resonance Today’s Peaks
21
Amplitude
8
Quality
7.95
Frequency Max
7.33
Frequency Min
12
Ampltude A2
8
Ampltude A3
6
Ampltude A4
“Every second, a multitude of pulses travel around the world in this unique, resonant chamber between Earth and the ionosphere, sending colluding signals to all microorganisms. These signals couple us to the Earth’s magnetic field. Named after their discoverer, these Schumann Resonances (SR) drive the harmonizing pulse for life in our world.” Eric Thompson
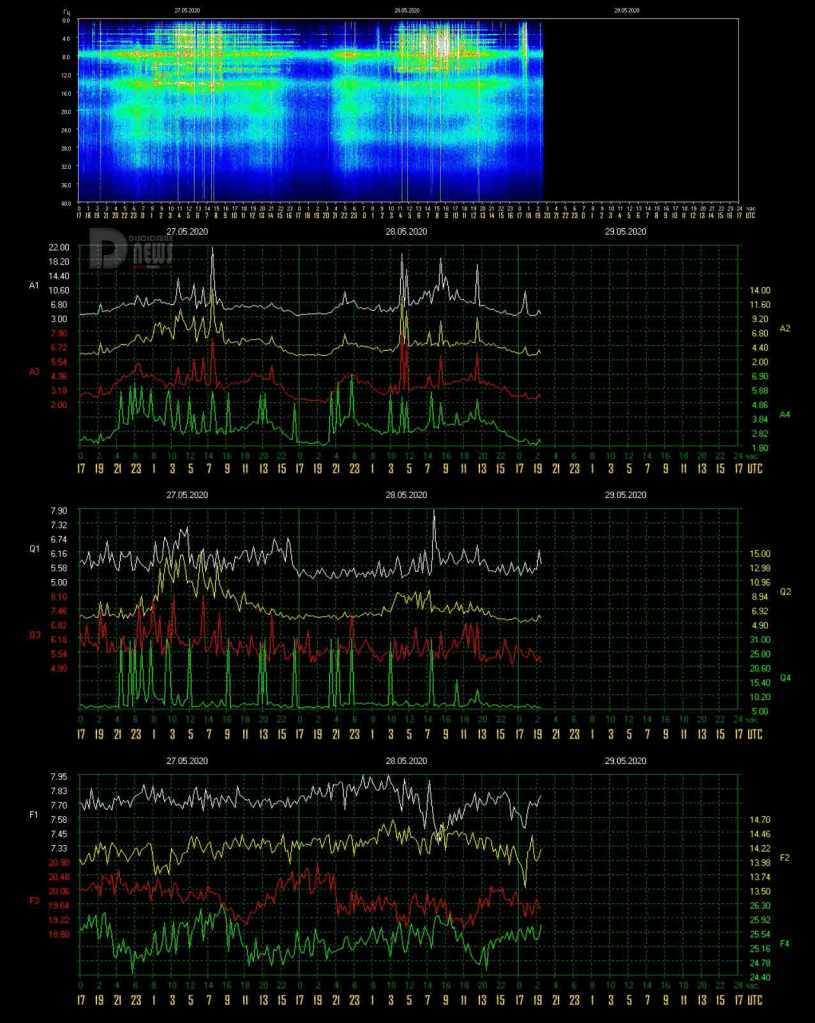
5/28 17:00 – The slight activity shown in the graphs lasted about 8 hours, the most intense phase was from 7 to 9 UTC when there were large frequency fluctuations. From 13 UTC the situation has normalized even if the Frequency remains basically low.
5/28 12:00 – The calm period shown in the new graphs lasted about 18 hours, until 3 UTC this morning, when the Frequency started to oscillate with a gradual descent towards the minimum value of 7.33 Hz. The Amplitude also started oscillations reaching Power 21 shortly after 4 UTC and again at the same time as the minimum frequency peak at 8 UTC.
5/27 17:00 – Calm.
5/27 10:30 – After yesterday’s powerful activity, there were only 4 hours of calm, from 17 to 21 UTC. The movements that started then were however very light although steadily increasing. The Amplitude began to touch Power 10 from 3:30 UTC culminating with the maximum value so far of Power 23 reached at 7:30 UTC. Frequency remained basically stable slightly below the base value of 7.83 Hz.
5/26 17:00 – The movements seem to have calmed down, the descent towards the minimum values began at 14 UTC when the Frequency also started a jagged ascent; from 16 UTC the situation seems calm.
5/26 15:30 – Today’s activity, apart from the black hole, has so far been very powerful. To us, conspiracy theorists who don’t believe in coincidences, screeches a lot that during the peak phase there was this suspicious darkening where probably a more than significant value was reached; who cares, things do not change much in the end. Probably today the combination of Amplitude, Frequency and Quality would have brought the value of the ECC to touch the 500. The part after the hole, however, saw very wide oscillations that reached and exceeded Power 70 at 11:40 and at 13:15 UTC.
5/26 12:00 – After a temporary interruption of the data source site, the situation has partially returned to normal and what we see is massive activity! The first period of activity started at 2 UTC when the Amplitude started a steep climb which led to the strongest peak of this first phase of Power 67 at 3:30 UTC. This was followed by about 2 hours above Power 50. This first move ended at 5:30 UTC. At 7 UTC a new surge, constant and continuous, brought Amplitude to Power 72 at 8:20 UTC. This phase was interrupted by a BLACKOUT that started at 9 UTC and ended at 11:30 UTC, too bad, there were probably other very significant peaks … I don’t think we’ll ever know. At the moment of this update the Amplitude is still rising around Power 70.
5/26 09:00 – The TSU website is down, cannot be reached. While we wait to the site to return online we are going to use this temporary chart, it shows light activity that started little before 6 am UTC.
5/25 17:00 – Today has been a day in which there were no Amplitude movements that exceeded Power 11, this maximum was touched around midnight UTC, at 4 and at 13:30 UTC the Amplitude approached Power 10. The frequency, since few hours, is steadily and gradually decreasing, at the time of this update it is around 7.55 Hz and an isolated Amplitude movement is being generated that has reached Power 17.
5/24 17:00 – After the activity previously reported, the peak at Power 47 at 7 UTC followed by a minor movement that reached Power 24 at 8:30 UTC, the situation returned calm. This until 15 UTC when the Frequency has started to decrease until it reached 7.41 Hz at 16:30 UTC. This decrease can be seen in the main graph with the most intense coloring in the last hour. We will see if this decrease will lead to Amplitude’s movements or will be temporary.
5/24 08:00 – After about 18 hours of total calm, at 6:30 UTC today, suddenly, the frequency had a drop from 8.03 Hz to 7.47 in 40 minutes, this gave way to a strong variation of amplitude that at 7:30 UTC reached Power 47; we could paraphrase this event as a person who is trotting at short (Amplitude) and frequent (Frequency) steps who suddenly changes pace to a reduced frequency but with large strides (Amplitude).
5/23 17:00 – Even today we can say that it was not a real calm day, there were some short-lived isolated peaks, Power 17 shortly before 7 UTC and Power 12, lasting about an hour, from 10 to 11 UTC. Some wide fluctuations in Quality, without reaching high values, colored the main graph between 2 and 4 UTC. Frequency remained much of the time around the base value with a slight drop towards the end of the graph.
5/22 17:00 – An isolated peak, lasted about an hour, occurred from 15 to 16 UTC reaching a maximum value of Power 32 and coincided with a decrease in Frequency down to 7.54 Hz. It returned immediately afterwards towards values normal. Today, however, there has never been a real calm, various parameters have oscillated, the one that has had the most movements is the Frequency.
5/22 14:00 – Not much to report today, mainly there was no calm but not even significant activity, slight Amplitude fluctuations with a maximum at Power 10 at 7 UTC, calm in Quality apart from the first hours of the day and Frequency that oscillates around the base value.
5/21 20:00 – The scale of the Amplitude graph has changed and we clearly see that the maximum peak today was Power 50; the activity is continuing with more marked fluctuations also in Quality, the Amplitude has reached Power 21 at 19 UTC while the Frequency is in a phase of constant and gradual decline that has started many hours back, from the past midnight UTC, it has now reached the minimum value recorded today of 7.44 Hz.
5/21 17:00 – A more intense phase of activity began just before 16 UTC and in a few minutes brought the amplitude to today’s maximum peak of Power 51. With the new graphs we will be able to see more exactly how much it has reached given the very small scale of these of today. The frequency continues to remain low around 7.50 Hz.
5/21 15:50 – Moderate activity began at 13 UTC when the Frequency embarked on a slow descent to return, as previously, to 7.50 Hz. This set in motion the Amplitude that has risen above Power 20 from 13:30. UTC with a first Power 28 which was followed by another at 2. At the time of this update, the Frequency started a rapid rise with a consequent decrease in Amplitude.
5/21 09:30 – The new graphs show a situation of slight movements, in the Amplitude graph they are of little entity due to the very large scale, the two movements that are noticed have reached Power 15 at 4 UTC and Power 12 at 8 UTC. The Frequency oscillates around 7.70 Hz moving downward at the time of this update.
5/20 17:00 – The situation has calmed down considerably but the Frequency remains low, around 7.50 Hz.
5/20 13:00 – The first period of activity today lasted about 2 hours, from 4 to 6 UTC and the maximum value of Amplitude was Power 42; the second period also lasted about two hours, from 9:30 to 12 UTC and the maximum value was similar, Power 43. The difference between these two periods of movement is however remarkable in terms of graphic representation as also the other measurements of the Amplitude parameter have undergone strong increases, which have not happened previously, and therefore we see intense colors of yellow, red and green. At the time of this update, the situation seems to be moving towards calm.
5/20 08:30 – After the strong period of activity there was no calm, the amplitude did not undergo great variations but the Quality and even more the Frequency continued to oscillate without interruption. The Frequency at 4 UTC began a rapid drop towards 7.30 Hz, a value on which it remained for about 2 hours and which triggered a peak in Amplitude which reached Power 42 shortly before 5 UTC. The strong oscillations of Frequency are ongoing at the time of this update.
5/19 17:00 – The period of strong activity lasted about 12 hours, from 2 to 14 UTC when the frequency began to gradually rise towards the base levels but not yet reached at the time of this update.
5/19 14:00 – As we expected, given the frequency so low, just before 13 UTC there was a new powerful peak at Power 77 accompanied by the Quality on the rise. Frequency continues to remain at minimum values.
5/19 12:30 – The activity is gradually decreasing, at the time of this update we are around Power 30 but the Frequency remains always low around 7.30 Hz. As often happens the changes in Amplitude can be considered finished when the Frequency returns close to the base value , which hasn’t happened yet. Since the beginning of today’s activity, we have remained above Power 60 for 6 consecutive hours and during this period, from 6 to 7 UTC, the minimum has been Power 90. The Energy of Consciousness Current, for the statistics, reached 190; also on a statistical level on 27 February 2020 the Amplitude reached Power 170 and ECC 378 (due to the fact of a massive increase in the Frequency up to 8.79 Hz).
5/19 07:30 – Just before 7 UTC a new very strong peak was reached Power 110, the movements do not seem to decrease for now, the Frequency remains at minimum levels with very few oscillations.
5/19 06:30 – Very strong activity in progress, from 1 UTC the frequency started a dive that at 3 UTC brought it around 7.23 Hz, when it reached this minimum value, at 2:50 UTC, there was a strong fluctuation in Quality and Amplitude began to rise very quickly to reach two almost identical maximum values of Power 95 at 4 and 5 UTC. From 3:30 UTC we are constantly above Power 70 and at the time of this update we have surpassed Power 100 reaching 103.
5/18 17:00 – After the previous peaks the situation has calmed down considerably even if the Frequency has tended to be low with wide variations, we will see if this will be the reason for further movements or not.
5/18 13:00 – Even today the activity began shortly after 8 UTC when the Frequency started to decrease with a sharp drop to 7.23 Hz, today’s minimum; during this descent both Amplitude and Quality increased, the latter reaching 11.30 at 11 UTC. As for the Amplitude, the first movement reached the maximum value so far of Power 40 at 10 UTC, followed approximately one hour later by Power 36 and Power 23 at 12:30 UTC when the Frequency started a slight rise. At the time of this update the Frequency returned to minimum values so we might see more activity.
5/17 17:00 – Today’s activity, with a nice and flowing teardrop shape, lasted 5 hours, from 9 to 14 UTC; in the central and more intense part, from 10:30 to 12:30, the Amplitude remained constantly above Power 30 with the Frequency below 7.55 Hz. From 14 UTC with a rapid drop in Amplitude and a gradual increase in Frequency, but not towards the base value of 7.83 Hz but around 7.70 Hz, the activity has decreased considerably.
5/17 12:30 – After a period of calm that lasted about 18 hours at 7 UTC today, a marked decrease in the frequency began and gave the go to slight fluctuations in both Amplitude and Quality. These variations have taken on a much more marked characteristic from 9 UTC when the Frequency has approached the value of 7.40 Hz, since then it has been oscillations no more, the Amplitude has started a rapid increase exceeding Power 30 slightly after 10 UTC, Power 40 at 11:30 and Power 60 shortly before 12 when the Frequency has reached the minimum value of 7.40 Hz so far. This coincided with the peak of Power 69 reached at 11:40 UTC. If you have a cat you can observe his behavior in these moments.
5/16 17:00 – Another lively situation, after the peaks previously reported there was a further movement at 8 UTC that reached Power 46, after this the Frequency increased rapidly towards normal values and this marked the end of intense movements, there were only fluctuations left, mainly of Quality and Frequency around normal values.
5/16 07:30 – Even today we can say that the activity was almost continuous, the period with the least movements was from 21 to 23 UTC yesterday and from midnight the Frequency began to decrease and fluctuations in Amplitude began again. The Frequency stabilized between 7.30 and 7.40 Hz from 4 UTC and at the same time the Amplitude had its first surge at Power 39. A further drop in the Frequency to 7.38 Hz at 5:30 UTC gave the start at the second peak of Amplitude at Power 42 shortly after 6 with a further increase at Power 45 occurred at 7. At the time of this update the Frequency still remains low so it is likely that we will see other activity.
5/15 17:00 – Finally, the frequency returned to rise toward normal values and the activity seems to have ended, from 1 UTC until 16 there were 15 hours of ups and downs with the most intense part from 13 to 15:30 UTC, even if this period was not the one where the highest peak was recorded.
5/15 14:30 – Today seems to be a day of strong activity, after the peak at Power 78 there is only a slight drop in Amplitude but the profound fluctuations in Quality and Frequency continued which continued to decrease to today’s minimum of 7, 30 Hz; all this hinted that we would see other major changes in Amplitude soon. And so it was with Power 65 at 13:50 UTC. The Frequency is still at the minimum so we could see more movements.
5/15 11:30 – Yet another increase, Power 78 was achieved just before 11 UTC while the wide fluctuations in Frequency and Quality continue.
5/15 10:30 – With the Frequency remaining between 7.40 and 7.50 Hz, activity is continuing with wide fluctuations in Quality and Amplitude movements, a new peak at Power 42 occurred at 9:30 UTC and the movements continue. The Black Star is influencing Terra/Gaia.
5/15 09:00 – Even today the calm did not last long, the new charts show a peak at Power 35 at 17:30 UTC yesterday which was followed by a break of about 7 hours until 1 UTC today when a rapid drop in Frequency and a Amplitude leap that reached Power 72 at 2:30 UTC. Since then, the variations have continued even if of a lesser extent mainly linked to the wide fluctuations in Frequency and Quality. At the time of this update, the frequency is below 7.40 Hz.
5/14 17:00 – There was very little calm after the strong peak at Power 65 at 9 UTC this morning, the Frequency remained low for most of the time with a slight rise around 13 UTC but to immediately return to drop below 7.40 Hz, where it is swinging even at the time of this update. From 14:30 UTC started also slight movements of the Amplitude which reached Power 20 at 15:30.
5/14 10:00 – The increase that we expected happened, both in Amplitude, which reached Power 65 at 9:20 UTC, and in Quality which saw a further increase. The Frequency continues to remain very low, at 7.25 Hz and it is therefore likely that we will see further activity.
5/14 08:00 – The new graphs show an “unstable” situation, the Amplitude has remained at minimum values for most of the time after yesterday’s peak but the Quality has continued to fluctuate. The Frequency throughout this period has remained below the base value of 7.83 Hz and has started to decrease from 3 UTC, at the same time we also see the increase in the value of Quality and some slight movements in the Amplitude graph. From 6:30 UTC the activity took off with a first peak of Amplitude which reached Power 42 together with a maximum of Quality and the Frequency that fell below 7.30 Hz. Now we are at Power 45 and apparently rising.
5/13 17:00 – The four hours of activity of the UTC morning was the only movement of today’s graphs, Power 80 was however a very strong value and although short-lived, for about 20 minutes the Amplitude remained above Power 50. Note that the frequency, after these movements, did not return around the base value but has stabilized between 7.50 and 7.70 Hz while the quality has continued to oscillate, hence the coloring of the last part of the main graph.
5/13 11:00 – The maximum peak of this phase was at Power 80 reached at 10 UTC during a phase in which the Frequency started to rise again. This first phase of activity lasted 4 hours, from 7 to 11 UTC.
5/13 09:30 – The activity is continuing and the new amplitude maximum just reached has exceeded 40 reaching Power 43, the frequency continues to remain very low. On a statistical level we would like to show the graph that we used yesterday which today shows quite significant data, this to highlight that even if the data we normally use are collected in Russia the variations are on a planetary level.
5/13 09:00 – We finally found out that the problem was probably on the source website that was not updating the images, now the situation has returned to normal. The graphs show for May 12 a period of activity of about 8 hours, from 5 to 13 UTC, within which the remarkable peak of Power 52 was reached at 9, this corresponded to a peak in Quality and a minimum in Frequency. From 13 UTC an almost calm condition returned and lasted until today at 6 UTC when a series of rapid variations brought the Amplitude repeatedly above Power 30 with the maximum at Power 39 at 8:30 UTC. Also, for this activity there is a marked increase in Quality and a sudden drop in Frequency which has reached the minimum of the last few days at 7.27 Hz.
5/12 17:00 – It is difficult to make updates based on the data shown by these graphs, what can be said is that there are no relevant movements, we could say that the situation is calm. There are isolated peaks but these, due to the position of the detectors, are due to external factors and not proper to the Schumann Resonance. To return to normal data reports we will have to wait for the usual graphs to be updated. However, we will update the current chart which has temporarily replaced the usual one even if the cadence is much wider.
5/12 08:30 – The situation has not changed, the data is still missing and the graph is not updated, which is unusual, generally even if the data is not recorded the graph is updated, at least on the date. This time it’s not and it suggests that there are more serious problems … What we see above is, instead, an alternative data source located in Italy. The graph shows the electric field from 1 to 100 Hz, we prefer not to go into excessive explanations as higher technical knowledge is needed and we would create more questions than anything else, what is clear is that it does not seem we’re having much activity in progress in the last hours. The upper part of the image is today, the lower part is from the last days.
5/11 20:30 – Images are not being updated, we’re still stuck at the same from this morning UTC. One of the recent longest blackout was in October 2019 when it lasted more than 2 days, in 2020 there have been few, lasting generally less than a day.
5/11 17:00 – Blackout continues.
5/11 14:30 – Still in dark mode…
5/11 12:30 – The new graphs still show a calm condition even if in the last hours of the data received there have been some ripples in the Amplitude that has repeatedly reached Power 10, from 23 to 3 UTC. And at that the data transmission stopped, so it’s about 10 hours of blackout. It is also noted that from around midnight UTC the Frequency has constantly risen to high values. We will see when the data transmission will resume what the situation will be.
5/10 17:00 – The calm lasted for the whole extension of today’s graph, the only movement, excluding the previous one to Power 8 actually not very relevant, was at 14 UTC with Power 17. Nothing else to report for Quality and Frequency that remained on normal values.
5/10 08:00 – These are the images of a situation of calm, Amplitude and Quality at minimum and Frequency on the base value, we are approaching the 12 consecutive hours of flat calm.
5/09 17: 00 – Today’s moderate activity lasted about 10 hours, from 3 to 13 UTC. After the peak at Power 34 at 8 UTC another followed at 9:30 and reached Power 25 after which a slow descent began with movements around 15, normal values were reached at 13 UTC. The only parameter that has not yet returned to the base value is the Frequency which continues to tend to remain around 7.60 Hz.
5/09 08:30 – After almost two days of total calm, the activity returned to show itself at 4 UTC today with a first isolated peak that reached Power 19. This first movement was anticipated by a series of fluctuations in Quality and a gradual drop in Frequency started around 1 UTC. As these two parameters deviated from the normal values, the Amplitude also reacted and from 6 UTC it began a rapid increase that reached the maximum of Power 34 at 8 UTC.
5/08 17:00 – Total calm, all the values are back to normal.
5/08 14:00 – The almost total calm is continuing, very slight variations in Quality have given the main graph a green color from 6 UTC. The Frequency has dropped slightly to around 7.60 Hz from 9 UTC while the Amplitude has remained at minimum values.
5/08 07:00 – After several days of strong activity, in the graph of the last 3 days we can see a genera calm, apart from the 2 hours of strong activity yesterday. Today we see Power 10 at 1 UTC in a minimal movement with all the parameters on normal values.
5/07 17:00 – The peaks previously reported were followed by a period of 4 hours of calm until 8 UTC when the Frequency gradually began to decrease, this movement lasted until 14 UTC and was accompanied by a slight increase in both Quality and Amplitude, the latter reached the maximum value of Power 15 at 11. Now we are back to calm.
5/07 07:00 – Today the calm did not last long, shortly after midnight UTC a strong variation brought Amplitude to Power 50, for about 40 minutes it maintained this level reaching Power 53 just before 2 UTC when there was a new movement that generated the strongest peak so far of Power 66 at 2. Just reached this maximum there was a rapid descent that at 3 brought the Amplitude back to normal values. The Quality has always remained on normal values while the Frequency has followed the events starting the decrease at the same time as the Amplitude reaching the minimum of 7.38 at 2 UTC and then starting the ascent. At the time of this update, the Frequency has dropped back to around 7.50 Hz and there are very slight movements in the other parameters are noted.
5/06 17:00 – The calm that began yesterday at 13 UTC lasted until 14 UTC today when a momentary isolated peak reached Power 30, little movement even for the other parameters, Quality and Frequency. The duration of this movement was approximately 1 hour after which it has been calm.
5/05 17:00 – After the previously reported peak there was a sudden rise of the Frequency which in 2 hours, from 11 to 13 UTC, returned to normal values, in parallel both the Amplitude and the Quality also fell towards calm. From 14 we are in a calm condition.
5/05 13:00 – Today the activity began calmly, from 7 UTC there is a gradual drop in frequency which reached the minimum value of 7.28 hz at 11, at the same time when there was a peak in Quality at 8.70. The increase in the amplitude of the cycles has increased in parallel with the decrease in the Frequency and has also reached the maximum value so far of Power 45 at 11 UTC. This was followed by a slight drop but since the Frequency remains low it is likely that we will see other movements.
5/04 21:30 – We are now in a gradual descent, it is interesting to summarize the peaks reached during this phase (UTC times):
11 – Power 91
12 – Power 70
14 – Power 61
15 – Power 61
17 – Power 50
18 – Power 37
21 – Power 20
5/04 17:00 – From the beginning of today’s movements at 7 UTC, 10 hours ago, there has been no interruption, there have been two particularly intense periods, from 10 to 12 UTC when we have been constantly above Power 60, and from 14 to 16 UTC when the Amplitude has always remained above Power 50. Apart from a short period of time of about 30-40 minutes around 13 UTC, from 8 to 16, then 8 hours, we have been constantly above Power 37, quite impressive, do we understand the message from Terra/Gaia?
5/04 14:30 – The activity of the best days distinguishes today, after the very strong peak at Power 91, there has been a short break of about 45 minutes at Power 32 before the new increase in progress that is reaching Power 70 at the time of this update. While the Quality remains at minimum levels (and therefore the ECC is not at stratospheric values), the Frequency remains below the base value.
5/04 12:00 – The series of peaks in constant increase continues, after the 77 previously reported others followed in rapid succession exceeding 80 until reaching Power 91 shortly after 11 UTC. The graphs show strong fluctuations in Quality and Frequency as well.
5/04 10:30 – The script is repeating itself, 15 hours of total calm, from 15 UTC yesterday until 6 UTC today when abrupt changes in Quality and Frequency started which were followed by Amplitude movements that reached a first peak at 8 UTC up to Power 50. The Frequency continued to decrease to 7.32 Hz and this minimum further increased the maximum amplitude value bringing it to Power 77 at 10 UTC.
5/03 17:00 – Today’s activity lasted 11 hours, from 3 to 14 UTC when a last peak at Power 49 seems to have closed a strong sequence that has always been increasing. May seems to be a crucial month, we shall see if the Schumann Resonance will ‘resonate’ appropriately. The situation at the time of this update seems to have returned to calm even if the Frequency is not yet back at the base value, it is still quite low, so other slight movements may occur.
5/03 12:00 – Today so far it has been a continuous crescendo, after the last update we had a peak at Power 65 at 9 UTC, one at Power 72 at 10 and, like a clock, Power 80 at 11 UTC. At 11 o’clock there is a drop in Quality, part of the wide oscillations, and the Frequency which always remains at fairly low levels.
5/03 08:00 – Another increase, after the previous peak, a rapid and short drop before going back to Power 63 at 9 UTC. As before Quality in ever wider oscillations and low Frequency.
5/03 08:00 – As anticipated, the activity is continuing, it started at 3 UTC and with a slow and constant increase it reached the maximum value so far of Power 43 at 7:30 UTC. The oscillations of the Quality increased in intensity without however reaching high values while the frequency continued to decrease until it reached 7.32 Hz.
5/03 06:30 – Once again a period of calm, lasting about 15 hours, from 12 UTC yesterday to 3 this morning. All values measured during this period remained stable at basic levels. From 3 UTC there is a gradual increase in Amplitude which at the time of this update reached Power 20, this movement is accompanied by an equally increase in Quality and a less gradual decrease in Frequency which is going below 7.40 Hz. There is the feeling that the activity can continue to increase.
5/02 17:00 – Calm.
5/02 13:00 – We hope you like the constantly updated charts! Today’s situation, after the final part of the activity previously reported yesterday, shows a period of almost calm that started at 22 UTC yesterday and that lasted for about 10 hours until 8 UTC today. During this period, the Amplitude and the Frequency remained on normal values while the Quality had a variation between 3 and 4 UTC. The first isolated peak of Amplitude at 8 UTC reached Power 20, the second, still isolated, reached Power 18 at 8 UTC and the last, isolated as well, reached Power 41 at 11:40 UTC. While these peaks occurred, the Frequency, as it almost always happens, has had wide oscillations towards lower values, but not too low.
5/01 23:00 – Today we worked hard to make the way that the main chart is updated independently of these textual updates, the work is not yet finished but I think it was worth it already! As for the situation, we see that from 15 to 19 UTC the activity was powerful with 3 major peaks at Power 58, 47 and 30. A further isolated peak reached Power 34 at 21:30 UTC. There have also been wide fluctuations in Quality, indicating that the “message” has not always been the same while the Frequency has had a sharp drop between 17 and 19 UTC.
5/01 17:00 – Even today, little or no calm, after the movements described previously we had an isolated peak that reached Power 44 shortly before 12 UTC. In the following 3 hours there were fluctuations in Quality and Frequency but the Amplitude remained at normal values. From 15, however, a rapid drop in Frequency began and once again an increase in Amplitude which in one hour, at 16 UTC, reached today’s maximum at Power 58. Frequency is still very low at the time of this update so it is possible that the activity continues.
5/01 08:30 – There was the impression that the activity would have continued and it did. Resuming from the last update, where we highlighted the frequency that remained high, it remained so, with the Amplitude on normal values, until 2 UTC when a rapid drop began. At the same time, the Amplitude gradually started to rise to reach the maximum at Power 58 just before 7 UTC. This peak was followed by a new drop towards Power 20 and with an increase in frequency.
Frequency means how many wave cycle happen in a second, 1 Hz. means 1 cycle per second, 40 Hz. means 40 cycles per second, Amplitude is the size of the vibration, how big is the wave, the chart shows the frequency variation in Hz and the amplitude using the white color.
Note
The Ancient Indian Rishis called 7.83 Hz the frequency of OM. It also happens to be Mother Earth’s natural heartbeat rhythm Schumann resonances are named after professor Schumann who was involved in early German secret space program and was later paper-clipped into the United States. The frequencies of Schumann resonances are fairly stable and are mainly defined by the physical size of the ionospheric cavity. The amplitude of Schumann resonances does change and is bigger when ionospheric plasma gets excited. Ionospheric plasma excitation happens because of solar activity, thunderstorms, use of scalar plasma weapons and HAARP and lately also when the Light forces are clearing the plasma anomaly.
Schumann Resonance Today – Energy of Consciousness Currents
All the SR daily images in one single page See the Images
Explanation of The Chart
The Schumann Resonance Spectrogram Chart
The Schumann Resonance Chart displays data from the magnetic field detector to monitor the resonances occurring in the plasma waves constantly circling the earth in the ionosphere. These three days spectrograms show the activity occurring at the various resonant frequencies from 1 to 40 Hz. Within the spectrogram, the power, or intensity level of each frequency is displayed as a color, with white being the most intense. The Schumann Resonances appear as the horizontal lines at 0.0, 4.0, 8.0, 12.0, 16.0, 20.0, 24.0, 28.0, 32.0, 36.0 & 40.0 Hz. This chart is based on Tomsk, Russia, time UTC +7 (UTC = Universal Time Coordinated).
What is a Spectrogram?
The Spectrogram Calendar is a visual representation of the range of frequencies in the magnetic field at a given location. Similar to how an equalizer displays the frequency content of music played on your stereo, the spectrogram calendar displays the frequency content of a magnetic field. Instead of showing a brief snapshot, it shows changes over a period of time, in this case 3 days.
The local magnetic field is a dynamic field that changes constantly because of variations in the ionosphere and sun and many other influences not yet fully understood. The range of variation displayed in the spectrogram chart is from 0 to 40 cycles per second. The vertical axis is frequency and the horizontal axis is time. The amplitude of a particular frequency at a specific time is represented by the intensity of color (green, yellow, white) of each point in the image.
Returning violence for violence multiplies violence, adding deeper darkness to a night already devoid of stars. Darkness cannot drive out darkness: only love can do that.
Martin Luther KingThe
Schumann Resonance Today. We will try to keep you updated about the variations of the Resonance with this page. The great variations that nobody can explain but that give us a clear sign that the planet is changing. The Earth is vibration higher and higher, just like us!
The Chart time is based on Tomsk – Russia – UTC (Universal Time Coordinated) +7 –Source
SR Base Frequency 7.83 Hz. – Schumann Resonance Today’s Peaks
21
Amplitude
8
Quality
7.95
Frequency Max
7.33
Frequency Min
12
Ampltude A2
8
Ampltude A3
6
Ampltude A4
“Every second, a multitude of pulses travel around the world in this unique, resonant chamber between Earth and the ionosphere, sending colluding signals to all microorganisms. These signals couple us to the Earth’s magnetic field. Named after their discoverer, these Schumann Resonances (SR) drive the harmonizing pulse for life in our world.” Eric Thompson
5/28 17:00 – The slight activity shown in the graphs lasted about 8 hours, the most intense phase was from 7 to 9 UTC when there were large frequency fluctuations. From 13 UTC the situation has normalized even if the Frequency remains basically low.
5/28 12:00 – The calm period shown in the new graphs lasted about 18 hours, until 3 UTC this morning, when the Frequency started to oscillate with a gradual descent towards the minimum value of 7.33 Hz. The Amplitude also started oscillations reaching Power 21 shortly after 4 UTC and again at the same time as the minimum frequency peak at 8 UTC.
5/27 17:00 – Calm.
5/27 10:30 – After yesterday’s powerful activity, there were only 4 hours of calm, from 17 to 21 UTC. The movements that started then were however very light although steadily increasing. The Amplitude began to touch Power 10 from 3:30 UTC culminating with the maximum value so far of Power 23 reached at 7:30 UTC. Frequency remained basically stable slightly below the base value of 7.83 Hz.
5/26 17:00 – The movements seem to have calmed down, the descent towards the minimum values began at 14 UTC when the Frequency also started a jagged ascent; from 16 UTC the situation seems calm.
5/26 15:30 – Today’s activity, apart from the black hole, has so far been very powerful. To us, conspiracy theorists who don’t believe in coincidences, screeches a lot that during the peak phase there was this suspicious darkening where probably a more than significant value was reached; who cares, things do not change much in the end. Probably today the combination of Amplitude, Frequency and Quality would have brought the value of the ECC to touch the 500. The part after the hole, however, saw very wide oscillations that reached and exceeded Power 70 at 11:40 and at 13:15 UTC.
5/26 12:00 – After a temporary interruption of the data source site, the situation has partially returned to normal and what we see is massive activity! The first period of activity started at 2 UTC when the Amplitude started a steep climb which led to the strongest peak of this first phase of Power 67 at 3:30 UTC. This was followed by about 2 hours above Power 50. This first move ended at 5:30 UTC. At 7 UTC a new surge, constant and continuous, brought Amplitude to Power 72 at 8:20 UTC. This phase was interrupted by a BLACKOUT that started at 9 UTC and ended at 11:30 UTC, too bad, there were probably other very significant peaks … I don’t think we’ll ever know. At the moment of this update the Amplitude is still rising around Power 70.
5/26 09:00 – The TSU website is down, cannot be reached. While we wait to the site to return online we are going to use this temporary chart, it shows light activity that started little before 6 am UTC.
5/25 17:00 – Today has been a day in which there were no Amplitude movements that exceeded Power 11, this maximum was touched around midnight UTC, at 4 and at 13:30 UTC the Amplitude approached Power 10. The frequency, since few hours, is steadily and gradually decreasing, at the time of this update it is around 7.55 Hz and an isolated Amplitude movement is being generated that has reached Power 17.
5/24 17:00 – After the activity previously reported, the peak at Power 47 at 7 UTC followed by a minor movement that reached Power 24 at 8:30 UTC, the situation returned calm. This until 15 UTC when the Frequency has started to decrease until it reached 7.41 Hz at 16:30 UTC. This decrease can be seen in the main graph with the most intense coloring in the last hour. We will see if this decrease will lead to Amplitude’s movements or will be temporary.
5/24 08:00 – After about 18 hours of total calm, at 6:30 UTC today, suddenly, the frequency had a drop from 8.03 Hz to 7.47 in 40 minutes, this gave way to a strong variation of amplitude that at 7:30 UTC reached Power 47; we could paraphrase this event as a person who is trotting at short (Amplitude) and frequent (Frequency) steps who suddenly changes pace to a reduced frequency but with large strides (Amplitude).
5/23 17:00 – Even today we can say that it was not a real calm day, there were some short-lived isolated peaks, Power 17 shortly before 7 UTC and Power 12, lasting about an hour, from 10 to 11 UTC. Some wide fluctuations in Quality, without reaching high values, colored the main graph between 2 and 4 UTC. Frequency remained much of the time around the base value with a slight drop towards the end of the graph.
5/22 17:00 – An isolated peak, lasted about an hour, occurred from 15 to 16 UTC reaching a maximum value of Power 32 and coincided with a decrease in Frequency down to 7.54 Hz. It returned immediately afterwards towards values normal. Today, however, there has never been a real calm, various parameters have oscillated, the one that has had the most movements is the Frequency.
5/22 14:00 – Not much to report today, mainly there was no calm but not even significant activity, slight Amplitude fluctuations with a maximum at Power 10 at 7 UTC, calm in Quality apart from the first hours of the day and Frequency that oscillates around the base value.
5/21 20:00 – The scale of the Amplitude graph has changed and we clearly see that the maximum peak today was Power 50; the activity is continuing with more marked fluctuations also in Quality, the Amplitude has reached Power 21 at 19 UTC while the Frequency is in a phase of constant and gradual decline that has started many hours back, from the past midnight UTC, it has now reached the minimum value recorded today of 7.44 Hz.
5/21 17:00 – A more intense phase of activity began just before 16 UTC and in a few minutes brought the amplitude to today’s maximum peak of Power 51. With the new graphs we will be able to see more exactly how much it has reached given the very small scale of these of today. The frequency continues to remain low around 7.50 Hz.
5/21 15:50 – Moderate activity began at 13 UTC when the Frequency embarked on a slow descent to return, as previously, to 7.50 Hz. This set in motion the Amplitude that has risen above Power 20 from 13:30. UTC with a first Power 28 which was followed by another at 2. At the time of this update, the Frequency started a rapid rise with a consequent decrease in Amplitude.
5/21 09:30 – The new graphs show a situation of slight movements, in the Amplitude graph they are of little entity due to the very large scale, the two movements that are noticed have reached Power 15 at 4 UTC and Power 12 at 8 UTC. The Frequency oscillates around 7.70 Hz moving downward at the time of this update.
5/20 17:00 – The situation has calmed down considerably but the Frequency remains low, around 7.50 Hz.
5/20 13:00 – The first period of activity today lasted about 2 hours, from 4 to 6 UTC and the maximum value of Amplitude was Power 42; the second period also lasted about two hours, from 9:30 to 12 UTC and the maximum value was similar, Power 43. The difference between these two periods of movement is however remarkable in terms of graphic representation as also the other measurements of the Amplitude parameter have undergone strong increases, which have not happened previously, and therefore we see intense colors of yellow, red and green. At the time of this update, the situation seems to be moving towards calm.
5/20 08:30 – After the strong period of activity there was no calm, the amplitude did not undergo great variations but the Quality and even more the Frequency continued to oscillate without interruption. The Frequency at 4 UTC began a rapid drop towards 7.30 Hz, a value on which it remained for about 2 hours and which triggered a peak in Amplitude which reached Power 42 shortly before 5 UTC. The strong oscillations of Frequency are ongoing at the time of this update.
5/19 17:00 – The period of strong activity lasted about 12 hours, from 2 to 14 UTC when the frequency began to gradually rise towards the base levels but not yet reached at the time of this update.
5/19 14:00 – As we expected, given the frequency so low, just before 13 UTC there was a new powerful peak at Power 77 accompanied by the Quality on the rise. Frequency continues to remain at minimum values.
5/19 12:30 – The activity is gradually decreasing, at the time of this update we are around Power 30 but the Frequency remains always low around 7.30 Hz. As often happens the changes in Amplitude can be considered finished when the Frequency returns close to the base value , which hasn’t happened yet. Since the beginning of today’s activity, we have remained above Power 60 for 6 consecutive hours and during this period, from 6 to 7 UTC, the minimum has been Power 90. The Energy of Consciousness Current, for the statistics, reached 190; also on a statistical level on 27 February 2020 the Amplitude reached Power 170 and ECC 378 (due to the fact of a massive increase in the Frequency up to 8.79 Hz).
5/19 07:30 – Just before 7 UTC a new very strong peak was reached Power 110, the movements do not seem to decrease for now, the Frequency remains at minimum levels with very few oscillations.
5/19 06:30 – Very strong activity in progress, from 1 UTC the frequency started a dive that at 3 UTC brought it around 7.23 Hz, when it reached this minimum value, at 2:50 UTC, there was a strong fluctuation in Quality and Amplitude began to rise very quickly to reach two almost identical maximum values of Power 95 at 4 and 5 UTC. From 3:30 UTC we are constantly above Power 70 and at the time of this update we have surpassed Power 100 reaching 103.
5/18 17:00 – After the previous peaks the situation has calmed down considerably even if the Frequency has tended to be low with wide variations, we will see if this will be the reason for further movements or not.
5/18 13:00 – Even today the activity began shortly after 8 UTC when the Frequency started to decrease with a sharp drop to 7.23 Hz, today’s minimum; during this descent both Amplitude and Quality increased, the latter reaching 11.30 at 11 UTC. As for the Amplitude, the first movement reached the maximum value so far of Power 40 at 10 UTC, followed approximately one hour later by Power 36 and Power 23 at 12:30 UTC when the Frequency started a slight rise. At the time of this update the Frequency returned to minimum values so we might see more activity.
5/17 17:00 – Today’s activity, with a nice and flowing teardrop shape, lasted 5 hours, from 9 to 14 UTC; in the central and more intense part, from 10:30 to 12:30, the Amplitude remained constantly above Power 30 with the Frequency below 7.55 Hz. From 14 UTC with a rapid drop in Amplitude and a gradual increase in Frequency, but not towards the base value of 7.83 Hz but around 7.70 Hz, the activity has decreased considerably.
5/17 12:30 – After a period of calm that lasted about 18 hours at 7 UTC today, a marked decrease in the frequency began and gave the go to slight fluctuations in both Amplitude and Quality. These variations have taken on a much more marked characteristic from 9 UTC when the Frequency has approached the value of 7.40 Hz, since then it has been oscillations no more, the Amplitude has started a rapid increase exceeding Power 30 slightly after 10 UTC, Power 40 at 11:30 and Power 60 shortly before 12 when the Frequency has reached the minimum value of 7.40 Hz so far. This coincided with the peak of Power 69 reached at 11:40 UTC. If you have a cat you can observe his behavior in these moments.
5/16 17:00 – Another lively situation, after the peaks previously reported there was a further movement at 8 UTC that reached Power 46, after this the Frequency increased rapidly towards normal values and this marked the end of intense movements, there were only fluctuations left, mainly of Quality and Frequency around normal values.
5/16 07:30 – Even today we can say that the activity was almost continuous, the period with the least movements was from 21 to 23 UTC yesterday and from midnight the Frequency began to decrease and fluctuations in Amplitude began again. The Frequency stabilized between 7.30 and 7.40 Hz from 4 UTC and at the same time the Amplitude had its first surge at Power 39. A further drop in the Frequency to 7.38 Hz at 5:30 UTC gave the start at the second peak of Amplitude at Power 42 shortly after 6 with a further increase at Power 45 occurred at 7. At the time of this update the Frequency still remains low so it is likely that we will see other activity.
5/15 17:00 – Finally, the frequency returned to rise toward normal values and the activity seems to have ended, from 1 UTC until 16 there were 15 hours of ups and downs with the most intense part from 13 to 15:30 UTC, even if this period was not the one where the highest peak was recorded.
5/15 14:30 – Today seems to be a day of strong activity, after the peak at Power 78 there is only a slight drop in Amplitude but the profound fluctuations in Quality and Frequency continued which continued to decrease to today’s minimum of 7, 30 Hz; all this hinted that we would see other major changes in Amplitude soon. And so it was with Power 65 at 13:50 UTC. The Frequency is still at the minimum so we could see more movements.
5/15 11:30 – Yet another increase, Power 78 was achieved just before 11 UTC while the wide fluctuations in Frequency and Quality continue.
5/15 10:30 – With the Frequency remaining between 7.40 and 7.50 Hz, activity is continuing with wide fluctuations in Quality and Amplitude movements, a new peak at Power 42 occurred at 9:30 UTC and the movements continue. The Black Star is influencing Terra/Gaia.
5/15 09:00 – Even today the calm did not last long, the new charts show a peak at Power 35 at 17:30 UTC yesterday which was followed by a break of about 7 hours until 1 UTC today when a rapid drop in Frequency and a Amplitude leap that reached Power 72 at 2:30 UTC. Since then, the variations have continued even if of a lesser extent mainly linked to the wide fluctuations in Frequency and Quality. At the time of this update, the frequency is below 7.40 Hz.
5/14 17:00 – There was very little calm after the strong peak at Power 65 at 9 UTC this morning, the Frequency remained low for most of the time with a slight rise around 13 UTC but to immediately return to drop below 7.40 Hz, where it is swinging even at the time of this update. From 14:30 UTC started also slight movements of the Amplitude which reached Power 20 at 15:30.
5/14 10:00 – The increase that we expected happened, both in Amplitude, which reached Power 65 at 9:20 UTC, and in Quality which saw a further increase. The Frequency continues to remain very low, at 7.25 Hz and it is therefore likely that we will see further activity.
5/14 08:00 – The new graphs show an “unstable” situation, the Amplitude has remained at minimum values for most of the time after yesterday’s peak but the Quality has continued to fluctuate. The Frequency throughout this period has remained below the base value of 7.83 Hz and has started to decrease from 3 UTC, at the same time we also see the increase in the value of Quality and some slight movements in the Amplitude graph. From 6:30 UTC the activity took off with a first peak of Amplitude which reached Power 42 together with a maximum of Quality and the Frequency that fell below 7.30 Hz. Now we are at Power 45 and apparently rising.
5/13 17:00 – The four hours of activity of the UTC morning was the only movement of today’s graphs, Power 80 was however a very strong value and although short-lived, for about 20 minutes the Amplitude remained above Power 50. Note that the frequency, after these movements, did not return around the base value but has stabilized between 7.50 and 7.70 Hz while the quality has continued to oscillate, hence the coloring of the last part of the main graph.
5/13 11:00 – The maximum peak of this phase was at Power 80 reached at 10 UTC during a phase in which the Frequency started to rise again. This first phase of activity lasted 4 hours, from 7 to 11 UTC.
5/13 09:30 – The activity is continuing and the new amplitude maximum just reached has exceeded 40 reaching Power 43, the frequency continues to remain very low. On a statistical level we would like to show the graph that we used yesterday which today shows quite significant data, this to highlight that even if the data we normally use are collected in Russia the variations are on a planetary level.
5/13 09:00 – We finally found out that the problem was probably on the source website that was not updating the images, now the situation has returned to normal. The graphs show for May 12 a period of activity of about 8 hours, from 5 to 13 UTC, within which the remarkable peak of Power 52 was reached at 9, this corresponded to a peak in Quality and a minimum in Frequency. From 13 UTC an almost calm condition returned and lasted until today at 6 UTC when a series of rapid variations brought the Amplitude repeatedly above Power 30 with the maximum at Power 39 at 8:30 UTC. Also, for this activity there is a marked increase in Quality and a sudden drop in Frequency which has reached the minimum of the last few days at 7.27 Hz.
5/12 17:00 – It is difficult to make updates based on the data shown by these graphs, what can be said is that there are no relevant movements, we could say that the situation is calm. There are isolated peaks but these, due to the position of the detectors, are due to external factors and not proper to the Schumann Resonance. To return to normal data reports we will have to wait for the usual graphs to be updated. However, we will update the current chart which has temporarily replaced the usual one even if the cadence is much wider.
5/12 08:30 – The situation has not changed, the data is still missing and the graph is not updated, which is unusual, generally even if the data is not recorded the graph is updated, at least on the date. This time it’s not and it suggests that there are more serious problems … What we see above is, instead, an alternative data source located in Italy. The graph shows the electric field from 1 to 100 Hz, we prefer not to go into excessive explanations as higher technical knowledge is needed and we would create more questions than anything else, what is clear is that it does not seem we’re having much activity in progress in the last hours. The upper part of the image is today, the lower part is from the last days.
5/11 20:30 – Images are not being updated, we’re still stuck at the same from this morning UTC. One of the recent longest blackout was in October 2019 when it lasted more than 2 days, in 2020 there have been few, lasting generally less than a day.
5/11 17:00 – Blackout continues.
5/11 14:30 – Still in dark mode…
5/11 12:30 – The new graphs still show a calm condition even if in the last hours of the data received there have been some ripples in the Amplitude that has repeatedly reached Power 10, from 23 to 3 UTC. And at that the data transmission stopped, so it’s about 10 hours of blackout. It is also noted that from around midnight UTC the Frequency has constantly risen to high values. We will see when the data transmission will resume what the situation will be.
5/10 17:00 – The calm lasted for the whole extension of today’s graph, the only movement, excluding the previous one to Power 8 actually not very relevant, was at 14 UTC with Power 17. Nothing else to report for Quality and Frequency that remained on normal values.
5/10 08:00 – These are the images of a situation of calm, Amplitude and Quality at minimum and Frequency on the base value, we are approaching the 12 consecutive hours of flat calm.
5/09 17: 00 – Today’s moderate activity lasted about 10 hours, from 3 to 13 UTC. After the peak at Power 34 at 8 UTC another followed at 9:30 and reached Power 25 after which a slow descent began with movements around 15, normal values were reached at 13 UTC. The only parameter that has not yet returned to the base value is the Frequency which continues to tend to remain around 7.60 Hz.
5/09 08:30 – After almost two days of total calm, the activity returned to show itself at 4 UTC today with a first isolated peak that reached Power 19. This first movement was anticipated by a series of fluctuations in Quality and a gradual drop in Frequency started around 1 UTC. As these two parameters deviated from the normal values, the Amplitude also reacted and from 6 UTC it began a rapid increase that reached the maximum of Power 34 at 8 UTC.
5/08 17:00 – Total calm, all the values are back to normal.
5/08 14:00 – The almost total calm is continuing, very slight variations in Quality have given the main graph a green color from 6 UTC. The Frequency has dropped slightly to around 7.60 Hz from 9 UTC while the Amplitude has remained at minimum values.
5/08 07:00 – After several days of strong activity, in the graph of the last 3 days we can see a genera calm, apart from the 2 hours of strong activity yesterday. Today we see Power 10 at 1 UTC in a minimal movement with all the parameters on normal values.
5/07 17:00 – The peaks previously reported were followed by a period of 4 hours of calm until 8 UTC when the Frequency gradually began to decrease, this movement lasted until 14 UTC and was accompanied by a slight increase in both Quality and Amplitude, the latter reached the maximum value of Power 15 at 11. Now we are back to calm.
5/07 07:00 – Today the calm did not last long, shortly after midnight UTC a strong variation brought Amplitude to Power 50, for about 40 minutes it maintained this level reaching Power 53 just before 2 UTC when there was a new movement that generated the strongest peak so far of Power 66 at 2. Just reached this maximum there was a rapid descent that at 3 brought the Amplitude back to normal values. The Quality has always remained on normal values while the Frequency has followed the events starting the decrease at the same time as the Amplitude reaching the minimum of 7.38 at 2 UTC and then starting the ascent. At the time of this update, the Frequency has dropped back to around 7.50 Hz and there are very slight movements in the other parameters are noted.
5/06 17:00 – The calm that began yesterday at 13 UTC lasted until 14 UTC today when a momentary isolated peak reached Power 30, little movement even for the other parameters, Quality and Frequency. The duration of this movement was approximately 1 hour after which it has been calm.
5/05 17:00 – After the previously reported peak there was a sudden rise of the Frequency which in 2 hours, from 11 to 13 UTC, returned to normal values, in parallel both the Amplitude and the Quality also fell towards calm. From 14 we are in a calm condition.
5/05 13:00 – Today the activity began calmly, from 7 UTC there is a gradual drop in frequency which reached the minimum value of 7.28 hz at 11, at the same time when there was a peak in Quality at 8.70. The increase in the amplitude of the cycles has increased in parallel with the decrease in the Frequency and has also reached the maximum value so far of Power 45 at 11 UTC. This was followed by a slight drop but since the Frequency remains low it is likely that we will see other movements.
5/04 21:30 – We are now in a gradual descent, it is interesting to summarize the peaks reached during this phase (UTC times):
11 – Power 91
12 – Power 70
14 – Power 61
15 – Power 61
17 – Power 50
18 – Power 37
21 – Power 20
5/04 17:00 – From the beginning of today’s movements at 7 UTC, 10 hours ago, there has been no interruption, there have been two particularly intense periods, from 10 to 12 UTC when we have been constantly above Power 60, and from 14 to 16 UTC when the Amplitude has always remained above Power 50. Apart from a short period of time of about 30-40 minutes around 13 UTC, from 8 to 16, then 8 hours, we have been constantly above Power 37, quite impressive, do we understand the message from Terra/Gaia?
5/04 14:30 – The activity of the best days distinguishes today, after the very strong peak at Power 91, there has been a short break of about 45 minutes at Power 32 before the new increase in progress that is reaching Power 70 at the time of this update. While the Quality remains at minimum levels (and therefore the ECC is not at stratospheric values), the Frequency remains below the base value.
5/04 12:00 – The series of peaks in constant increase continues, after the 77 previously reported others followed in rapid succession exceeding 80 until reaching Power 91 shortly after 11 UTC. The graphs show strong fluctuations in Quality and Frequency as well.
5/04 10:30 – The script is repeating itself, 15 hours of total calm, from 15 UTC yesterday until 6 UTC today when abrupt changes in Quality and Frequency started which were followed by Amplitude movements that reached a first peak at 8 UTC up to Power 50. The Frequency continued to decrease to 7.32 Hz and this minimum further increased the maximum amplitude value bringing it to Power 77 at 10 UTC.
5/03 17:00 – Today’s activity lasted 11 hours, from 3 to 14 UTC when a last peak at Power 49 seems to have closed a strong sequence that has always been increasing. May seems to be a crucial month, we shall see if the Schumann Resonance will ‘resonate’ appropriately. The situation at the time of this update seems to have returned to calm even if the Frequency is not yet back at the base value, it is still quite low, so other slight movements may occur.
5/03 12:00 – Today so far it has been a continuous crescendo, after the last update we had a peak at Power 65 at 9 UTC, one at Power 72 at 10 and, like a clock, Power 80 at 11 UTC. At 11 o’clock there is a drop in Quality, part of the wide oscillations, and the Frequency which always remains at fairly low levels.
5/03 08:00 – Another increase, after the previous peak, a rapid and short drop before going back to Power 63 at 9 UTC. As before Quality in ever wider oscillations and low Frequency.
5/03 08:00 – As anticipated, the activity is continuing, it started at 3 UTC and with a slow and constant increase it reached the maximum value so far of Power 43 at 7:30 UTC. The oscillations of the Quality increased in intensity without however reaching high values while the frequency continued to decrease until it reached 7.32 Hz.
5/03 06:30 – Once again a period of calm, lasting about 15 hours, from 12 UTC yesterday to 3 this morning. All values measured during this period remained stable at basic levels. From 3 UTC there is a gradual increase in Amplitude which at the time of this update reached Power 20, this movement is accompanied by an equally increase in Quality and a less gradual decrease in Frequency which is going below 7.40 Hz. There is the feeling that the activity can continue to increase.
5/02 17:00 – Calm.
5/02 13:00 – We hope you like the constantly updated charts! Today’s situation, after the final part of the activity previously reported yesterday, shows a period of almost calm that started at 22 UTC yesterday and that lasted for about 10 hours until 8 UTC today. During this period, the Amplitude and the Frequency remained on normal values while the Quality had a variation between 3 and 4 UTC. The first isolated peak of Amplitude at 8 UTC reached Power 20, the second, still isolated, reached Power 18 at 8 UTC and the last, isolated as well, reached Power 41 at 11:40 UTC. While these peaks occurred, the Frequency, as it almost always happens, has had wide oscillations towards lower values, but not too low.
5/01 23:00 – Today we worked hard to make the way that the main chart is updated independently of these textual updates, the work is not yet finished but I think it was worth it already! As for the situation, we see that from 15 to 19 UTC the activity was powerful with 3 major peaks at Power 58, 47 and 30. A further isolated peak reached Power 34 at 21:30 UTC. There have also been wide fluctuations in Quality, indicating that the “message” has not always been the same while the Frequency has had a sharp drop between 17 and 19 UTC.
5/01 17:00 – Even today, little or no calm, after the movements described previously we had an isolated peak that reached Power 44 shortly before 12 UTC. In the following 3 hours there were fluctuations in Quality and Frequency but the Amplitude remained at normal values. From 15, however, a rapid drop in Frequency began and once again an increase in Amplitude which in one hour, at 16 UTC, reached today’s maximum at Power 58. Frequency is still very low at the time of this update so it is possible that the activity continues.
5/01 08:30 – There was the impression that the activity would have continued and it did. Resuming from the last update, where we highlighted the frequency that remained high, it remained so, with the Amplitude on normal values, until 2 UTC when a rapid drop began. At the same time, the Amplitude gradually started to rise to reach the maximum at Power 58 just before 7 UTC. This peak was followed by a new drop towards Power 20 and with an increase in frequency.
Frequency means how many wave cycle happen in a second, 1 Hz. means 1 cycle per second, 40 Hz. means 40 cycles per second, Amplitude is the size of the vibration, how big is the wave, the chart shows the frequency variation in Hz and the amplitude using the white color.
Note
The Ancient Indian Rishis called 7.83 Hz the frequency of OM. It also happens to be Mother Earth’s natural heartbeat rhythm Schumann resonances are named after professor Schumann who was involved in early German secret space program and was later paper-clipped into the United States. The frequencies of Schumann resonances are fairly stable and are mainly defined by the physical size of the ionospheric cavity. The amplitude of Schumann resonances does change and is bigger when ionospheric plasma gets excited. Ionospheric plasma excitation happens because of solar activity, thunderstorms, use of scalar plasma weapons and HAARP and lately also when the Light forces are clearing the plasma anomaly.
Schumann Resonance Today – Energy of Consciousness Currents
All the SR daily images in one single page See the Images
Explanation of The Chart
The Schumann Resonance Spectrogram Chart
The Schumann Resonance Chart displays data from the magnetic field detector to monitor the resonances occurring in the plasma waves constantly circling the earth in the ionosphere. These three days spectrograms show the activity occurring at the various resonant frequencies from 1 to 40 Hz. Within the spectrogram, the power, or intensity level of each frequency is displayed as a color, with white being the most intense. The Schumann Resonances appear as the horizontal lines at 0.0, 4.0, 8.0, 12.0, 16.0, 20.0, 24.0, 28.0, 32.0, 36.0 & 40.0 Hz. This chart is based on Tomsk, Russia, time UTC +7 (UTC = Universal Time Coordinated).
What is a Spectrogram?
The Spectrogram Calendar is a visual representation of the range of frequencies in the magnetic field at a given location. Similar to how an equalizer displays the frequency content of music played on your stereo, the spectrogram calendar displays the frequency content of a magnetic field. Instead of showing a brief snapshot, it shows changes over a period of time, in this case 3 days.
The local magnetic field is a dynamic field that changes constantly because of variations in the ionosphere and sun and many other influences not yet fully understood. The range of variation displayed in the spectrogram chart is from 0 to 40 cycles per second. The vertical axis is frequency and the horizontal axis is time. The amplitude of a particular frequency at a specific time is represented by the intensity of color (green, yellow, white) of each point in the image.
Returning violence for violence multiplies violence, adding deeper darkness to a night already devoid of stars. Darkness cannot drive out darkness: only love can do that.
Martin Luther King
Share this: Send the word out using these buttons!
60 arrested in Georgia in FBI-led child sex trafficking operation. For those still waiting to be arrested, please be patient – we’ll get to you.
Rudy Guilani: ‘If I Dissapear, Biden Documents Will Be Released Immediately’…
Ghislaine Maxwell, who is reported to have been Epstein’s procurer of young girls, is currently preparing to appear publicly “within days” to defend herself, along with the Duke of York.
Many wonder why Victoria Secret reached the headlines… because it was not the undewear being sold, it was the models.
Ginsberg is dying.
President Trump to sign bill making animal cruelty a federal felony later today – ABC News.
Uber loses its license in London after unauthorized drivers uploaded their photos to other’s accounts so that, on at least 14,000 trips, a driver other than the advertised one picked up passengers.
Toddler dies after being struck by ice sculpture at Christmas market in Luxembourg.
The US computer giant Apple agreed to a nearly half-billion-dollar penalty to settle charges that it contracted with a Slovenian software company ATR.SIS d.o.o. that had been sanctioned for drug trafficking.
A major snowfall event occurred over the higher mountains of Switzerland, NW Italy, and E France Saturday evening through Sunday; models were indicating 1.5m (59 inches) would accumulate in 36 hours, word on the ground confirmed the forecast.
Biggest art robbery since WW2: priceless collection of 18th century jewelry, gems and elaborate trinkets known as the ‘Green Vault’ and housed in the Grand Palace, Dresden Germany.
Cut the power to local street lighting by damaging a nearby supply box.
Force their way into Dresden’s Green Vault Museum via a grilled window.
The thieves ignored larger items and focused on the collection’s impressive and immensely valuable gemstones smashing their way into the display cases.
Swift escape back out through that same window.
Note: The security service was actually in the building during the theft.
Active Weather
Tropical Cyclone Rita 61kt ↑ – 1002hPa – NE of Vanuatu
Tropical Storm Sebastien 52 kts ↓- 993hPa ↓ – Central Atlantic N of Azores
Tropical Depression Twentynine 26 kts – 1002hPa – Central Atlantic
Strongest EQ in Europe M3.5 Albania Strongest EQ in US M4.2 Alaska Strongest EQ on the Planet M5.4 Papua New Guinea Deepest EQ M3.9 250 km IndonesiaNews Burst 26 November 2019
Share this: Send the word out using these buttons!
“Is this pretextual use of FISA something that the Justice Department and FBI designed specifically for the Trump-Russia investigation, or is it standard operating procedure in all counterintelligence cases?”
Executive Order 13526
Sec 1.7
“Classification Prohibitions and Limitations. (a) In no case shall information be classified, continue to be maintained as classified, or fail to be declassified in order to:
(1) conceal violations of law, inefficiency, or administrative error;
(2) prevent embarrassment to a person, organization, or agency;
(3) restrain competition; or
(4) prevent or delay the release of information that does not require protection in the interest of the national security.”
Q
When @realDonaldTrump declassifies the FISA docs, we will learn that the Hussein Admin was in clear violation of this EO by classifying info to cover up their treasonous, seditious acts.
Downloadable #pdfDoc ==> #EO No. 13536 on #Classification & #Declassification. #Q sums it up with the #CommonSense that most of us would think should apply in these circumstances
ADM Rogers issues the Oath to NSA employees at NSA/CSS Cryptologic Memorial (“They Served in Silence”) w/names of NSA employees/military mbrs who died in service of this county.
“Service to America requires us today and tomorrow to stand together as champions of freedom and soldiers of liberty who are on the right side of history. Anything less cannot be tolerated if our country is to survive.”
>>3045858
+Content match re: Nunes interview
It will become even more apparent going forward.
Q
#QAnon psot No. 2181…
#Q talks of #FutureProvesPast… The #DevinNunes #Interview post ties to the #POTUS #Tweet with a (#1Delta) 1 minute difference in their individually marked #Timestamps
The impact this event carries will become markedly, ebulliently, present in #SocietalCognizace. Short & sweet graphic showing the varied #Timestamp issues related to inter-platform stamps across numerous #Timezones
An #Anon states: “911 digits #Q interesting!” Q responds “FOR THEM!” Moves & countermoves… We don’t signal our moves to the #Enemy in advance. This is called ‘PANIC’.
On 10 Sep, Q said Non-NSA technology (on social media) unable to read/filter memes (images w/text). FB just announced it will use AI tool (Rosetta) to analyze photos & videos containing text & will use 3rd party fact-checker.
@jsolomonReports reporting on the revelation that came out via #TheHill on #LisaPage’s surfacing #Bombshell! The #FBI had no evidence of the #TrumpCampaign’s collusion with #Russia prior to beginning a #SC!
@jsolomonReports reporting on the revelation that came out via #TheHill on #LisaPage’s surfacing #Bombshell! The #FBI had no evidence of the #TrumpCampaign’s collusion with #Russia prior to beginning a #SC!
TEST [Thursday] by DoD to confirm ‘free-flow’ of direct comms.
POTUS SPEC AUTH REQ [think ‘the football’].
NSA monitoring for any attempts to disrupt and/or term access.
CENTRAL Command.
Q
#QAnon post No. 2186…
#Q dropped the date of the #DoD #EmergencyAlertSystem test. Thursday, 20th Sept, integral function will be tested. For #NationalSecurity; the #NSA will be focused on the #Network’s #Constructs. #CentralCommand leads…
I look forward to a great future for America – a future in which our country will match its military strength with our moral restraint, its wealth with our wisdom, its power with our purpose.
John F. Kennedy
Share this: Send the word out using these buttons!
With PANIC comes MISTAKES.
With PANIC comes BETRAYAL.
With PANIC comes TESTIMONY.
With PANIC comes ………….
These people are STUPID.
FISA GOES BOTH WAYS.
+
HOOAH!
Q
#QAnon post No. 2164 #Decode…
You long time #Q( ‘s) will be all over this drop.
If you’re following the flow of events it’s a straight up post with four links…