Bitcoin miners are headed to Siberian town for cheap electricity.
Social Credit System: facial recognition cameras monitor Chinese students’ in class.
Many local Internet cafes in China aree running cryptojacking malware.
New Firefox browser blocks 3rd-party tracking cookies and cryptominers by default.
Chinese face-swapping app going crazily viral.
3rd 600 km deep EQ in Fiji Islands in 4 days: M6.7 M4.4 M4.7
Farage supports ‘non-aggression pact’ with BoJoh to ensure Brexit happens.
Woody Allen: ‘If I was caught in a love nest with 15 12yo girls people would think, yeah, I always knew that’.
Judge Jeanine [Epstein case]: ‘Setting the stage’ ‘Forces of darkness VS the forces of light’.
Decorated fmr Palm Beach detective who led Epstein investigation dies at 50.
Big Tech & Big Brother meet at Facebook HQ to discuss how to ‘secure’ US elections.
Swedish TV discussing cannibalism for the sake of climate.
Malaysian PM says no sufficient evidence to blame Russia for MH17.
India attempts to set a lander on the Moon on 7 September.
Strongest EQ in Europe M4.7 South of Svalbard.
Strongest EQ in US M3.3 Alaska.
Strongest EQ on the Planet M5.7 Tonga.
Average daytime temperature of the Moon: 101 °C.
Hottest temperature on Earth: Lut Desert, Iran 2005 71 °C.
No new Q post.
News Burst 6 September 2019
Share this: Send the word out using these buttons!
Editor’s Note: Ok, the big blow from Hurricane Dorian is over here in Eastern NC, with little damage to my home/town. Locally, winds did get up to over 100 mph torrential rain, but no real flooding here other than a few low-lying areas in the country around town.
Keshe GANS plasma water is in the hose and placed specifically around my Mother’s pecan trees which are heavily loaded and due to fall in min-Oct. I Am happy to report the pecan remained on the trees (!) which have been shaken loose by past hurricanes, thus the crop has been saved. I heard the storm last night, but it sounded “far away” with no wind/rain/debris actually hitting our house. This product might be a very good investment to have at your home if you live in a weather-prone area. Find details here and here!
By viewing the graph above, we see a very interesting devlopment, short buy intense spike of Schumann Resonance energy were released at 8: AM, and again from 10:00 AM through 11:30 AM. This was followed by a completely blank area showing black at @12:15 until perhaps 12:30 PM (EST).
We have no way of determining exactly what caused this blank space. Perhaps the graphing system was down? Others, more spiritually intuitive perhaps, are saying this is a sign of a totally new frequency not normally seen on 3D Earth…perhaps this is a changing timeline to the new 5D Earth!
Very exciting times we are living in my friends, my best advice is to know true self, follow your heart, and BE…
Schumann Resonance Today. We will
try to keep you updated about the variations of the Resonance with this
page. The great variations that nobody can explain but that give us a
clear sign that the planet is changing. The Earth is vibration higher
and higher, just like us!
The Chart time is based on Tomsk – Russia – UTC +7Source
RS Base Frequency 7.83 Hz.
Schumann Resonance Today Peaks:
9/6 17:00 UTC – Today’s
activity period lasted for about 12 hours, from 23 UTC yesterday to 11
UTC today, now the situation is calm.
9/6 10:30 UTC – The activity today started at midnight UTC with
small variation on the 15 Hz threshold, from 4 UTC the values increased
slightly reaching 20 Hz, at 8 UTC we had the strongest peak until now
that reached 44 Hz.
9/5 17:00 UTC – The activity after the strong movement described
earlier remained calm. The black band is due to lack of data for that
time period.
9/5 10:00 UTC – The TSU site had some glitches until now, the
surprise update shows us a strong activity. The opening was given by an
isolated peak at 55 Hz followed by a period of about 2 hours of strong
movements culminating with a 67 Hz spike at at 8:30 UTC.
9/4 17:00 UTC – Another spike at 27 Hz occurred during a short period of activity lasted 1 hour from 11:30 UTC.
9/4 10:00 UTC – The activity continued uninterrupted even today, the
most significant part up to now has started at 7 UTC and has led to a
peak at 40 Hz just before 8 UTC.
9/3 17:00 UTC – Even in today’s chart we can see that there wasn’t a
real calm. The periods of most intense activity were two: the first
from 7 to 9 UTC which reached the maximum at 20 Hz; the second from 14
to 15 UTC with the maximum at 36 Hz.
9/2 17:00 UTC – The situation, after the previous peaks, is in a phase of calm.
9/2 11:30 UTC – The variations continued practically without
interruption even if with moderate values, at 7 UTC a more significant
activity began which led to a peak at 69 Hz at 8 UTC followed by another
at 40 Hz about an hour later. This period of elevated activity lasted
about 2 hours.
9/1 17:00 UTC – There has been no pause, although without excessive
values the activity has been continuous and seems to last longer. An
isolated peak at 37 Hz occurred at 12:20 UTC.
9/1 09:00 UTC – Movements restarted shortly after the midnight shown
on the chart, corresponding to 17 UTC. Peaks were moderate with the
strongest that reached 36 Hz at 20:30 UTC. After this a period of
variations started with the average value being at 20 Hz for 6
continuous hours, from 23 to 5 UTC this morning.
8/31 17:00 UTC – Today was a day of continuous light activity. The
most active part was from 6 to 10 UTC with two peaks over 30 Hz.
8/30 17:00 UTC – The activity is continuing even if the duration of
the peaks is lower, at the highest peak of today at 68 Hz others
followed, all higher than 55. Since 10:30 UTC today the average has been
above 40 Hz.
8/30 13:30 UTC – At 8 UTC, quite suddenly, started a powerful
activity that after an initial peak at 37 just before 11 UTC led to a
powerful 68 Hz around 13 UTC.
8/30 09:00 UTC – The activity that we have seen started yesterday in
the last part of the chart continued at low but constant levels, so far
there has not been a calm period, even if the maximum peaks have only
reached 17 Hz.
8/29 17:00 UTC – Effectively after the isolated peak of this morning
not much happened, just a glimpse of a movement, actually ongoing, that
started at 16 UTC.
8/29 09:00 UTC – It seems that today will be a day of relative calm,
an isolated quick peak occurred just before 6 UTC and reached 19 Hz.
8/28 17:00 UTC – After the past strong activity, today, has been a
day of relative calm, a light activity occurred from 5 to 11 UTC and the
strongest peak was just before 8 UTC at 17 Hz.
8/27 17:00 UTC – After the previous peak, the activity continued and
seems to be still ongoing. The peaks were slightly lower, at 30 Hz.
8/27 13:30 UTC – After 17 hours of calm, at 4 UTC today, a strong
increase in activity began, at first gradual then from 10 UTC much more
intense. The maximum was reached at 5:20 UTC with 59 Hz.
8/26 17:00 UTC – Four isolated peaks today, spaced one from the
other from about 2 hours from 4 to 9 UTC with the maximum value at 26
Hz.
8/25 17:00 UTC – In total, today’s activity lasted about 9 hours,
from 4 to 13 UTC. During this period there were 3 peaks over 40 Hz. From
7 to 10 UTC.
8/25 09:30 UTC – This morning at 4 UTC started a consistent activity
that seems it could lead to significant peaks. In about 3 hours of
constantly increasing values, at 7 UTC it reached 40 Hz.
8/24 17:00 UTC – Minor activity today, limited from 7 to 11 UTC, the maximum peak was at 20 Hz at 10:30 UTC.
8/23 17:00 UTC – Today’s significant activity was concentrated in
about 5 hours, from 4 to 9 UTC, during this period there were 3 peaks
30, 27 and 25 Kek. After this phase of movement, some latency has
remained.
8/22 17:00 UTC – Even today a sort of continuous but scattered
activity, shortly after midnight on the chart, 17 UTC, there were
variations in amplitude dependencies of a SR frequency of 24 Hz (this
for purists who say that the amplitude does not expresses in Hz). A
further peak (… … … ….) 34 Hz occurred at 12:30 UTC and marked the
beginning of a minor activity that seems to have ended at 17 UTC.
8/21 17:00 UTC – After the peaks previously reported, the situation
gradually returned to normal, only a small flicker at 14 at 13:30 UTC.
8/20 17:00 UTC – The light activity we saw yesterday did not stop
and in this new chart we see that it began to intensify since 20 UTC
yesterday to then generate a significant first peak at 2 UTC which
reached 36 Hz. A few hours later, at 6 UTC, has begun what so far is the
strongest activity of the last few days which led immediately to a peak
of 46 Hz followed by 44 Hz at 7:45 UTC.
8/20 17:00 UTC – Today was characterized by a continuous light
background activity that had its isolated peaks at 37 and 26 Hz at 4:45
and 10:30 UTC respectively.
8/19 17:00 UTC – Another calm day, there were some variations on 10 Hz around 4 and 9 UTC.
8/18 17:00 UTC – Calm.
8/17 17:00 UTC – For the 17th of the month, as often happened, there
was a bit of entertainment with this representation created by this
series of peaks, each lasting about 30 minutes, of a series of bars …
Regarding the values , the 57 Hz previously reported remained the
highest.
8/17 12:00 UTC – Significant activity began this morning at 6 UTC.
The variations have been increasing with peaks at 22, 30, 35, 46 and 57
Hz. The latter occurred shortly after 11 UTC.
8/16 17:00 UTC – A further modest isolated peak occurred at 11:30
UTC with 15 Hz. This interrupted the calm condition that returned soon
after.
8/16 11:30 UTC – Today’s activity until now resulted in 3 isolated
peaks, all around 23 Hz, occurred at 5, 6 and 7:30 UTC. Apart from these
variations it was a condition of calm.
8/15 17:00 UTC – After the peak at 33 Hz the amplitude slowly began
to decrease with peaks always decreasing until reaching normal values at
13 UTC.
8/15 11:00 UTC – Today’s first peak was at 22 Hz at 5:30 UTC and
marked the beginning of today’s variations. A second isolated peak
reached 33 Hz at 8 UTC.
8/14 17:00 UTC – Today’s activity is similar to that of yesterday,
only that it was longer, from 2 to 12 UTC. The maximum peaks were 35 and
37 Hz at 6:30 am and 8:30 UTC.
8/13 17:00 UTC – After the peaks described previously, the variations in amplitude decreased until calm was reached at 13 UTC.
8/13 10:30 UTC – Today is presenting us a medium activity in
progress with variations in the amplitude of the Resonance that started
at 4 UTC. The first peaks were on 25 Hz while the one that is the
highest until now has reached 37 Hz at 7:30 UTC. A further intense peak
reached 32 Hz at 9:30 UTC.
8/12 17:00 UTC – Today there was a light and sparse activity, in the
morning UTC peaks occurred at 15 Hz while at 12 UTC there was a strong
isolated peak at 47 Hz.
8/11 17:00 UTC – Today’s significant movements began around 7 UTC
and soon led to the first of two today’s peaks, 32 Hz at 8 UTC. The
second and greatest peak today was 36 Hz at 9:20 UTC. In total this more
intense phase lasted about 3 hours.
8/10 17:00 UTC – The day continued with rising peaks that after
those reported previously continued until reaching today’s high of 35 Hz
at 10:45 UTC. From 12:30 UTC the situation is calm.
8/10 11:00 UTC – Also today we’re having medium activity, started at
5 UTC. The peaks occurred with amplitude increasing values, from 20 Hz
up to what is the highest until now, 30 Hz at 9:20 UTC.
8/9 17:00 UTC – Dopo il picco riportato in precedenza l’attività è andata calando fino alla calma.
8/9 15:30 UTC – Still light activity, from around 10 UTC very slight
variations have started but have led to a peak at 39 Hz at 14 UTC.
8/9 11:00 UTC – After the powerful peak yesterday the activity
remained calm until 4 UTC today when movements created two consecutive
peaks at 20 Hz. After this slight activity the situation became calm
again.
8/8 17:00 UTC – Today’s activity lasted for about 10 hours, from 6
to 16 UTC. The maximum peak is the one reported previously. Now the
situation is calm.
8/8 14:00 UTC – Today’s graph shows the sudden start of a strong
activity started at 8 UTC, within 30 minutes the maximum peak was
reached at 74 Hz. The movements are continuing with other peaks around
30 Hz.
8/7 17:00 UTC – Today there are only 3 isolated and moderate peaks,
the first at 6:45 UTC at 19 Hz, the second at 7:20 UTC at 15 Hz and the
third and last at 8 UTC at 10 Hz. Before and after these peaks was calm .
8/6 17:00 UTC – Not much to report today, the activity was
concentrated around midnight UTC with a maximum peak at 11 Hz at 00:30
UTC.
8/5 17:00 UTC – The resonance remained at a constant level of
background, from the amplitude graph we note that there is never really a
calm like yesterday. It probably has something to do with the moderate
Geomagnetic Storm (see Space Weather) currently underway with KPI 5.
8/4 17:00 UTC – Light activity from 9 to 12 UTC with two peaks at 19 and 16 Hz.
8/3 17:00 UTC – Calm from 13 UTC.
8/3 09:30 UTC – Yesterday’s light activity, which started just
before the 24 hours of the chart corresponding to 17 UTC, continued
until 19 UTC and the amplitude slightly exceeded 10 Hz. This was
followed by another activity from 00 UTC today and the highest peak at
41 Hz occurred soon after, at 00:20 UTC. Another spike at 40 Hz followed
at 9 UTC.
8/2 17:00 UTC – Today the activity was concentrated in 6 hours, from
2 to 8 UTC, the maximum peak was the one described above. In the last
part of the trip reported, from 14 UTC a constant started but for now
light activity.
8/2 08:30 UTC – Today we are witnessing what appears to be the
beginning of a significant phase of activity, it started at 2 UTC and is
continuing. After a first peak at 29 Hz at 3:30 UTC, a much higher
spike followed reaching 68 Hz at 4:15 UTC.
8/1 17:00 UTC – We returned to a light activity, the significant
part took place from 6 to 12 UTC with the maximum peak of 27 Hz at 7:40
UTC.
Frequency means how many wave cycle happen in a second, 1 Hz.
means 1 cycle per second, 40 Hz. means 40 cycles per second, Amplitude
is the size of the vibration, how big is the wave, the chart shows the
frequency variation in Hz and the amplitude using the white color.
Note
The Ancient Indian Rishis called 7.83 Hz the frequency of OM. It also happens to be Mother Earth’s natural heartbeat rhythm
Schumann resonances are named after professor
Schumann who was involved in early German secret space program and was
later paper-clipped into the United States. The frequencies of Schumann resonances are fairly stable and are mainly defined by the physical size of the ionospheric cavity.
The amplitude of Schumann resonances does
change and is bigger when ionospheric plasma gets excited. Ionospheric
plasma excitation happens because of solar activity, thunderstorms, use
of scalar plasma weapons and HAARP and lately also when the Light forces
are clearing the plasma anomaly.
Dependencies of Amplitudes Schumann Resonance September 6 2019
Dependencies of Quality Schumann Resonance September 6 2019
Dependencies of Frequency Schumann Resonance September 6 2019
All the SR daily images in one single pageSee the Images
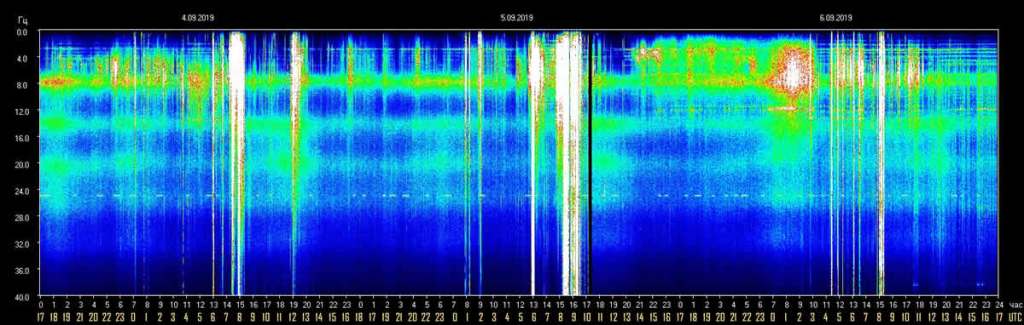
Explanation of The Chart
The Schumann Resonance Spectrogram Chart
The Schumann Resonance Chart displays data from the magnetic field
detector to monitor the resonances occurring in the plasma waves
constantly circling the earth in the ionosphere. These three days
spectrograms show the activity occurring at the various resonant
frequencies from 1 to 40 Hz. Within the spectrogram, the power, or
intensity level of each frequency is displayed as a color, with white
being the most intense. The Schumann Resonances appear as the horizontal
lines at 0.0, 4.0, 8.0, 12.0, 16.0, 20.0, 24.0, 28.0, 32.0, 36.0 &
40.0 Hz. This chart is based on Tomsk, Russia, time UTC +7 (UTC =
Universal Time Coordinated).
What is a Spectrogram?
The Spectrogram Calendar is a visual representation of the range of
frequencies in the magnetic field at a given location. Similar to how an
equalizer displays the frequency content of music played on your
stereo, the spectrogram calendar displays the frequency content of a
magnetic field. Instead of showing a brief snapshot, it shows changes
over a period of time, in this case 3 days.
The local magnetic field is a dynamic field that changes constantly
because of variations in the ionosphere and sun and many other
influences not yet fully understood. The range of variation displayed in
the spectrogram chart is from 0 to 40 cycles per second. The vertical
axis is frequency and the horizontal axis is time. The amplitude of a
particular frequency at a specific time is represented by the intensity
of color (green, yellow, white) of each point in the image.