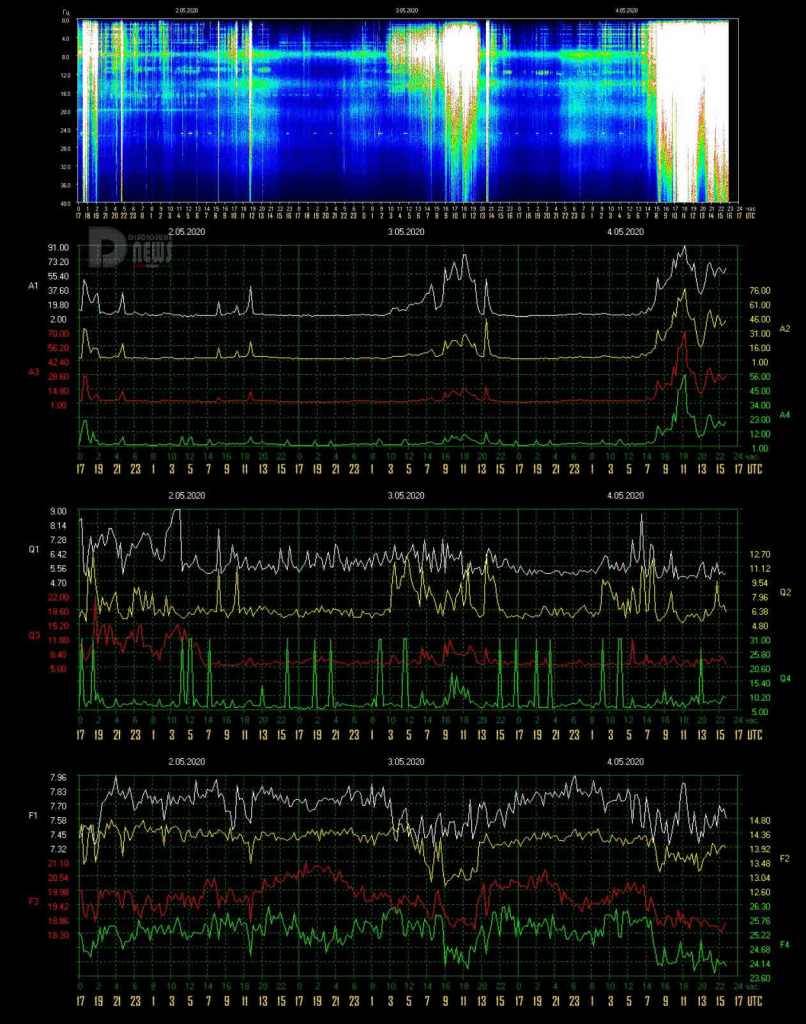
Editor’s Note: Yes, oh yes…the energies, they are a flowin! The graph above shows an almost solid “whiteout” of dense and high amplitude Schumann Resonance energies. Remember…these energies are released from our Planet after cosmic energies cause the earth to “ring like a bell”.
I actually hear these energies? How about you…are you feeling any type of symptoms? Please relax and enjoy your ride into freedom, breathe, drink much water, and then BE in…
Quantum Joy!
___________________________________________________________________________________________
Schumann Resonance Today. We will try to keep you updated about the variations of the Resonance with this page. The great variations that nobody can explain but that give us a clear sign that the planet is changing. The Earth is vibration higher and higher, just like us!
The Chart time is based on Tomsk – Russia – UTC (Universal Time Coordinated) +7 – Source
SR Base Frequency 7.83 Hz. – Schumann Resonance Today’s Peaks
91
Amplitude
8.80
Quality
7.96
Frequency Max
7.34
Frequency Min
76
Ampltude A2
70
Ampltude A3
56
Ampltude A4
“Every second, a multitude of pulses travel around the world in this unique, resonant chamber between Earth and the ionosphere, sending colluding signals to all microorganisms. These signals couple us to the Earth’s magnetic field. Named after their discoverer, these Schumann Resonances (SR) drive the harmonizing pulse for life in our world.” Eric Thompson


Tell Us What You Feel! How to Read the Graphs

- 5/04 14:30 – The activity of the best days distinguishes today, after the very strong peak at Power 91, there has been a short break of about 45 minutes at Power 32 before the new increase in progress that is reaching Power 70 at the time of this update. While the Quality remains at minimum levels (and therefore the ECC is not at stratospheric values), the Frequency remains below the base value.
- 5/04 12:00 – The series of peaks in constant increase continues, after the 77 previously reported others followed in rapid succession exceeding 80 until reaching Power 91 shortly after 11 UTC. The graphs show strong fluctuations in Quality and Frequency as well.
- 5/04 10:30 – The script is repeating itself, 15 hours of total calm, from 15 UTC yesterday until 6 UTC today when abrupt changes in Quality and Frequency started which were followed by Amplitude movements that reached a first peak at 8 UTC up to Power 50. The Frequency continued to decrease to 7.32 Hz and this minimum further increased the maximum amplitude value bringing it to Power 77 at 10 UTC.
- 5/03 17:00 – Today’s activity lasted 11 hours, from 3 to 14 UTC when a last peak at Power 49 seems to have closed a strong sequence that has always been increasing. May seems to be a crucial month, we shall see if the Schumann Resonance will ‘resonate’ appropriately. The situation at the time of this update seems to have returned to calm even if the Frequency is not yet back at the base value, it is still quite low, so other slight movements may occur.
- 5/03 12:00 – Today so far it has been a continuous crescendo, after the last update we had a peak at Power 65 at 9 UTC, one at Power 72 at 10 and, like a clock, Power 80 at 11 UTC. At 11 o’clock there is a drop in Quality, part of the wide oscillations, and the Frequency which always remains at fairly low levels.
- 5/03 08:00 – Another increase, after the previous peak, a rapid and short drop before going back to Power 63 at 9 UTC. As before Quality in ever wider oscillations and low Frequency.
- 5/03 08:00 – As anticipated, the activity is continuing, it started at 3 UTC and with a slow and constant increase it reached the maximum value so far of Power 43 at 7:30 UTC. The oscillations of the Quality increased in intensity without however reaching high values while the frequency continued to decrease until it reached 7.32 Hz.
- 5/03 06:30 – Once again a period of calm, lasting about 15 hours, from 12 UTC yesterday to 3 this morning. All values measured during this period remained stable at basic levels. From 3 UTC there is a gradual increase in Amplitude which at the time of this update reached Power 20, this movement is accompanied by an equally increase in Quality and a less gradual decrease in Frequency which is going below 7.40 Hz. There is the feeling that the activity can continue to increase.
- 5/02 17:00 – Calm.
- 5/02 13:00 – We hope you like the constantly updated charts! Today’s situation, after the final part of the activity previously reported yesterday, shows a period of almost calm that started at 22 UTC yesterday and that lasted for about 10 hours until 8 UTC today. During this period, the Amplitude and the Frequency remained on normal values while the Quality had a variation between 3 and 4 UTC. The first isolated peak of Amplitude at 8 UTC reached Power 20, the second, still isolated, reached Power 18 at 8 UTC and the last, isolated as well, reached Power 41 at 11:40 UTC. While these peaks occurred, the Frequency, as it almost always happens, has had wide oscillations towards lower values, but not too low.
- 5/01 23:00 – Today we worked hard to make the way that the main chart is updated independently of these textual updates, the work is not yet finished but I think it was worth it already! As for the situation, we see that from 15 to 19 UTC the activity was powerful with 3 major peaks at Power 58, 47 and 30. A further isolated peak reached Power 34 at 21:30 UTC. There have also been wide fluctuations in Quality, indicating that the “message” has not always been the same while the Frequency has had a sharp drop between 17 and 19 UTC.
- 5/01 17:00 – Even today, little or no calm, after the movements described previously we had an isolated peak that reached Power 44 shortly before 12 UTC. In the following 3 hours there were fluctuations in Quality and Frequency but the Amplitude remained at normal values. From 15, however, a rapid drop in Frequency began and once again an increase in Amplitude which in one hour, at 16 UTC, reached today’s maximum at Power 58. Frequency is still very low at the time of this update so it is possible that the activity continues.
- 5/01 08:30 – There was the impression that the activity would have continued and it did. Resuming from the last update, where we highlighted the frequency that remained high, it remained so, with the Amplitude on normal values, until 2 UTC when a rapid drop began. At the same time, the Amplitude gradually started to rise to reach the maximum at Power 58 just before 7 UTC. This peak was followed by a new drop towards Power 20 and with an increase in frequency.
Frequency means how many wave cycle happen in a second, 1 Hz. means 1 cycle per second, 40 Hz. means 40 cycles per second, Amplitude is the size of the vibration, how big is the wave, the chart shows the frequency variation in Hz and the amplitude using the white color.
Note
The Ancient Indian Rishis called 7.83 Hz the frequency of OM. It also happens to be Mother Earth’s natural heartbeat rhythm Schumann resonances are named after professor Schumann who was involved in early German secret space program and was later paper-clipped into the United States. The frequencies of Schumann resonances are fairly stable and are mainly defined by the physical size of the ionospheric cavity. The amplitude of Schumann resonances does change and is bigger when ionospheric plasma gets excited. Ionospheric plasma excitation happens because of solar activity, thunderstorms, use of scalar plasma weapons and HAARP and lately also when the Light forces are clearing the plasma anomaly.
Schumann Resonance Today – Energy of Consciousness Currents
Show entriesSearch:
| Time UTC +7 | Amplitude | Quality | A+Q | Freq. | Base Freq. | Delta | ECC Increase | TOTAL ECC |
|---|---|---|---|---|---|---|---|---|
| 04/05/2020 18.00.00 | 91 | 5 | 96 | 7,91 | 7,83 | 0,08 | 8 | 104 |
| 03/05/2020 07:00:00 | 81 | 7 | 88 | 7,28 | 7,83 | 0,55 | 48 | 136 |
| 01/05/2020 07:00:00 | 58 | 8,08 | 66,08 | 7,53 | 7,83 | 0,3 | 20 | 86 |
| 30/04/2020 21:15:00 | 90 | 7,46 | 97,46 | 7,36 | 7,83 | 0,47 | 46 | 143 |
| 29/04/2020 17:00:00 | 76 | 6,91 | 82,91 | 7,31 | 7,83 | 0,52 | 43 | 126 |
| 23/04/2020 10:00:00 | 138 | 4,74 | 142,74 | 7,42 | 7,83 | 0,41 | 59 | 201 |
| 19/04/2020 14:45:00 | 88 | 6,49 | 94,49 | 7,25 | 7,83 | 0,58 | 55 | 149 |
| 18/04/2020 16:15:00 | 110 | 7,21 | 117,21 | 7,26 | 7,83 | 0,57 | 67 | 184 |
| 18/04/2020 14:00:00 | 90 | 7,22 | 97,22 | 7,34 | 7,83 | 0,49 | 48 | 145 |
| 18/04/2020 12:00:00 | 81 | 10,9 | 91,9 | 7,24 | 7,83 | 0,59 | 54 | 146 |
Showing 1 to 10 of 67 entriesPreviousNext
Schumann Resonance Today – Energy of Consciousness Currents Posts

Blessing Of Comet Swann

Major Cosmic Cleansing On The Horizon

Earth/Gaia Surging With Creative Energy!
Schumann Resonance PDF Archives
Images Archive
All the SR daily images in one single page See the Images

Explanation of The Chart
The Schumann Resonance Spectrogram Chart
The Schumann Resonance Chart displays data from the magnetic field detector to monitor the resonances occurring in the plasma waves constantly circling the earth in the ionosphere. These three days spectrograms show the activity occurring at the various resonant frequencies from 1 to 40 Hz. Within the spectrogram, the power, or intensity level of each frequency is displayed as a color, with white being the most intense. The Schumann Resonances appear as the horizontal lines at 0.0, 4.0, 8.0, 12.0, 16.0, 20.0, 24.0, 28.0, 32.0, 36.0 & 40.0 Hz. This chart is based on Tomsk, Russia, time UTC +7 (UTC = Universal Time Coordinated).
What is a Spectrogram?
The Spectrogram Calendar is a visual representation of the range of frequencies in the magnetic field at a given location. Similar to how an equalizer displays the frequency content of music played on your stereo, the spectrogram calendar displays the frequency content of a magnetic field. Instead of showing a brief snapshot, it shows changes over a period of time, in this case 3 days.
The local magnetic field is a dynamic field that changes constantly because of variations in the ionosphere and sun and many other influences not yet fully understood. The range of variation displayed in the spectrogram chart is from 0 to 40 cycles per second. The vertical axis is frequency and the horizontal axis is time. The amplitude of a particular frequency at a specific time is represented by the intensity of color (green, yellow, white) of each point in the image.

What is the Schumann Resonance?
The Herathbeat of Planet Earth Read
Clicks on the Ads Keep Us Alive 🙂

Dreams
Dreams are today’s answers to tomorrow’s questions.
Edgar Cayce
